
ABSTRACT
The four experiments described here are part of a 5-year program focused on determining whether day-neutral and short-day strawberries would be suitable for commercial off-season/winter (temperate climate) production in greenhouses. All research was performed using container-grown plants fertigated through a capillary mat production system with heat supplied under the benches. The first experiment focused on stolon development. The second experiment investigated the influence of stolon removal on berry production and included the removal of flowers for the first three weeks. The third and fourth experiments were conducted as a comparison of university research (experiment 3) versus a commercial operation (experiment 4). In experiment one, of 13 cultivars, ‘AC Wendy’ plants produced significantly more stolons than the other cultivars. In experiment two, stolon production peaked at weeks 12 and 13, with ‘Chandler’ plants producing significantly more stolons (starting at week 9) than the other cultivars. At week 13, ‘Seascape’ plants produced more total berry weight than the other cultivars. The influence of stolon removal on total berry weight varied, with ‘Evie-2+’ plants (large crowns) producing higher total berry weight with the stolons on as compared to ‘Evie-2’ plants, which produced higher total berry weight with the stolons removed. In experiment 2, fruit production was low and was probably a result of deflowering for three weeks. Consequently, it may not be advisable to deflower during the ‘off-season’ for greenhouse-grown strawberries. In the final two experiments, which involved a commercial cooperator as well as the university greenhouse, it was found that of the five cultivars trialed, the same cultivars at both sites produced the maximum total berry weight. Stolon production differed at the two locations, but the optimal time for stolon removal was similar. Thus, it is recommended that for winter greenhouse production, stolons be removed initially at week 8 and then at weeks 11–12 of the production cycle.
Introduction
The United States of America (USA) is the world’s largest producer of strawberries, with the highest production in California, followed by Florida (Morgan, Citation2012). Consumers in the USA are attracted to the complex flavors and taste of the fruit (Colquhoun et al., Citation2012). Hence, there is a demand for strawberries all year round. Arnade and Kuchler (Citation2015) determined that imports during the ‘off-season’ could benefit the strawberry industry by $520 million dollars annually, even if prices remained the same throughout the year. This demand has stimulated research in the USA to develop a commercially feasible method for the production of strawberries in the ‘off season’ (Ballington et al., Citation2008; Paparozzi et al., Citation2010; and Rowley et al., Citation2010).
Temperature and photoperiod have considerable effect on the strawberry plant’s vegetative and reproductive growth. Most production is focused on June-bearers that are sensitive to photoperiod such that flower buds are initiated in the fall when days are short to produce a crop during the May–June season. For June-bearers ‘Chandler’ and ‘Sweet Charlie’, the optimal temperature for shoot growth and root growth is 30/25°C and 20/15°C, respectively. The optimal temperature for fruit yield and fruit size is 20/15°C in ‘Chandler’ and 30/25°C in ‘Sweet Charlie’ (Kadir, et al., Citation2006). Cooler temperature requirements mean less ‘off season’ heating costs. On the other hand, day-neutral cultivars may be better for the ‘off season’ since they are insensitive to day length and will flower and fruit in moderate temperatures. However, they do not initiate flowers above 30°C nor grow when temperatures fall below 2°C (Pritts and Dale, Citation1989). Consequently, successful production at low temperatures would require that operations be shifted to the controlled environment of a greenhouse/heated high tunnel.
Stolon development is also influenced by growing conditions, varietal characteristics, and cultural practices. According to Durner et al. (Citation1984) and Manakasem and Goodwin (Citation2001), for both short- and long-day plants, runner (stolon) production is stimulated by long days and air temperatures above 26° day/22°C night. Leshem and Koller (Citation1965) suggested that this response is due to the increased activation of the vegetative buds on the rosette crown. Darrow (Citation1929) observed that runner removal increased the size of the strawberries. A somewhat different result was reported by Portz and Nonnecke (Citation2010). They found that when runners and flowers were removed, berry weight increased for day-neutral ‘Albion’ and ‘Tribute’ plants but not for ‘Seascape’ plants. With day-neutral ‘Brighton,’ Forney and Breen (Citation1985) demonstrated that fruit production reduced stolon, inflorescence, and branched crown emergence. The accumulation of dry matter in the fruits was probably due to the translocation of reserves from other parts of the plant because the growth rate of leaf buds and crowns approached zero, whereas the dry weight of roots and petioles declined. To allow vegetative growth and to delay fruiting, it was recommended that flower buds be removed for the first five to six weeks (Sanchez, Citation1999; LeBlanc et al., Citation1987; and Pritts and Worden, Citation1988). Takeda and Hokanson (Citation2003) observed that when flowers were removed during the first few weeks of growth, yield and fruit weight increased. Sanchez (Citation1999) also recommended that in day-neutrals, the runners should be removed to increase fruit size.
For most greenhouse operations, soilless culture is preferred and plant performance may depend on the components of the medium and the cultivars. The materials that have been used for growing strawberries include perlite or a mixture of perlite and turface (Mattas et al., Citation1997). A mix of 40% cocopeat and 60% perlite was the best among the seven types of soilless substrates. In this study, ‘Camarosa’ plants produced the highest yield and number of berries per plant among the three cultivars tested (Tehranifar et al., Citation2007). Pine bark was an effective medium for growing ‘Sweet Charlie’ (Cantliffe et al., Citation2007), and in Sicily, Moncada et al. (Citation2008) observed that strawberry plants can be grown in coconut coir dust.
Given the goal of growing strawberries during the winter (‘off’) season in the US, the objectives of this research were to determine: (i) whether there is a difference in stolon production among short-day and day-neutral strawberry plants under winter greenhouse conditions; (ii) whether there is a pattern for stolon production that would allow a single removal of stolons; (iii) whether flower removal improves strawberry production; and (iv) whether the number of stolons influenced fruit production. Finally, to obtain peak production and thus prices for winter-grown berries, separate experiments were conducted to determine whether research data on stolon production/removal can be extrapolated from a university greenhouse to a commercial grower production scale.
Materials and methods
There were four experiments in total. Three experiments were conducted at the University of Nebraska-Lincoln, East Campus (lat. 40°50’N, long. 96°45’W). The greenhouse for these experiments was isolated from other structures, and the interior was monitored with light and temperature sensors. Experiment 4 was conducted with a commercial grower-cooperator at Dwight, Nebraska (lat. 41°08’N, long. 97°02’W). This greenhouse was also monitored as above and was totally isolated from other light sources.
In the first experiment (2010–2011), dormant crowns of 13 different cultivars from different sources of both day-neutral (ever-bearing) and June-bearing response were grown in a soil-lite mix (4% soil, 34% sphagnum peat, 31% ‘horticultural (#2)’ vermiculite, 31% perlite) in 15 cm plastic pots. These were placed on a capillary mat system consisting of a bottom layer of black plastic, the mat and drip tubing, and a covering of white top/black bottom plastic. Holes just large enough for the bottoms of the pots to fit through to the mat were cut using a homemade pot-hole cutter spaced 28 cm between plants within rows and 40.6 cm between plants within the columns. All plants were fertigated daily with 100 ppm N of 20N-4.4P-16.6K through the capillary mat system. Heat was supplied under the benches through forced-air furnaces. The experimental design was a randomized complete block design (RCBD) with 13 treatments (cultivars) and six replications containing one to four plants in each replication. During analysis, it was determined that there is no variability between blocks, so a completely randomized design was used for the data analysis presented here. No flowers were removed in this experiment, so flowering started in early October. On Dec 10, 2010, all stolons were removed in a single effort in order to determine whether different cultivars produced different numbers of stolons.
Table 1. LSMeans for number of stolons produced by 13 different cultivars and sources in experiment 1.
In the second experiment (Sept 14, 2012–2013), dormant crowns of six strawberry cultivars: day-neutral – ‘Albion’, ‘Evie-2’, ‘Evie-2+’, ‘Seascape’, and ‘Seascape+’ and short-day-responsive ‘Chandler’ were planted on Sep 14, 2012, in 15 cm pots filled with two different commercial soilless mixes and set up as per experiment 1. These cultivars were selected from experiment 1 based on the highest berry number and weight. The + symbol indicates a higher grade of crown such that the root system is double or triple the size of the regular grade. In an effort to shift production closer to the period when prices are high (November and December), all flowers produced during the first three weeks of growth (Sept 24, 2012–Oct 14, 2012) were removed before anthesis (Pritts and Worden, Citation1988). The experimental design was a RCBD arranged in a split-plot layout with the cultivars as the main plot. Within each main plot, two soilless mixes and two treatments (remove or leave stolons) were assigned to the subplots for a total of four subplots. There were six replications, each containing a minimum of one pot. The soilless mixes were composed of pine bark, peat, vermiculite, and perlite (mix 1: Fafard® 3B Mix) or 25% bark and 55% peat, perlite, and vermiculite (mix 2: Grower Select M1 Professional Mix) (both BFG Supply Co., Burton, OH). Bumble bees, Bombus impatiens (Koppert Biological Systems Inc., Ann Arbor Michigan), were then introduced to insure pollination. Stolons were removed once every week, when they were between 7.6 and 12.7 cm long. All plants were again fertigated daily with 100 ppm N of 20N-4.4P-16.6K through the capillary mat system. Tip burn due to calcium deficiency was remedied by supplying 100 ppm N from calcium nitrate for one week, followed by three weeks of 100 ppm calcium from calcium carbonate through the fertigation system.
Table 2. LSMeans for number of stolons produced on week 13 in experiment 2 for the six cultivars. Note: in this experiment, flowers were removed for three weeks after appearance (Sep 24, 2012–Oct 14, 2012).
To conduct further examinations of stolon development and to determine whether the university research data can be extrapolated to a grower production scale, two other experiments were conducted: one at the above-mentioned UNL research greenhouse (experiment 3) and the other at the grower-cooperator’s location (experiment 4) simultaneously (Sept 16, 2013–Apr 2014). The five cultivars used in these experiments were ‘Seascape’, ‘Seascape+’, ‘Evie-2’, ‘Evie-2+’, and ‘San Andreas’. The university study had five plants of each cultivar in each block, arranged in an RCBD with 12 replications for a total of 300 plants. The experiment was arranged across two benches that were 1.8 × 18.3 m (6 × 60 ft) and raised .91 m (3 ft).
The grower-cooperator experiment was designed to efficiently use all available space within a heated double polyethylene greenhouse/high tunnel (for construction, see Adams and Paparozzi, Citation2014; Lambe et al., Citation2012). Three similarly constructed benches measuring 1.8 × 21.3 m (6 × 70 ft) and raised 0.91 m (3 ft) were used, having the same five cultivars arranged in an RCBD; however, there were 20 plants per cultivar in each block, for a total of 1200 plants. Both the university and grower-cooperator production structures were equipped with instruments to monitor inside and outside temperatures, humidity, interior photosynthetically active radiation (PAR) infiltration, heating and ventilation energy usage, and water/fertilization events to ensure similar conditions (Meyer et al., Citation2012).
Data collection
In experiments 1 and 2, the date of the first flower for each plant and the total number of flowers removed were recorded. For all four experiments, strawberries were harvested, counted, and weighed daily and totaled weekly for data analysis. Fruits were deemed to be ripe by using an RHS color chart (Red group 44–46), which most closely matched the color of strawberries sold in the supermarket. The data were recorded and collated weekly. For experiment 1, all stolons were removed and counted. In experiment 2, each week the stolons from each plant with the prescribed length were removed, counted, and recorded. In experiments 3 and 4, stolons were counted and removed periodically. This was not carried out weekly at the grower-cooperator site as it was too labor intensive.
Data analysis
Data were analyzed using the analysis of variance (ANOVA) procedure implemented on SAS GLIMMIX (Gbur et al., Citation2012; Littell et al., Citation2006). For the first stolon experiment (2010–2011), we performed pairwise comparisons (t-test) with an alpha = 0.05. The calculated LSMeans are presented in . In the second experiment, we first used ANOVA to determine whether the soilless mix treatments had an impact on the number of stolons. As the soilless mix treatments were not statistically different, this treatment effect was dropped from further analyses. We then examined the impact of cultivar and the ‘leave’ or ‘remove’ stolons treatments. Resulting LSMeans were evaluated using pairwise t-comparisons (alpha = 0.05), and the Slice option was used to compare the ‘leave’ or ‘remove’ stolons treatments for a given cultivar. All of these analyses were conducted on an individual week or total experiment basis. For stolons, as less than half of the ‘Albion’ plants grew or produced fruit consistently, data are presented for the average number of stolons over time only.
For experiments 3 and 4, the total number of stolons harvested at each time period was plotted. Then, University of Nebraska-Lincoln greenhouse data were transformed to the log scale and the GLIMMIX procedure of SAS was programmed to assume a log normal distribution by using the identity link function. The cooperator data did not need to be transformed. The resulting data LSMeans were evaluated using pairwise t-comparisons (alpha = 0.05).
Results and discussion
Experiment 1
There was a significant difference in the number of stolons produced by each cultivar, but there was no difference between short-day and day-neutral cultivars as a group (). That is, ‘AC Wendy’ plants, a short-day cultivar, produced significantly more stolons than any other cultivar including other short-day cultivars such as ‘Clancy’ and ‘Chandler’. There was also a difference between suppliers of the same cultivar. ‘Seascape’ (N) plants were dormant crowns, and thus older and produced more stolons when compared with plants that were freshly dug in late summer/early fall such as ‘Seascape’ (F). ‘Albion’ (B), which were dug in late summer/early fall, also produced more stolons than ‘Albion’ (A) plants, which were received in pots and actively growing. Based on these results, it appeared that certain cultivars were putting more energy into stolons than berries.
Experiment 2
There were no significant differences in stolon or berry production between the two soilless mixes (data not shown). The strawberry plants began producing stolons approximately four weeks after planting, with removal starting at week 6 (October 22) and continuing to week 19 (end of January) (). Stolons were first observed on ‘Albion’, ‘Chandler’, and ‘Evie-2’. From weeks 6 to 9, ‘Albion’ produced the highest average number of stolons. However, after week 9, ‘Chandler’ produced the highest average number of stolons, with nine stolons. Stolon production peaked during the 12th week for ‘Evie-2’, ‘Evie-2+’, ‘Seascape+’, and ‘Albion’ plants (i.e. December 3). ‘Chandler’ and ‘Seascape’ plants showed peak production during the 13th week. As all cultivars plateaued in production by Week 13, we then analyzed the data for Week 13 and found that plants of ‘Chandler’ produced significantly more stolons than plants of ‘Evie-2+’, ‘Seascape’, and ‘Seascape+’ ().
Figure 1. Weekly cumulative number of stolons (mean) present per cultivar from week 6 (October 22) to week 20 of the production timeline for experiment 2.
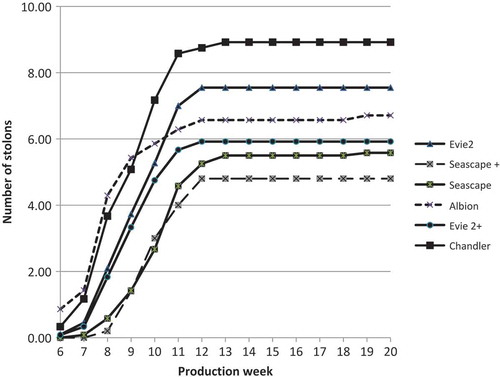
Thus, stolon production peaked in December, with the day-neutral cultivars producing fewer stolons than the June-bearing cultivar. This implies that if a grower was planning on removing stolons once during production, it should occur around weeks 11–13. The decline in stolon production after December is probably a result of short days and low temperatures characterized by that time of the year. This observation is explained by Durner et al. (Citation1984) and Manakasem and Goodwin (Citation2001) in that runner production requires long days and temperatures above 22°C. However, the high number of stolons and continued production of stolons were not anticipated. Short days (days less than 11 h long plus approx.1 h civil twilight) occurred starting October 18, but stolon production continued to increase until December. Thus, it appears that for dormant crowns, 4.5 weeks of long days along with the higher greenhouse temperature was enough to initiate and promote stolon production until the temperature was consistently below 22°C and the day length was between 10 and 11 h (including civil twilight).
Berry weight
There was much variability in the number of berries (data not shown) and their weight over the 20 weeks of production. Before December 31, the highest total mean berry weight was observed in the 13th week (third week of harvest). This coincided with the plateauing of stolon production. At week 13, total berries harvested from ‘Seascape’ plants weighed more than berries from ‘Chandler’ and ‘Evie-2’ plants (). When considering the influence of stolon removal, ‘Evie-2’ plants produced more berry weight when runners were removed, whereas ‘Evie-2+’ plants (bigger crowns) produced more berry weight with the stolons present (); moreover, berries under these two scenarios from both cultivars weighed more than the other cultivars. The total mean berry weight of the other cultivars was not influenced by stolon removal. We suspect that this anomaly might be related to the number of flowers removed for all cultivars except ‘Seascape’, where the number of flowers removed exceeded the total number of berries produced for the entire harvest (). This was in contrast to experiment 1, where plants were not deflowered. In this situation, plants of ‘Seascape’ produced 196 berries, ‘Chandler’ produced 125 berries, and ‘Evie-2’ produced 153 berries over a 7-week harvest period (Paparozzi et al., Citation2010). Thus, the idea of delaying the production of berries to match peak price time by removing flowers is not a good practice for winter greenhouse production. This procedure was based on previous recommendations (Sanchez, Citation1999; LeBlanc et al., Citation1987; and Pritts and Worden, Citation1988). However, these recommendations were for field trials during a summer growing season with long photoperiods and plenty of light. Although supplemental lighting could be a solution, it would be costly, particularly for developing countries.
Table 3. LSMeans for berry weight at week 13 in experiment 2. Note: in this experiment flowers were removed for three weeks after appearance (Sep 24, 2012–Oct 14, 2012).
Table 4. LSMeans for the influence of stolon removal on berry weight of each cultivar measured at week 13 of experiment 2. Note: in this experiment flowers were removed for three weeks after appearance (Sep 24, 2012–Oct 14, 2012).
Table 5. LSMeans for berry weight compared with the total number of berries produced for each cultivar over the entire 10-week harvest period and the total number of flowers removed during the first five weeks of experiment 2.
Experiment 3 (university) and experiment 4 (commercial grower-cooperator)
In the follow-up experiments at the University of Nebraska-Lincoln (experiment 3) and the grower-cooperator (experiment 4) at Dwight, Nebraska, the four most productive cultivars and a new, highly recommended cultivar were selected. Total stolon production decreased during the 92-day period of observation in the University experiment ( and ) but not in the grower-cooperator experiment. The maximum stolons were removed initially on day 15 (week 8 of the production cycle) in the University experiment but not at the grower-cooperator location, where the peak removal was at day 32, about two weeks later (week 11 in the production cycle). This was true for all cultivars.
Figure 2. Actual total number of stolons removed during a 99-day period for five cultivars at Lincoln (experiment 3). The initial day of stolon removal corresponded to week 8 (day 15; November 5) in the production timeline.
Figure 3. Actual total number of stolons removed during a 99-day period for five cultivars at the grower-cooperator location (experiment 4). Day 18 is November 8, which corresponds to week 8.5, and day 32 corresponds to week 11 (November 22) in the production timeline.
Not only was the pattern for the production of stolons different between the two locations, but the cultivars responded differently in terms of the average number of stolons produced per plant. At the University location, ‘Evie-2’ and ‘Evie-2+’ plants produced significantly more berry weight per pot than any other cultivar (). However, initially ‘Evie-2’ produced more stolons than any other cultivar (). At day 22 and day 29, ‘Evie-2+’ produced more stolons than the other cultivars. This all changed at day 36, with ‘Seascape’ now producing the highest number of stolons. At day 43, both ‘Evie-2’ and ‘Evie2+’ produced less than all other cultivars, with ‘San Andreas’ at the highest. At week 50, ‘San Andreas’ continued to produce more stolons than any other cultivar. By day 57 (late December), stolon production was very low, but ‘Evie-2’ and ‘Evie-2+’ were still producing significantly less than ‘San Andreas’ and ‘Seascape’. Overall, removing stolons from ‘Evie-2’ and ‘Evie-2+’ at days 15 and 36 would be the most efficient. ‘Seascape’, ‘Seascape +’, and ‘San Andreas’ may need additional stolon removal at days 43 and 50. However, it should be noted that from these data, overall, ‘Seascape+’ plants produced the fewest runners and would seem to be the best choice for winter production. Unfortunately, ‘Seascape+’ plants did not produce as much berry weight per pot as did ‘Evie-2’ and ‘Evie 2+’.
Table 6. LSMeans for berry weight per pot (pounds) for the five cultivars grown in the greenhouse during the first 16 weeks of the experiment at University of Nebraska-Lincoln and the cooperator greenhouse in Dwight, Nebraska.
At the grower-cooperator location, ‘Evie-2+’ plants produced significantly more berry weight per pot than any other cultivar (). ‘Evie-2’ plants produced less than ‘Evie-2+’ plants but more than the other three cultivars. Thus, the yield was similar at both locations. However, stolon production was not (). At all stolon-harvest days except for day 1, ‘Seascape’ produced the highest number of stolons. On stolon-harvest days 1, 9, and 18, ‘Evie-2’ and ‘Seascape’ produced more stolons than the other cultivars. On day 52, ‘Seascape’, ‘Seascape+’, and ‘San Andreas’ produced more stolons than ‘Evie-2’ or ‘Evie 2+’. The cooperator was enthusiastic about removing the runners initially, but with time it became too labor intensive, so it was not carried out as frequently as at the university location. The cooperator felt that basically after day 52, it was not worth the time. However, from the data presented, it was surprising to find that the best strawberry producers (by weight), ‘Evie-2’ and ‘Evie-2+’, were also producing the fewest runners after removal at days 1 and 9. This is the opposite of what was found at the university greenhouse on day 15. However, at day 36, both cultivars were producing significantly fewer stolons than the others.
There was significant interaction between the cultivar and the day for the mean number of stolons harvested per pot. By comparing the LSMeans for the number of stolons harvested per pot for each day for each cultivar from Lincoln () with the original data from Lincoln (), it can be seen that ‘Seascape+’ plants had the fewest stolons overall and at day 15. The stolon number peaked between days 29 and 43 and then decreased. For ‘Evie-2+’, ‘Evie-2’, and ‘Seascape’ plants, there was a decrease in the number of stolons as the number of days progressed from day 15 to day 36, with a steep decline after day 36. Stolon numbers for ‘San Andreas’ plants increased slightly from day 36 to day 43 and then decreased after day 50. At the cooperator’s location, when the interaction between cultivar and day () was compared with the original data (), it can be seen that from day 1 to days 9, 9 to 18, and 18 to 32, all five cultivars significantly increased the number of stolons produced. By day 52, all cultivars had slowed stolon production.
Table 7. LSMeans for number of stolons per pot produced over a 71-day period for the five cultivars at Lincoln, Nebraska (experiment 3). Note: There were 60 plants per cultivar. has the original data. Only statistically significant interactions are presented for the interaction between each cultivar and day.
Table 8. LSMeans for number of stolons per pot produced over a 92-day period for the five cultivars at the Cooperator greenhouse, Dwight, Nebraska (experiment 4). Note: There were 240 ‘Evie-2’ plants, 253 ‘Evie-2+’ plants, 105 ‘San Andreas’ plants, and 228 ‘Seascape’ and ‘Seascape+’ plants. has the original data. Only statistically significant interactions are presented for the interaction between each cultivar and day.
Overall, given the data from the four experiments, to save labor and maximize stolon removal, it is recommended to remove stolons twice – an initial removal at about 16–18 days (week 8 of production) and then again at 32–34 days (approx. weeks 11–12).
Conclusions
When growing strawberries during the off-season/winter in temperate climates using a capillary mat production system in a double polyethylene greenhouse, it was determined that removal of flowers for three weeks resulted in low marketable yields for all of the cultivars. As a result, it is not recommended to remove flowers to try shifting production more toward December (when prices are high). It is uncertain whether under our conditions, stolons compete with flower and fruit production. However, it is recommended that stolons be removed initially at week 8 and then again at weeks 11–12 of the production cycle. Based on yield, the university research experiments conducted to grow strawberries in the off-season can be successfully extrapolated to commercial production.
Literature cited
- Adams, S.A., and E.T. Paparozzi. 2014. Constructing a block and fence growing bench for use with a capillary mat irrigation system for greenhouse plant production. Nebraska: UNL Extension Publication EC 303, p. 12.
- Arnade, C., and F. Kuchler. 2015. Measuring the impact of off-season imports. U. S. Dept. Agr. Economic Res. Serv. http://www.ers.usda.gov/publications/err-economic-research-report/err197.aspx
- Ballington, J.R., B. Poling, and K. Olive. 2008. Day-neutral strawberry production for season extension in the midsouth. HortScience. 43:1982–1986.
- Cantliffe, D.J., A.V. Paranjpe, P.J. Stoffella, E.M. Lamb, and C.A. Powell. 2007. Influence of soilless media, growing containers, and plug transplants on vegetative growth and fruit yield of ‘Sweet Charlie’ strawberry grown under protected culture. Proc. Fla. State Hort. Soc..120:142–150.
- Colquhoun, T.A., L.A. Levin, H.R. Moskowitz, V.M. Whitaker, D.G. Clark, and K.M. Folta. 2012. Framing the perfect strawberry: an exercise in consumer-assisted selection of fruit crops. J. Berry Res. 2(1):45–61.
- Darrow, G.M. 1929. Development of runners and runner plants in the strawberry. U. S. Dept. Agric. Tech. Bull. 122:27–28.
- Durner, E.F., J.A. Barden, D.G. Himelrick, and E.B. Poling. 1984. Photoperiod and temperature effects on flower and runner development in day-neutral, Junebearing, and everbearing strawberries. J. Am. Soc. Hort. Sci. 109:396–400.
- Forney, C.F., and P.J. Breen. 1985. Dry matter partitioning and assimilation in fruiting and deblossomed strawberry Fragaria-ananassa cultivar Brighton. J. Am. Soc. Hort. Sci. 110:181–185.
- Gbur, E.E., W.W. Stroup, K.S. McCarter, S. Durham, L.J. Young, M. Christman, M. West, and M. Kramer. 2012. Analysis of generalized linear mixed models in the agricultural and natural resources sciences. Agronomy Society of America, Madison, WI.
- Kadir, S., E. Carey, and S. Ennahil. 2006. Influence of high tunnel and field conditions on strawberry growth on development. HortScience. 41:329–335.
- Lambe, D., S.A. Adams, and E.T. Paparozzi. 2012. Estimating construction costs for a low-cost Quonset-style Greenhouse. Nebraska: UNL Extension Publication EC 104, p. 8.
- LeBlanc, M., Y. Desjardins, R. Bédard, and A. Gosselin. 1987. The effect of blossom removal on production characteristics of day-neutral strawberry plants grown in a northern climate. Adv. Strawberry Prod. 6:23–26.
- Leshem, Y., and D. Koller. 1965. The control of runner development in the strawberry Fragaria ananassa Duch. Ann. Bot. 29:699–708. doi:10.1093/oxfordjournals.aob.a083982
- Littell, R.C., G.A. Milliken, W.W. Stroup, R.D. Wolfinger, and O. Schabenberger. 2006. SAS for mixed models. 2nd ed. SAS Institute, Cary, NC.
- Manakasem, Y., and P.B. Goodwin. 2001. Responses of day-neutral and Junebearing strawberries to temperature and daylength. J. Hort. Sci. Biotechnol. 76:629–635.
- Mattas, K., M. Bentes, G. Paroussi, and I. Tzouramani. 1997. Assessing the economic efficiency of a soilless culture system for off-season strawberry production. HortScience. 32:1126–1129.
- Meyer, G.E., E.T. Paparozzi, E. Walter-Shea, E. Blankenship, and S.A. Adams. 2012. An investigation of reflective mulches for use over capillary mat systems for winter-time greenhouse strawberry production. http://digitialcommons.unl.edu/agronomyfacpub/677.
- Moncada, A., A. Miceli, and F. D’Anna. 2008. Evaluation of strawberry cultivars in soilless cultivation in Sicily. Acta Hort. 801:1121–1127. doi:10.17660/ActaHortic.2008.801.135
- Morgan, K. 2012. Commodity strawberry profile http://www.agmrc.org/commodities__products/fruits/strawberries/commodity-strawberry-profile/
- Paparozzi, E.T., S.A. Adams, G. Meyer, M.E. Conley, V. Schlegel, E. Blankenship, and P.E. Read. 2010. Selecting strawberry cultivars for winter greenhouse production. HortScience. 45(8):S230(Abstr.).
- Portz, D., and G. Nonnecke. 2010. Effect of removal of runners and flowers from day-neutral strawberries on time of harvest and total yields. Iowa State Univ. Hort. Res. Sta. ISRF09-36. http://www.ag.iastate.edu/farms.
- Pritts, M.P., and A. Dale. 1989. Day-neutral strawberry production guide. https://ecommons.cornell.edu/handle/1813/3275.
- Pritts, M.P., and K.A. Worden. 1988. Effects of duration of flower and runner removal on productivity of three photoperiodic types of strawberries. J. Am. Soc. Hort. Sci. 113:185–189.
- Rowley, D., B. Black, and D. Drost. 2010. Strawberry plug plant production. Logan: Utah State Univ. Coop. Ext. Publ. Hort./fruit/2010-01pr.
- Sanchez, J.H. 1999. Planting strawberries. Hort. 96:36.
- Takeda, F., and S.C. Hokanson. 2003. Strawberry fruit and plug plant production in the greenhouse. Acta Hort. 626:283–285. doi:10.17660/ActaHortic.2003.626.39
- Tehranifar, A., M. Poostchi, H. Arooei, and H. Nematti. 2007. Effects of seven substrates on qualitative and quantitative characteristics of three strawberry cultivars under soilless culture. Acta Hort. 761:485–488. doi:10.17660/ActaHortic.2007.761.67