
 ?Mathematical formulae have been encoded as MathML and are displayed in this HTML version using MathJax in order to improve their display. Uncheck the box to turn MathJax off. This feature requires Javascript. Click on a formula to zoom.
ABSTRACT
Quince (Cydonia oblonga Miller.) belongs to the Rosaceae family and is generally used for fresh consumption and processed items. In this research, fruit characteristics of eight quince genotypes from Iran were investigated via genotype by trait interactions (GTI) biplot. Results indicated that the first two principal components analysis (PC1 and PC2) were used to create a two-dimensional GTI biplot that accounted percentages of 31% and 22%, respectively, of sums of squares of the GTI. The vertex genotypes in polygon were Svs1, Esf, Nb1, Kud2 and Et1; and Svs1 was the winning genotype for pectin, fruit length, phosphorus percent and fruit hardness while Esf was the best genotype for iron percent, fruit diameter, fruit weight and end hold. There were positive correlation among pectin, fruit length, fruit hardness and phosphorus percent as well as among zinc percent, branch length, fruit apparent specific weight, calcium percent and potassium percent. Genotype Svs1 was more desirable followed by genotypes Nb4, Esf and Et1 based on ideal entry biplot and pectin and fruit length were the best traits according to ideal tester biplot. The best genotype for obtaining of high fruit weight was Esf following to Nb4, Svs1 and Nb1 and ranking traits based on fruit weight showed that fruit diameter is more important followed by end hold and iron percent. This study showed that there was relatively high level of variation in quince genotypes grown and morphological traits used in this research indicating that they can be used for characterization and diversity analysis of quince. We concluded from this study that it is imperative for breeders to pay more attention to improve quince morphological traits coordinated to fruit yield performance.
Introduction
The potential health benefits associated with a diet rich in fruits and vegetables are known and many nutritional studies recommended the regular consumption of fruits and vegetables, due to their potential in vitamins and fiber. The quince (Cydonia oblonga Miller) belongs the genus Cydonia and native to the Middle East and Central Asia and spread to the Mediterranean (Postman, Citation2009). The total quince production in the world is 678,000 tons, and Uzbekistan (130,000 tons) is the leader producer country with 20% of world production. The other important quince producer countries are Turkey (126,000 tons), China (112,000 tons), Iran (74,000 tons), Morocco (32,000 tons), Lebanon (30,000 tons), Azerbaijan (28,000 tons) and Argentina (27,000 tons) (FAOSTAT, Citation2016). These countries produce more than 80% of total quince production but the high mean yield is belonged to Switzerland (88,5 tons ha−1) followed by Uruguay (27,5 tons ha−1) and Lebanon (27,0 tons ha−1) while mean yield of quince in Iran is (11,4 tons ha−1). In the other quince producer countries, it us not grown in large amounts; typically several quince trees are grown in a mixed orchard with several other fruit trees (Shinomiya et al., Citation2009). Although the mean yield of quince in Iran is above global mean yield (7,9 tons ha−1), but it is very low in comparison with the highest yield in world (FAOSTAT, Citation2016). Due to high nutritional importance of quince, it is necessary to perform quince breeding programs for increasing the potential of yield performance which is an important goal of quince improvement program.
The quince is a deciduous tree, growing up to 5–8 m tall, 4–6 m wide and the fruits of most of quince verities are hard, sour and astringent in maturation time and therefore a few cultivars can be eaten raw. Therefore, quince fruits are mainly used to make jam and jelly due to its importance dietary source which contains antioxidant, antimicrobial and antiulcerative properties (Fattouch et al., Citation2007; Hamauzu et al., Citation2006; Silva et al., Citation2004). Quince is attracting interest due to their health promoting properties, mainly related with their antioxidant capacity, anti-allergic and because it is an important source of organic acids, sugars, and minerals like potassium, phosphorous and calcium (Legua et al., Citation2013; Rodriguez-Guisado et al., Citation2009; Wojdyło et al., Citation2013). Due to above characteristics, its extracts have been mainly used as dietary supplements and for medical treatment for infections and inflammatory diseases. Characterizations of the quince genotypes were performed based on morphological traits such as agronomical characters of fruits in Turkey (Dumanoglu and Gunes, Citation2009; Kuden et al., Citation2009).
Usually, some genotypes are tested and multiple traits recorded and it is difficult to determine the pattern of genotypic performance across traits; thus, various statistical methods have been used in the explore for an understanding of the causes of genotype by trait interactions (GTI), although strategies may differ in overall appropriateness, different tools lead to the same or similar conclusions for a given dataset. The GGE biplot methodology was developed originally for analyzing multi-environment trial data (Yan et al., Citation2000), but it can be equally used for all types of two-way data that types of two-way data which has an entry × tester layout with regarding the genotypes as entries, and the traits as testers. Yan and Rajcan (Citation2002) used a GTI biplot, which is an application of the GGE biplot method to study the GTI data. A GTI biplot is an effective tool for exploring multi-trait data because it graphically displays the genotype by trait table, and allows the visualization of the associations among traits across the genotypes and of the trait profile of the genotypes (Yan and Kang, Citation2003).
Although the morphological characterization has been one of the most widely used tools to identify genetic variability in many different fruit tree species, the use of this powerful and reliable method in Iranian quince is very rare. The objective of this study is to characterize eight quince accessions using morphological traits in order to (i) reveal the interrelationship among quince yield and other morphologic traits, (ii) compare genotypes on the basis of multiple traits, and (iii) recommend landraces for rain fed areas of the central region of Iran.
Materials and Methods
Local quince landraces were used as plant material which collected from central region of Iran and most of them were the genotypes for fresh consumption (). The trees were managed according to standard local commercial practices at Horticulture Research Station of Mobarakeh (Isfahan) at 32°20′ N and 51°30′ E geographical coordinate. They pruned annually, watered as needed using a drip irrigation system and fertilization was managed based on soil analysis. Herbicides were used for weed control and pest populations and disease were kept under control a recommended protection management program. Experimental procedures and morphological analysis of 30 fruits per genotype were collected in October 2015, the commercial harvesting season of quince in Iran. All fruit samples were assessed for measuring of fruit hardness (FH), fruit apparent specific weight (FA), pH of fruit (PH), pectin (PA), phenols (PHA), nitrogen percent (N), phosphorus percent (P), potassium percent (K), calcium percent (Ca), magnesium percent (Mg), sodium percent (Na), zinc percent (Zn), iron percent (Fe), fruit length (FL), fruit diameter (FD), end hold (EH), fruit weight (FW), fruit sweetness (FS) according to total soluble solids content, number of flower in branch (NFB) and branch length (BL).
Table 1. Name and geographical properties of collected quince landraces.
Fruit hardness (fruit flesh firmness) (FH) was measured by a penetrometer (Effigi, F.T.327) with probe diameter 11 mm. Penetration force was measured by inserting the probe in to three peeled points of each fruit and values are expressed based on kg/cm2 (Moradi et al., Citation2017). The fruit density (fruit apparent specific weight) was measured based on water displacement method using the following equitation and expressed as g cm−3 (Moradi et al., Citation2017). Fruit density is measured as M/V × 100, where M is the mass of fruit and V is the volume of fruit.
The pH of fruit juice was measured using a pH meter (Hanna Instruments, model HI 9321, USA), periodically calibrated with buffered solutions (pH 4.0 and 7.0) (AOAC, Citation1990). For determination of pectin content, 6 g of fruit sample was boiled in 100 mL of distilled water for 1 h and then the volume was made up to 250 mL and filtered through Wathman No. 4 based on Ruck (Citation1969). After that, 125 mL of water and 2.5 mL NaOH were added to 100 mL of the aliquot, and left to stand for one night. Then, 12.5 mL 1 N acetic acid and 6.5 mL of 1.0 N CaCl2 solution were added while stirring, and allowed to stand for 1 h followed by heating to boiling for 5 min and filtered through paper. The precipitates were washed with distilled water to make them free from chloride ion. Then, few drops of silver nitrate solution were added and remaining white materials were oven dried and weighted. Finally, total pectin was calculated as: pectin (%) = (Wt of Ca pectate)/(Wt of the sample) ×100.
Total phenolic contents were determined by using Folin–Ciocalteu assay as descried by Singleton and Rossi (Citation1965) and expressed as mg gallic acid equivalent per g fresh weight. Two ml of 7.5% sodium carbonate and 2.5 ml of 10% Folin–Ciocalteu reagent were mixed with 0.5 ml of fruit juice. The mixture was incubated in the dark for 40 min at room temperature. The absorbance of the mixture was measured at 765 nm by spectrophotometry.
In order to determine the mineral contents, the samples were dried in an oven at 70°C. Then 1 g of each sample was placed in furnace at 550°C for 8 h. Finally, the ash was dissolved in 100 mL 10% HCl. Nitrogen level (N) was measured according to Kjeldahl method. Phosphorus (P) was determined using the colorimetric method by acetic acid extraction as described by Cottenie et al. (Citation1982) using a spectrophotometer at wavelength 430 nm. Potassium (K) and sodium (Na) were determined by a flame photometry according to Jeffery et al. (Citation1989). The concentration of calcium (Ca) and magnesium (Mg) were measured by titration method (Thomas, Citation1982). Iron (Fe) and zinc (Zn) concentrations in the investigated fruits were measured by an atomic absorption spectrophotometer (Perkin Elmer, Analyst 400, USA) according to AOAC methods (Citation1990) and all data expressed as dry weight basis (% DW).
Fruit diameter (FD) and fruit length (FL) were measured using a Mitutoyo CD-15DC Digimatic caliper with 0.01 mm accuracy. Also, fruit weight (FW) was measured with a Sartorius digital bench scale with 0.01 g accuracy. End hold (EH) or stalk cavity was done according to U.P.O.V. guidelines (The International Union for the Protection of New Varieties of Plants) (Anonymous, Citation2003).
TSS (fruit sweet) (FS) was determined in the fruit juice obtained after squeezing the fruit by a digital refractometer (Atago Co Ltd., Tokyo, Japan) calibrated using distilled water and results were expressed as °Brix (Asadi-Gharneh et al., Citation2017).
The GTI analysis using biplot was used to determine which genotype was best and for what traits were generated using the standardized values of the traits means (Yan and Rajcan, Citation2002). The biplot analysis was based on Model 2 (i.e., dataset was not transformed (Transform = 0) within-trait standard deviation standardized (Scale = 1), and trait-centered (Centering = 2). The polygon-view was based on treatment-focused singular value partitioning (SVP = 2), while the vector views were based on the trait-focused singular value partitioning and is, therefore, appropriate for visualizing the relationships among traits and genotypes. The biplot model equation for treatment by trait interaction biplot analysis is presented as follows:
where Yij is the genetic value of the combination between genotype i and trait j; μ is the mean of all combinations involving trait j; βj is the main effect of trait j; λ1 and λ2 are the singular values for principal component PC1 and PC2; gi1 and gi2 are the PC1 and PC2 eigenvectors, respectively, for genotype i; e1j and e2j are the PC1 and PC2 eigenvectors, respectively, for trait j; djis the phenotypic standard deviation; and Σij is the residual of the model associated with the combination of genotype i and trait j. All analyses reported in this study were conducted by using the GGEbiplot software (Yan, Citation2001).
Results and Discussion
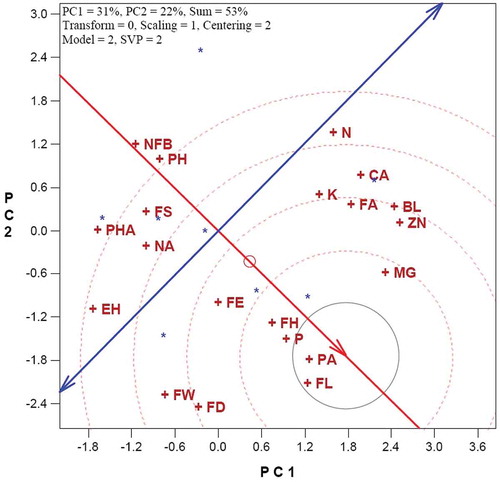
Analysis of variance showed highly significant differences among genotypes for most of measured traits (results are not shown) and then dataset was visualized graphically through GTI biplot which showed that the first two principal components (PC1 and PC2) explained 53% of total variation (31 and 22% for PC1 and PC2, respectively). In study of Pinar et al. (Citation2016), fruit characters (Fruit weight, fruit length, fruit width, fruit firmness and pH) were used for the in Turkish quince cultivars to determine genetic variation and their results indicated that observed variation may be used for conservation of genetic resources and programming future breeding studies. In order to distinguish meaningful groups of tester (traits), repeatable patterns among traits have to be demonstrated through GTI biplot analysis and the “which-won-where” view of biplot () showed the outmost genotypes (five landraces in this case) formed a four-side polygon and the biplot was divided into four sectors delimited by the lines perpendicular to each side of the polygon. The measured traits fell into all of the four sectors and for traits within a sector, the nominal “winner” is at the vertex. Thus, landrace Svs1 was the winning genotype for pectin (PA), fruit length (FL), phosphorus percent (P) and fruit hardness (FH), while landrace Esf was the best genotype for iron percent (FE), fruit diameter (FD), fruit weight (FW) and end hold (EH) (). Also, landrace Nb1 was the winning genotype for sodium percent (NA), phenols (PHA) and fruit sweet (FS), while landrace Kud2 was the best genotype for number of flower in branch (NFB) and pH of fruit (PH) (). Finally, landrace Et1 was the winning genotype in the sector containing the other traits including magnesium percent (MG), zinc percent (ZN), calcium percent (CA), branch length (BL), potassium percent (K), nitrogen percent (N) and fruit apparent specific weight (FA). There were some differences for fruit traits among reported study and our present study because of different geographical conditions and similar results were reported by Yamamoto et al. (Citation2004) and Sharma et al. (Citation2011). From , landrace Esf was the best in terms of fruit weight (FW), indicating that it can be used as parent in the development of new cultivars, hybrids and populations that are outstanding in yield performance. Also, landrace Svs1 was the best in terms of fruit hardness, landrace Nb1 was the best in terms of fruit sweet, landrace Kud2 was the best in terms of number of flower in branch and landrace Et1 was the best in terms of most mineral elements (zinc, calcium and potassium), showing that these genotypes can be used as parents in the development of new cultivars, hybrids and populations that are outstanding in these important traits.
Figure 1. Polygon view of the GTI biplot showing the best traits of quince genotypes. For trait abbreviation, refer to the text.
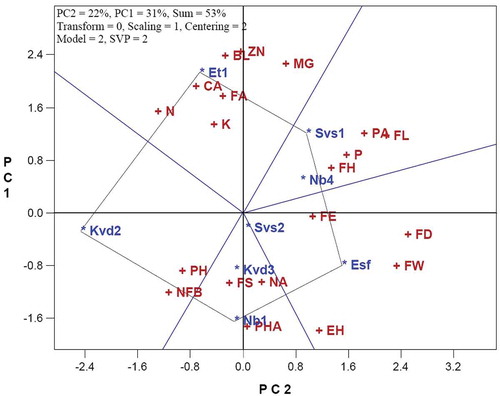
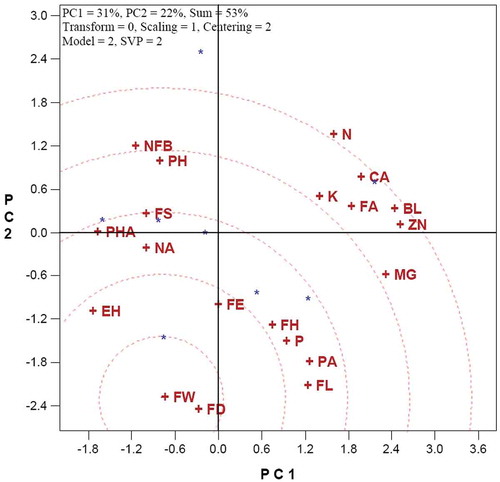
The biplot in is used for visualizing the relationships among the traits and the lines connecting the biplot origin with the markers for the traits are called trait vectors and the angle between the vectors of two traits is related to the correlation coefficient between them. The cosine of the angle between the vectors of two traits approximates the correlation coefficient between them (Yan and Rajcan, Citation2002). Based on the cosine of angles of traits vectors, there were positive correlation among PA, FL, FH and P as well as among ZN, BL, FA, CA and K (). Also, there were positive correlation among PHA, NA and FS as well as PH with NFB and between FD and FW (). There was near zero correlation between FD and FW with MG, between FD and FW with PH and NFB, between N with PA, FL, FH and P (). The presence of wide obtuse angles, i.e., strong negative correlations among the traits (between PA, FL, FH and P with PH and NFB, as well as between ZN, BL, FA, CA and K with PHA, NA and FS) is indication of strong cross-over GT interactions. The GT biplot of mean performance of coconut genotypes explained about half of the total variation of the standardized data. Thus, some of the mentioned results can be verified using original correlation coefficients (), but some of these cannot be verified, because the biplot accounted for <100% of the total variation. This relatively moderate percentage variation reflects the relative accuracy of associations among the measured traits and the fundamental patterns among the traits should be captured by the biplot procedure (Yan and Kang, Citation2003). These relationships suggest that it is possible to combine higher fruit weight (FW), higher fruit diameter (FD) and iron percent (FE), in a single genotype followed by higher fruit hardness (FH), higher phosphorus percent (P), higher pectin content (PA) and longer fruit length (FL).
Figure 2. Vector view of the GTI biplot showing the interrelationships among traits of quince genotypes. For trait abbreviation, refer to the text.
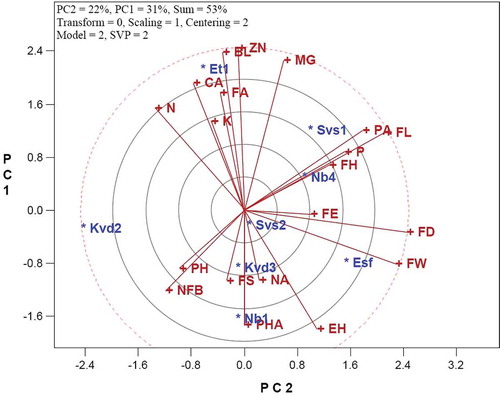
Table 2. Pearson’s correlation coefficients of measured traits of quince genotypes.
An ideal genotype should have high mean performance across all measured traits. defines an ideal genotype (the center of the concentric circles) in the positive direction and has a vector length equal to the longest vectors of the genotypes on the positive side of the highest performance. Therefore, genotypes located closer to the ideal genotype are more desirable than others; thus, genotype Svs1 was more desirable followed by genotypes Nb4, Esf and Et1 while genotypes Nb1, Kvd3 and Svs2 were the most unfavorable and genotype Kvd2 was, of course, the poorest genotype because it was consistently the poorest (). Sanchez et al. (Citation1988) studied 11 quince genotypes by isozyme patterns which were considered to represent genetic characteristics suitable for identification purposes but the diversity of isozyme patterns was much less than other markers while in the present study using morphologic traits and biplot method could detect the best genotype. The biplot in is used for visualizing the relationships among the genotypes and the lines connecting the biplot origin with the markers for the genotypes are called genotype vectors. Similar to , the angle between the vectors of two genotypes is related to the correlation coefficient between them. Based on the cosine of angles of genotypes vectors, there were relatively a weak positive correlation between Nb4 and Svs1 as well as between Nb4 and Svs1 (). Also, there were positive correlation among PHA, NA and FS as well as PH with NFB and between FD and FW (). There was near zero correlation between Et1 with Kvd2, between Et1 with Nb4, between Svs1 with Esf, and between Esf with Nb1 (). The presence of wide obtuse angles (negative correlations) between Nb1 and Kvd3 with Et1, as well as between Kvd2 with Nb4, is indication of GT interactions (Yan and Tinker, Citation2005). These results indicated that the studied genotype were completely different and did not show large magnitude of associations.
Figure 3. Ideal entry (genotype) view of the GTI biplot showing the best genotype based on measured traits of quince genotypes. For trait abbreviation, refer to the text.
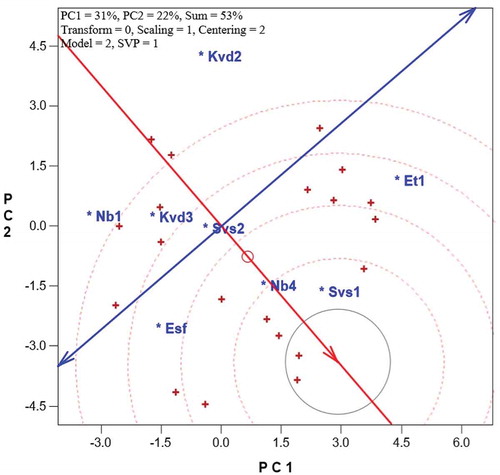
Figure 4. Vector view of the GTI biplot showing the interrelationships among entries (genotypes) of quince genotypes. For trait abbreviation, refer to the text.
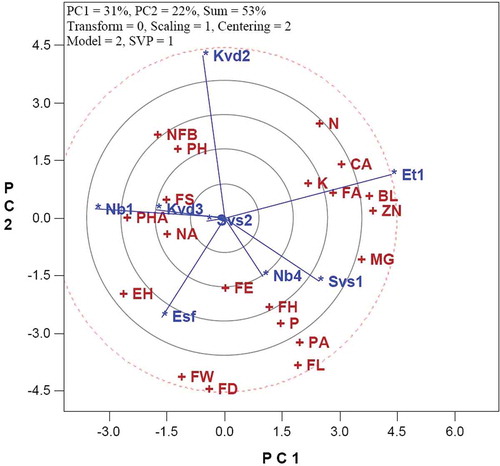
The ideal tester of trait should be most informative and also most representative of the target trait and it defines an ideal tester, which is the center of the concentric circles. It is a point on the average-trait axis, in the positive direction (most representative) with a distance to the biplot origin equal to the longest vector of all traits (most informative). The pectin (PA) and fruit length (FL) are closest to this point and is, therefore, best, whereas pH of fruit (PH), phenols (PHA) and number of flower in branch (NFB) were poorest for selecting traits (). Following to above-mentioned ideal traits, FH, MG and P and then FD, FE, ZN, BL and FA were closest to ideal point; however, note that additional experiments are required to confirm that a specific trait is ideal (). Therefore, in quince, pectin content and fruit length are the major traits for discriminating differences among local landraces and genotypes. According to Sykes (Citation1972), such genetic collection will also provide the opportunity to evaluate the genotypes for disease resistance, yielding performance and fruit quality. Thus, the most favorable genotypes will be selected and distributed for future breeding program.
Figure 5. Ideal tester (trait) view of the GTI biplot showing the best trait of quince genotypes. For trait abbreviation, refer to the text.
The best genotype for obtaining of high fruit weight (FW) could be found in the special vector-view of GTI biplot () which shows genotypes that have close association with a target trait among other traits. According to this biplot (), Esf following to Nb4 > Svs1 > Nb1 > Kvd3 > Svs2 were the best genotypes suitable for obtaining of high performance of fruit weight. Thus, cultivation and using these genotypes are expected to lead to improve the target trait under rainfed growing conditions in semi-arid region. In contrast, genotypes Kvd2 and Et1 indicated performance of fruit weight below average and were not good in terms of yield potential (). As depicted in , when we rank traits based on fruit weight (FW), traits which are closer to FW are more desirable than others for obtaining of high fruit weight and thus, fruit diameter (FD) is more important followed by end hold (EH) and iron percent (FE) (). Accordingly, traits fruit hardness (FH), phosphorus per cent (P), fruit length (FL), sodium percent (NA), phenols (PHA), fruit sweet (FS) and pectin (PA) were related to fruit weight and could be used for definition of selection indices for genetic improvement of quince fruit yield performance.
Figure 6. Ranking of quince genotypes based on fruit weight (FW). For trait abbreviation, refer to the text.
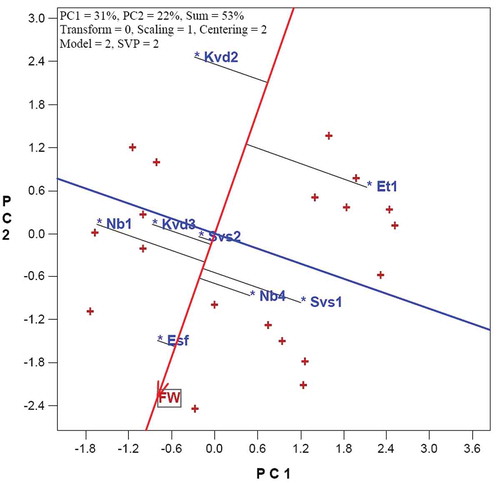
Figure 7. Ranking of traits based on fruit weight (FW) for quince genotypes. For trait abbreviation, refer to the text.
The information on GTI is of paramount importance for producers and it is clear that it is an excellent visual tool. It has some advantages including graphical presentation, more interpretative, facilitating identification of groups, etc. (Yan and Tinker, Citation2005) as compared with conventional methods. A potential constraint of the biplot method is that it may fail to explain most of the variation and therefore fail to display all patterns of the data and this is most likely to occur with large datasets, small main effects and complex interactions. Even when this is the case, it can be ensured that the biplot of PC1 versus PC2 still displays the most important linear patterns of the data (Yan and Kang, Citation2003) and the pattern is estimated by the total variation of the tester-centered data minus the noise, which is estimated by the total degrees of freedom, multiplied by the error mean square and can be estimated from replicated data. Our study results indicate that fruit diameter plays a significant role on increasing of quince yield, and genotype Esf produced high fruit yield while genotype Svs1 was the best genotype regarding all of the measured traits. The quince, one of the oldest known fruit to mankind and its high demand, harvest and storage facilities, quince production areas has increased and developing quince varieties for different targets has also been increased. In this context, selection and hybridization breeding methods are using for development new varieties and quality of the fruit yield and resistance to diseases is important properties for breeding focus (Sahin and Misirli, Citation2016).
Conclusions
The GTI biplot could aid to visualize the association among genotypes, traits and their interaction and so it is an efficient statistical tool for interpreting dataset. Landrace Svs1 was the winning genotype for pectin, fruit length, phosphorus percent and fruit hardness of quince while landrace Esf was the best genotype for iron percent, fruit diameter, fruit weight and end hold. The best genotype for obtaining of high fruit weight was Esf following to Nb4 and Svs1 and ranking traits based on fruit weight indicated that fruit diameter followed by end hold and iron percent were the most related traits to quince fruit weight.
Acknowledgments
We wish to thank Professor Dr. Weikai Yan (Eastern Cereal Oilseed Research Center of Agriculture and Agri-Food Canada) for making available a time-limited version of GGEbiplot software as “Test Biplotxlsx.”
References
- Anonymous 2003. Guidelines for the conduct of tests for distinctness, uniformity and stability of quince (Cydonia Mill. sensu stricto). International Union for the Protection of New Varieties of Plants, Geneva, Switzerland. 25.
- AOAC. 1990. Official methods of analysis. 15th ed. Association of Official Analytical Chemists, Washington D.C.
- Asadi-Gharneh, H.A., M. Mohammadzamani, and S. Karimi. 2017. Evaluation of physico-chemical properties and bioactive compounds of some Iranian pomegranate cultivars. Int. J. Fruit Sci. 17(2):175–187. doi: 10.1080/15538362.2016.1275923.
- Cottenie, A., M. Verloo, G. Velghe, and R. Camerlynch. 1982. Chemical analysis of plants and soil. Laboratory of analytical and chemistry. State of Univ, Gent, Belgium.
- Dumanoglu, H., and N.T. Gunes. 2009. Analysis of clonal variations in cultivated quince (Cydonia oblonga ‘Kalecik’) based on fruit characteristics and SSR markers. N. Z. J. Crop Hortic. Sci. 37:113–120.
- FAOSTAT 2016. FAOSTAT. Food and agricultural organization of the United Nations. Available at: http://faostat.fao.org.
- Fattouch, S., P. Caboni, V. Coroneo, C.I.G. Tuberoso, A. Angioni, S. Dessi, N. Marzouki, and P. Cabras. 2007. Antimicrobial activity of tunisian quince (Cydonia oblonga Miller) pulp and peel polyphenolic extracts. J. Agric. Food Chem. 55:963–969. doi: 10.1021/jf062614e.
- Hamauzu, Y., T. Inno, C. Kume, M. Irie, and K. Hiramatsu. 2006. Antioxidant and antiulcerative properties of phenolics from Chinese quince, quince, and apple fruits. J. Agric. Food Chem. 54:765–772. doi: 10.1021/jf052236y.
- Jeffery, G.H., J. Basset, J. Mendham, and R.C. Dennery. 1989. VOGELS Textbook of quantitative chemical analysis. 5th. Longman Scientific and Technical Publisher, London. p. 1989.
- Kuden, A., M.A. Tumer, M.K. Gungor, and B. Imrak. 2009. Pomological traits of some selected quince types. Acta Hortic. 818:73–76. doi: 10.17660/ActaHortic.2009.818.9.
- Legua, P., M. Serrano, P.M. Valero, D. Martínez, J.J. Martínez, and R.F. Hernández. 2013. Quality parameters, biocompounds and antioxidant activity in fruits of nine quince (Cydonia oblonga Miller) accessions. Sci. Hortic. 154:61–65. doi: 10.1016/j.scienta.2013.02.017.
- Moradi, S., M. Koushesh Saba, A.A. Mozafari, and H. Abdollahi. 2017. Physical and biochemical changes of some Iranian quince (Cydonia oblonga Mill) genotypes during cold storage. J. Agric. Sci. Technol. 19:377–388.
- Pinar, H., S. Kaymak, S. Ozongun, U.Z.U.N. Aydin, U.N.L.U. Mustafa, M. Bircan, S. Ercisli, and E. Orhan. 2016. Morphological and molecular characterization of major quince cultivars from Turkey. Notulae Botanicae Horti Agrobotanici Cluj-Napoca 44(1):72–81. doi: 10.15835/nbha44110228.
- Postman, J. 2009. Cydonia oblonga: The unappreciated quince. Arnoldia 67:2–9.
- Rodriguez-Guisado, I., F. Hernández, P. Melgarejo, P. Legua, R. Martínez, and J.J. Martínez. 2009. Chemical, morphological and organoleptical characterisation of five Spanish quince tree clones (Cydonia oblonga Miller). Sci. Hortic. 122:491–496. doi: 10.1016/j.scienta.2009.06.004.
- Ruck, J.A. 1969. Chemical method of analysis of fruit and vegetable products. Research Station, Summerland BC. p. 14–16.
- Sahin, M., and A. Misirli. 2016. Ülkemizde ve dünyada ayva islahı çalışmaları. Nevşehir Bilim Ve Teknoloji Dergisi 5:286–294. doi:10.17100/nevbiltek.211008.
- Sanchez, E.E., R.A. Menendez, L.S. Daley, R.B. Boone, O.L. Jahn, and P.B. Lombard. 1988. Characterization of quince (Cydonia) cultivars using polyacrylamide gel electrophoresis. J. Environ. Hortic. 6:53–59.
- Sharma, R., V.K. Joshi, and J.C. Rana. 2011. Nutritional composition and processed products of quince (Cydonia oblonga Mill.). Indian J. Nat. Prod. Resour. 2:354–357.
- Shinomiya, F., Y. Hamauzu, and T. Kawahara. 2009. Anti-allergic effect of a hot extract of quince (Cydonia oblonga). Biosci. Biotechnol. Biochem. 73:1773–1778. doi: 10.1271/bbb.90130.
- Silva, B.M., P.B. Andrade, P. Valentão, F. Ferreres, R.M. Seabra, and M.A. Ferreira. 2004. quince (Cydonia oblonga Miller) fruit (pulp, peel, and seed) and jam: Antioxidant activity. J. Agric. Food Chem. 52:4405–4712.
- Singleton, V.L., and J.L. Rossi. 1965. Colorimetry of total phenolics with phosphomolybdic– Phosphotungstic acid reagents. Am. J. Enol. Vitic. 16:144–158.
- Sykes, J.T. 1972. A description of some quince cultivars from western Turkey. Econ Bot 26:21–31. doi: 10.1007/BF02862258.
- Thomas, G.W. 1982. Exchangeable Cations. Methods of Soil Analysis, Part 2, Chemical and Microbiological Properties. Second Edition. A.L. Page (editor). Agronomy, No. 9, Part 2, American Society of Agronomy, Soil Science Society of America, Madison, Wl: 159-165.
- Wojdyło, A., J. Oszmianski, and P. Bielicki. 2013. Polyphenolic composition, antioxidant activity, and polyphenol oxidase (PPO) activity of quince (Cydonia oblonga Miller) varieties. J. Agric. Food Chem. 61:2762–2772. doi: 10.1021/jf304969b.
- Yamamoto, T., T. Kimura, J. Soejima, T. Sanada, Y. Ban, and T. Hayashi. 2004. Identification of quince varieties using SSR markers developed from pear and apple. Breed Sci. 54:239–244. doi: 10.1270/jsbbs.54.239.
- Yan, W., and I. Rajcan. 2002. Biplot analysis of test sites and trait relations of soybean in Ontario. Crop Sci. 42:11–20. doi: 10.2135/cropsci2002.1100.
- Yan, W., L.A. Hunt, Q.L. Sheng, and Z. Szlavnics. 2000. Cultivar evaluation and mega-environment investigation based on GGE biplot. Crop Sci. 40:596–605. doi: 10.2135/cropsci2000.403597x.
- Yan, W., and M.S. Kang. 2003. GGE biplot analysis: A graphical tool for breeders, geneticists, and agronomists. CRC Press, Boca Raton, FL.
- Yan, W.K. 2001. GGE biplot: A windows application for graphical analysis of multienvironment trial data and other types of two-way data. Agron. J. 93:1111–1118. doi: 10.2134/agronj2001.9351111x.
- Yan, W.K., and N.A. Tinker. 2005. An integrated biplot analysis system for displaying, interpreting, and exploring genotype environment interaction. Crop Sci. 45:1004–1016. doi: 10.2135/cropsci2004.0076.