
 ?Mathematical formulae have been encoded as MathML and are displayed in this HTML version using MathJax in order to improve their display. Uncheck the box to turn MathJax off. This feature requires Javascript. Click on a formula to zoom.
ABSTRACT
This research was aimed to develop natural red colorant powder from Hibiscus sabdariffa L. fruit using foam mat drying. Egg albumen (EA) at different concentrations (5–20% w/w) was used as a foaming agent, and samples were whipped for 10 minutes. The samples were hot air dried at 50°C for 6 hours. Effect of EA concentration on the foam properties and physicochemical properties of the powders were analyzed. In addition, the effect of temperatures (10–80°C) on color and rehydration characteristics of rehydrated powders were studied. The result showed that 15% EA concentration of foam mat dried H. sabdariffa L. powder has good quality characteristics.
Introduction
Hibiscus sabdariffa Linn., also known as roselle, is an edible flower which belongs to the family of Malvaceae. H. sabdariffa L. has been widely used in India and Indonesia for ages (Wong et al., Citation2002), and research on H. sabdariffa L. is still ongoing due to its high nutritional values (El Hakim, Citation2010). Desserts such as jelly, pudding, cake, and ice cream, and beverages such as wine, syrup, and juice can be produced by using H. sabdariffa L. calyces (Hussein et al., Citation2010). H. sabdariffa L. produces red edible calyces with special glorious red color due to the presence of anthocyanins which can be used as natural colorant for food (Shruthi et al., Citation2016).
Fresh H. sabdariffa Linn. easily gets withering, and therefore, it is not suitable to export in fresh over a long distance and period. In order to overcome this problem, drying is used to reduce microbial activity and product deterioration to extend its product shelf life (Hardy and Jideani, Citation2015). Moreover, dried product can minimize packaging material and is easier to handle during storage and transportation (Sagar and Kumar, Citation2010). There are researches on drying of H. sabdariffa L. using solar drying (Hahn et al., Citation2011), freeze drying (Duangmal et al., Citation2008), and spray drying (Gonzalez-Palomares et al., Citation2009). However, there is very little information on foam mat dried H. sabdariffa L. Foam mat drying is a drying process which is suitable for semi-liquid or liquid raw material to convert into dry powder form. The liquid raw material is added with a foaming agent and/or a small amount of stabilizers (Sangamithra et al., Citation2015b). The mixture is whipped until the stiff foam is formed and undergone air drying at temperature ranging from 50°C to 80°C (Kandasamy et al., Citation2012) and dried until reach desired moisture content.
Many studies have reported on foam mat drying of fruits and vegetables such as tomato (Kadam and Balasubramanian, Citation2011) and yacon (Franco et al., Citation2016) to form a free-flowing powder. Hardy and Jideani (Citation2015) studied that foam mat drying method is cheaper, convenient, and less quality degradation compared to the other drying methods such as ordinary hot air drying, spray drying, and drum drying. The objectives of this study are (1) to evaluate the effect of foaming agent concentration on the foam properties and physicochemical properties of foam mat dried H. sabdariffa L. powder and (2) to determine the effect of temperature on the rehydration characteristics and color of the rehydrated foam mat dried H. sabdariffa L. powder.
Materials and Methods
Preparation of H. sabdariffa Linn. Paste and Foam
H. sabdariffa L. was washed with potable water. H. sabdariffa L. calyces were blended using a blender (Panasonic, MK-5087 M, Food Processor, Malaysia) for 10 min to form a smooth paste. Egg albumen (EA) and egg yolk were separated. About 500 g of H. sabdariffa L. pastes was mixed with EA at concentration levels of 5%, 10%, 15%, and 20% (w/w). EA was pre-whipped for 2 min before adding into the paste. Based on the preliminary studies, pre-whipped egg albumen (EA) for 2 min can produce more foam compared to non-pre-whipped. The mixture of EA and paste was whipped using a handheld mixer (Moulinex, type 765, France) at the maximum speed for 10 min. Based on the preliminary studies, the pastes were whipped at different whipping time for 5–20 min. Whipping at 10 min can produce more foam and stiffer foam.
The foam was extruded onto trays covered with plastic bag and placed in cabinet dryer (Hanaki Manufacturing Co., Ltd., SMA-112, Japan) at 50°C for 6 h to reach a final moisture content of 5–7%. The dried foam was scrapped after cooling the trays to room temperature, and the product was ground using premier mixer grinder (Sivanesan Company, g KM 501, India) for 1 min. The H. sabdariffa L. powders were packed immediately in high-density polyethylene bags and sealed to prevent diffusion of moist air and caking.
The Analysis of Foam Properties
Foam Density
A 100 ml transparent beaker of known weight was filled with 50 ml of H. sabdariffa L. foams, and the weight of foam was taken. The density of foamed H. sabdariffa L. pulp was determined in terms of mass-to-volume ratio using Equation (1).
Foam Expansion
During the foaming experiments, 500 g of H. sabdariffa L. pulps was used. In foam expansion, 20 g of H. sabdariffa L. pulps was taken in a graduated cylinder to measure the volume (V0). After foaming, the volume of 20 g of H. sabdariffa L. foamed pulps was measured. Foam expansion was calculated according to Rajkumar et al. (Citation2007) as shown in Equation (2).
where
V0 = Initial volume of H. sabdariffa L. pulp, cm3
V1 = Final volume of foamed H. sabdariffa L. slurry, cm3
Foam Stability
Method for measurement of foam stability was modified from Prommajak and Ravivan (Citation2013). About 20 ml of the foamed pulp was inserted into 30 ml measuring cup and kept at room temperature for 3 h. The foam stability in terms of volume reduction was calculated as shown in Equation (3).
Analysis of Foam Mat Dried Powder
Preparation of Rehydrated Juice
About 1 g of foam mat dried H. sabdariffa L. powder was dissolved in 11 g of water.
pH
The pH was measured using pH meter (Jenway 3505 pH, UK.) for the fresh juice and rehydrated H. sabdariffa L. juice at 24.5 ± 0.5°C.
Total Soluble Solid
TSS of rehydrated H. sabdariffa L. juice were measured using refractometer (Atago co., Ltd., Japan). A drop of the samples was placed on refractometer prism to measure TSS in o Brix at 24.5 ± 0.5°C. The refractometer prism was cleaned with distilled water after each analysis.
Water Activity
The water activity of the foam mat dried H. sabdariffa L. powder was determined using water activity analyzer at 24.5 ± 0.5°C. (Aqua Lab, model TE, Decagon Devices, Inc., USA).
Moisture Content
The moisture content was determined according to the moisture measurement method of AOAC (Citation2015) where the samples were dried for 24 h at 105 ± 1°C.
Color Analysis
Color values of foam mat dried H. sabdariffa L. powder were determined using a method described by Falade et al. (Citation2003) with slight modification. The color values of fresh H. sabdariffa L. powder and reconstituted juice at temperatures 10°C, 25°C, 40°C, 65°C, and 80°C were measured using a hand-held Chroma Meter (Konica Minolta, CR-410, Japan.) in terms of L*, a*, and b* values. The chroma and hue angle values of H. sabdariffa L. samples were calculated using Equations (4) and (5), respectively (Kha et al., Citation2011).
Particle Size Analysis
The particle size of foam mat dried H. sabdariffa L. powder was measured using a Mastersizer Scirocco 2000 particle size analyzer (Malvern Instrument Ltd., Malvern, UK) with a dry dispersion method. About 1 g of the foam mat dried H. sabdariffa L. powders was used to determine the mean particle diameter of each powder (Amidon et al., Citation2009). Experiments were conducted at 1.0 bars of dispersion pressure, and the particle sizes were reported in terms of d[0,1], d[0,5], and d[0,9] (Ghoroi et al., Citation2012). The polydispersity of the particles was expressed by the span, where span = [d[0,9] − d[0,1],]/d[0,5], d[0,1], d[0,5], and d[0,9] are the equivalent volumes diameters at 10%, 50%, and 90% cumulative volume, respectively.
Rehydration Ratio
Rehydration ratio (RR) was modified from Kadam and Balasubramanian (Citation2011). About 1 g of foam mat dried H. sabdariffa L. powder was dissolved in 11 g of water at different temperatures (10°C, 25°C, 40°C, 60°C, and 80°C) and stirred for 15 min to get rehydrated H. sabdariffa L. filtrate. RR is calculated as in Equation (6).
where,mrh = mass of rehydrated sample (g)mdh = mass of dehydrated sample (g)
Coefficient of Rehydration
Coefficient of rehydration (COR) is a measure of degree of return to the original state is calculated using Equation (7) (Ramallo and Mascheroni, Citation2012).
where
X0 = Moisture content (% wet basis: g water per 100 g of matter) of fresh fruit, prior to drying
Xdh = Moisture content (% wet basis) of sample after drying
Statistical Analysis
All the tests were performed in triplicate. Mean scores and standard deviations of the results were reported. The results were analyzed using Minitab Statistical Software (Minitab Inc., Release 15, Pennsylvania). Tukey’s range test was used to determine the significant differences of the mean values at 95% significance level (p < 0.05).
Results and Discussion
Effect of EA on Foam Properties
Foam Density
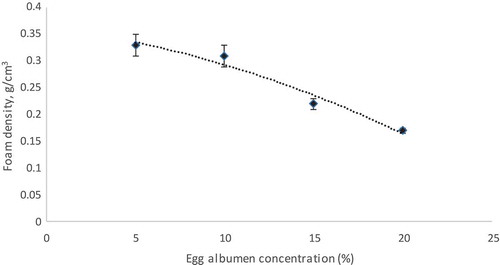
The foam density is usually used to evaluate the whipping properties. The high the amount of air incorporated during whipping, the foam density will be lower and whipping ability will be higher (Falade et al., Citation2003). The density of the foam reduced with an increase in EA concentration (). This finding is in agreement with Sangamithra et al. (Citation2015a) for muskmelon. From , the trend line for foam density (y = −0.0114x + 0.4) had a high coefficient of determination (R2 = 0.95) which meant its foam density could be explained well by a linear function. A decrease in foam density due to the presence of high concentration of EA reduces the interfacial tension and surface tension of the liquid, forming an interfacial film (Kudra and Ratti, Citation2006). Low foam density can increase the rate of movement of water removal during drying as it gives a larger surface area to drying (Hardy and Jideani, Citation2015). Based on the literature, a low value of foam density indicated a high amount of air trapped in the pulp, and thus, lower foam density also exhibited higher foam expansion (Asokapandian et al., Citation2016).
Figure 1. Foam density of Hibiscus sabdariffa L. pulp for different EA concentrations (5–20%).
Foam Expansion
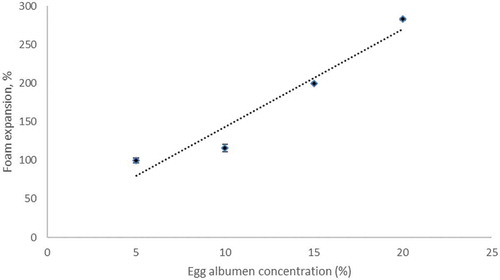
An increase in EA concentration resulted in higher foam volume and foam expansion as shown in . Percentages of foam expansion of H. sabdariffa L. at 5%, 10%, 15%, and 20% EA concentrations were found 100%, 116%, 200%, and 283%, respectively. Affandi et al. (Citation2017) reported that the foam expansion of Nigella sativa pulp increased ranging from 45% to 328% when the EA concentration increased ranging from 2.50% to 15.00%. The increased foam expansion gave lower foam density. Similar results reported by Krasaekoopt and Bhatia (Citation2012) for plain yogurt powder and Abbasi and Azizpour (Citation2016) for sour cherry concentrate. However, the result was in contrast with the result reported by Kandasamy et al. (Citation2012) for papaya powder, where the maximum foam expansion was 15% (w/w) of EA while further increased in EA concentration did not produce significant changes in foam density and foam expansion. From , the trend line for foam expansion (y = 12.66x + 16.5) had a high coefficient of determination (R2 = 0.93) which meant its foam expansion could be explained well by linear equation. High concentration of EA caused an increase in the foam expansion due to the presence of protein in EA. At the time of whipping, the proteins denatured at the interphase and interacted with one another to form a stable interfacial film (Thuwapanichayanan et al., Citation2012).
Figure 2. Foam expansion of Hibiscus sabdariffa L. pulp for different EA concentrations (5–20%).
Foam Stability
shows the foam stability at different concentrations of EA for H. sabdariffa L. observed for 3 h. The most stable form was H. sabdariffa L. pulp with 15% of EA concentration. However, the foam stability at 20% of EA concentration was the least stable (). This may be due to the overexpanded foam (foam expansion of 283%) in 20% of EA concentration. The foam which is overexpanded has a higher concentration of smaller bubbles and thus of lower foam density may collapse easily (Lomakina and Mikova, Citation2006; Ranjani and Ramamurthy, Citation2010). The foam formation at 20% of EA concentration of H. sabdariffa L. pulp was not as stable as 15% of EA concentration of H. sabdariffa L. pulp (), and this led to higher water activity in 20% of EA concentration of H. sabdariffa L. powder () because the drying process was not effective. A stable structure of the foam is required for quick drying and easy for the removal of the dried material from the trays. If the foam structure is destroyed, the time taken for drying the product becomes longer, and the quality of the final product is decreased (Bag et al., Citation2011).
Figure 3. Foam stability of Hibiscus sabdariffa L. pulp for different EA concentrations: ![]()
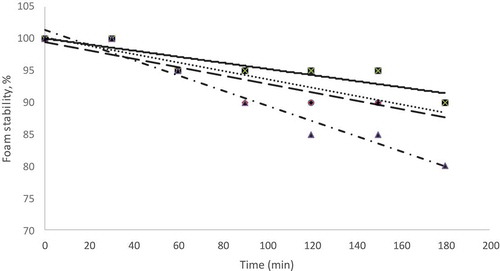
Figure 4. Rehydration ratio of foam mat dried Hibiscus sabdariffa L. powder at different temperatures (10–80°C): ![]()
Table 1. Physicochemical composition of fresh, non-foamed, and foam mat dried Hibiscus sabdariffa L. powder.
As shown in , the trend line for EA 20% (y = −0.1190x + 101.43) had a high coefficient of determination (R2 = 0.96) which meant its foam stability could be explained well by linear function. Trend line of foam stability from 0 to 180 min for other samples: sample with EA 5% (y = −0.0655x + 100.18, R2 = 0.89), EA 10% (y = −0.0655x + 99.46, R2 = 0.80), and EA 15% (y = −0.0476x + 100.00, R2 = 0.80) – also showed a linear fit.
Effect of EA on Physicochemical Properties of Powder
pH
The pH of fresh H. sabdariffa L. juice in this study was 2.12, while the pH value of fresh H. sabdariffa L. fruit which reported by Wong et al. (Citation2002) was 2.49. The value difference may be due to the different varieties of H. sabdariffa L. that were used in the studies. To study the effect of foaming agents on the pH of juice made from foam mat dried powder, the pH of reconstituted H. sabdariffa L. powder was determined. The pH of juice from rehydrated foam mat dried powder was found to be in the range of 2.08–2.38. It is well known that H. sabdariffa L. is characterized by its sour taste because it contains organic acids such as oxalic, citric, succinic, and ascorbic acids (Wong et al., Citation2002). Low pH was favorable from safety point of view as low pH of the powder prevented from the microbial infestation in the samples (Kadam et al., Citation2010).
As the EA concentration increases from 0 to 20%, the pH of the foam mat dried H. sabdariffa L. powder increased significantly (p < 0.05) as shown in . Due to high pH value in EA which is about 9, the addition of EA led to a rise in the pH of the reconstituted powder. Similar results reported by Abbasi and Azizpour (Citation2016) where an addition of EA causes an increase in the pH of the sour cherry powder.
Total Soluble Solid
TSS of fresh H. sabdariffa L. juice in this study was about 4.55°Brix which is slightly higher than that reported by Wong et al. (Citation2002) where the TSS of fresh H. sabdariffa L. is about 3.30°Brix. The differences in TSS values could be due to the variety of H. sabdariffa L. that was used in the studies. To study the effect of foaming agents on the TSS value of juice made from foam mat dried powder, the TSS value of reconstituted H. sabdariffa L. powder was determined. The TSS of juice from reconstituted foam mat dried H. sabdariffa L. powder with 10% of EA concentration did not differ significantly from fresh H. sabdariffa L. juice (). The addition of EA in foam mat dried sample from 10% to 15% of EA concentration causes the increase of TSS to 12.8°Brix, which is in agreement with Sujata (Citation2014) where the addition of EA increased the TSS of foam mat dried H. sabdariffa L.
Water Activity
Water activity is one of the important quality factors especially for the stability of food. Water activity is closely linked with moisture content and responsible for biochemical reactions (Quek et al., Citation2007). The water activity of fresh and foam mat dried H. sabdariffa L. is shown in . Water activity of foam mat dried H. sabdariffa L. powder was in the range of 0.40–0.45 which is good enough to ensure safe storage condition as microbial activities are inhibited below aw 0.6, most fungi below 0.7, most yeasts below 0.8, and most bacteria below 0.9 (Fellow, Citation2016; Karim and Law, Citation2017). A similar result was reported by Kaushal et al. (Citation2013) that the water activity of foam mat dried seabuckthorn berries fruit bar was at 0.46.
Moisture Content
The moisture content of fresh and foam mat dried H. sabdariffa L. is presented in . The moisture content of fresh H. sabdariffa L. was 91.6% (w.b). The moisture content of foam mat dried H. sabdariffa L. decreased significantly when EA concentration increased. The results obtained were generally in agreement with the literature studies on foam mat dried Brazilian cherry (Chaves et al., Citation2013) and tomato (Kadam and Balasubramanian, Citation2011). The trend of moisture content that decreased with increasing EA concentration is related to the foam properties. Higher EA concentration produces lower foam density and higher foam expansion which allowed more air incorporated in the pulp; thus, the heat can be transferred more efficiently and the heat penetration is faster that led to lower moisture content (Thuwapanichayanan et al., Citation2008).
Color
Color is one of the major quality characteristics of dried food products, including powders. The results related to the effect of EA concentration on the color parameter of the powders are presented in . As EA concentration increased, values of L* and a* increased significantly, while b* had no significant difference. Increase in L* value was due to the addition of EA which was white in color and the presence of air in the product. This result is in agreement with Sangamithra et al. (Citation2015a) for muskmelon fruit. However, the color parameter of L*, a*, and b* values of spray-dried H. sabdariffa L. powder and freeze-dried H. sabdariffa L. powder were 39.3, 43.1, and −0.8, and 29.7, 72.9, and 47.7, respectively (Idham et al., Citation2012), which were higher compared to foam mat dried H. sabdariffa L. powder in this study.
Table 2. Effect of egg albumen concentration on the color properties of fresh, non-foamed, and foam mat dried Hibiscus sabdariffa L. powder.
The general appearance of any food product is a combination of its chromatic attributes (color) and its geometric attributes. Chromatic attributes are associated with color and represented as lightness (L), hue, and chroma. Hue is generally used as an analytical tool to interpret the color. The hue angle values change from 0° (pure red color), 90° (pure yellow color), 180° (pure green color) to 270° (pure blue color) (Ramallo and Mascheroni, Citation2012). All measurements on the hue values of fresh and foam mat dried H. sabdariffa L. powder were in the range of 6.3–10.1° indicating that the red color of H. sabdariffa L. Chroma can be known as the purity of color. A larger chroma value represents a more pure and intense color (Ramallo and Mascheroni, Citation2012). The chroma of foam mat dried H. sabdariffa L. powders ranged from 25.099 to 33.502. Chroma was increased significantly from fresh H. sabdariffa L. to 15% of EA concentration of foam mat dried H. sabdariffa L. powder.
Particle Size
The particle size distributions for foam mat dried H. sabdariffa L. powder are presented in . Particle size plays a vital role in food processing as it can directly influence the quality of the final product. In addition, the particle size can affect the powder flowability and separation (Fitzpatrick et al., Citation2007). The values of 10%, 50%, and 90% of the H. sabdariffa L. powder particle size are shown in , in which the particle size of H. sabdariffa L. powder at 0% of EA concentration was the largest among the other concentration levels of EA of H. sabdariffa L. powder, while H. sabdariffa L. powder at 20% of EA concentration showed the finest powder. This may be due to foam properties of the sample, as EA concentration decreased, foam expansion decreased, foam density increased, and foam stability decreased, and thus, the moisture content of the powder increased (Dehghannya et al., Citation2018). This result may cause the powder became more cohesive, less brittleness and tend to form an agglomerate; thus, the particle size of the powder increased (Moon and Yoon, Citation2017; Sandler et al., Citation2010). Generally, the particle size of powder that larger than 200 µm are considered free flowing (Benkovic and Bauman, Citation2009). Meanwhile, there was only 10% of foam mat dried H. sabdariffa L. powder at 0 and 5% of EA concentration had a particle size larger than 200 µm.
Table 3. Particle size of non-foamed and foam mat dried Hibiscus sabdariffa L. powder.
Moreover, the measurement of the width of the particle size distribution is the amount of span. The span values of H. sabdariffa L. powder at 0%, 5%, 10%, 15%, and 20% of EA concentration were 1.854, 2.267, 4.397, 5.421, and 5.119. The span value of 0% of EA concentration of H. sabdariffa L. powder was the smallest. As a result, 0% EA concentration of H. sabdariffa L. powder had a narrower particle size distribution compared to the other EA concentration of foam mat dried H. sabdariffa L. powder due to the smaller value of the span. Similar results had been reported in pineapple fruit (Mokhtar et al., Citation2015).
Effect of Temperature on Rehydration Characteristics and Color
Rehydration Characteristics
Rehydration process depends on structural changes in vegetal tissues and cells of the food product during drying, in which shrinkage is produced while water absorption capacity is collapsed and reduced. This can prevent the entire rehydration of dried food product (Krokida et al., Citation2003). Increasing of EA concentration did not give significant changes to the RR (). As the rehydration temperature increased from 10°C to 80°C, the RR of foam mat dried H. sabdariffa L. powder also increased significantly (). The higher the value of the RR, the better the quality of the dried product because the pores of the dried product allow the water to go into the cells (Okpala and Ekechi, Citation2014).
There was no significant difference in COR value when increasing EA concentration (). However, COR values increased significantly when the rehydration temperature increased. The RR and COR values were maximum at temperature of 80°C. The high value of COR represented the greater ability of water absorption in H. sabdariffa L. sample.
Figure 5. Coefficient of rehydration of foam mat dried Hibiscus sabdariffa L. powder at different temperatures (10–80°C): ![]()
Color of Rehydrated Powder
Color is an attribute that consumers very much concerned with. Non-enzymatic browning, pigment destruction, or other reaction that causes the change of product color may affect the acceptability of consumers (Maskan, Citation2001). The results of color parameters (L*, a*, and b*) after rehydration at different temperatures (10°C, 25°C, 40°C, 60°C, and 80°C) were presented in –.
Figure 6. Color (L*) of rehydrated foam mat dried Hibiscus sabdariffa L. powder at temperatures (10–80°C): ![]()
Figure 7. Color (b*) of rehydrated foam mat dried Hibiscus sabdariffa L. powder at temperatures (10–80°C): ![]()
The L* value shows whiteness of the product. As EA concentration increased, lightness (L*) increased except at 15% EA, whereas redness (a*) and yellowness (b*) increased significantly from 0 to 20% of EA concentration ( and ). The redness value of the powder and rehydrated juice increases with increase in EA concentration which might relate to higher foam expansion as EA concentration increases. High foam expansion ratio will cause rapid drying; therefore, the redness color of the powder could be retained high. Increase in the temperature from 10°C to 40°C for rehydrated foam mat dried H. sabdariffa L. powder did not significantly affect the L* values as shown in . In addition, the temperature did not affect a* values of rehydrated foam mat dried H. sabdariffa L. powder (). However, b* values of rehydrated foam mat dried H. sabdariffa L. powder increased as temperature increased from 10°C to 25°C, except at 20% of EA concentration.
Figure 8. Color (a*) of rehydrated foam mat dried Hibiscus sabdariffa L. powder at temperatures (10–80°C): ![]()
In general, when EA concentration increased, the color of rehydrated foam mat dried powder showed higher a* values. This indicated that high concentration of EA in foam mat dried H. sabdariffa L. powder can satisfy consumer on red color juice preference. However, the rehydration temperature did not give significant effect to a* values of foam mat dried H. sabdariffa L. powder.
Conclusion
H. sabdariffa L. powder can be produced by foam mat drying using EA as a foaming agent, then further hot air dried and ground into powder. Increase in concentration of EA caused an increase in foam expansion and foam stability but decrease in the foam density. Increase in EA concentration causes increase in pH and TSS but decrease in both water activity and moisture content of foam mat dried H. sabdariffa L. powder. Overall, foam mat dried H. sabdariffa L. powder using 15% EA concentration showed better foam expansion, foam density, water activity, and red color powder. Foam mat dried H. sabdariffa L. powder may be used as a natural colorant in food product application and as an ingredient in the food industry for confectionery, beverage, and dairy product formulations.
Author Contributions
Rabiha Sulaiman designed the study and interpreted the results. Suet Li Tan collected test data and drafted the manuscript.
References
- Abbasi, E., and M. Azizpour. 2016. Evaluation of physicochemical properties of foam mat dried sour cherry powder. LWT-Food Sci.Technol. 68:105–110. doi: 10.1016/j.lwt.2015.12.004.
- Affandi, N., W. Zzaman, T.A. Yang, and A.M. Easa. 2017. Production of Nigella sativa beverage powder under foam mat drying using egg albumen as a foaming agent. Beverages 3(1):9. doi: 10.3390/beverages3010009.
- Amidon, G.E., P.J. Secreast, and D. Mudie. 2009. Particle, powder, and compact characterization, p. 163–183. In: Y. Qiu, Y. Chen, and G.G.Z. Zhang (eds.). Developing solid dosage forms. Elsevier, New York.
- Asokapandian, S., S. Venkatachalam, G.J. Swamy, and K. Kuppusamy. 2016. Optimization of foaming properties and foam mat drying of muskmelon using soy protein. J Food Process Eng 39(6):692–701. doi: 10.1111/jfpe.2016.39.issue-6.
- Association of Official Analytical Chemists. (2015). Official methods of analysis of the association of official analytical chemists (15th ed.). Method: 934.01. Washington, DC: AOAC International
- Bag, S.K., P.P. Srivastav, and H.N. Mishra. 2011. Optimization of process parameters for foaming of bael (Aegle marmelos L.) fruit pulp. Food Bioprocess Technol. 4(8):1450–1458. doi: 10.1007/s11947-009-0243-6.
- Benkovic, M., and I Bauman. 2009. Flow properties of commercial infant formula powders. World Academy Of Science, Engineering & Technology 54(6):495–499.
- Chaves, M.A., I. Barreto, R.C. Reis, and D.M. Kadam. 2013. Physicochemical and sensory properties of purple Brazilian cherry (Eugenia uniflora, L.) foams. Int. J. Food Sci. Technol. 48(8):1688–1697. doi: 10.1111/ijfs.12139.
- Dehghannya, J., M. Pourahmad, B. Ghanbarzadeh, and H. Ghaffari. 2018. Heat and mass transfer modeling during foam-mat drying of lime juice as affected by different ovalbumin concentrations. J Food Eng. 238:164–177. doi: 10.1016/j.jfoodeng.2018.06.014.
- Duangmal, K., B. Saicheua, and S. Sueeprasan. 2008. Colour evaluation of freeze-dried roselle extract as a natural food colorant in a model system of a drink. LWT-Food Sci.Technol. 41(8):1437–1445. doi: 10.1016/j.lwt.2007.08.014.
- El Hakim, A.E. 2010. Biochemical and molecular characterization of three colored types of roselle (Hibiscus sabdariffa L.). J. Am. Sci. 6(11):726–733.
- Falade, K., K. Adeyanju, and P. Uzo-Peters. 2003. Foam-mat drying of cowpea (vigna unguiculata) using glyceryl monostearate and egg albumin as foaming agents. Eur. Food Res. Technol. 217(6):486–491. doi: 10.1007/s00217-003-0775-3.
- Fellow, P.J. 2016. Food Processing Technology: Principle and Practice, 4th Ed (pp. 47) Cambridge, UK: Woodhead Publishing
- Fitzpatrick, J.J., M. Hodnett, M. Twomey, P.S.M. Cerquira, J. O’Flynn, and Y.H. Roos. 2007. Glass transition and the flowability and caking of powders containing amorphous lactose. Powder Technol. 178:119–128. doi: 10.1016/j.powtec.2007.04.017.
- Franco, T.S., C.A. Perussello, L.N. Ellendersen, and M.L. Masson. 2016. Effects of foam mat drying on physicochemical and microstructural properties of yacon juice powder. LWT-Food Sci.Technol. 66:503–513. doi: 10.1016/j.lwt.2015.11.009.
- Ghoroi, C., L. Gurumuthy, D.J. McDaniel, L.J. Jallo, and R.N. Dave. 2012. Multi-faceted characterization of pharmaceutical powders to discern the influence of surface modification. Powder Technol. 236:63–74. doi: 10.1016/j.powtec.2012.05.039.
- Gonzalez-Palomares, S., M. Estarrón-Espinosa, J.F. Gómez-Leyva, and I. Andrade-González. 2009. Effect of the temperature on the spray drying of roselle extracts (Hibiscus sabdariffa L.). Plant Foods for Hum. Nutr. 64(1):62–67. doi: 10.1007/s11130-008-0103-y.
- Hahn, F., G. Hernandez, J. Hernandez, C. Perez, and J. Vargas. 2011. Optimization of roselle drying time and drying quality. Can. Biosyst. Eng. 53:31–38.
- Hardy, Z., and V.A. Jideani. 2015. Foam-mat drying technology: A review. J. Food Process Preserv. 39:3165–3174.
- Hussein, R.M., Y.E. Shahein, A.E. El Hakim, and H.M. Awad. 2010. Biochemical and molecular characterization of three colored types of roselle (Hibiscus sabdariffa L.). J. Am. Sci. 6(11):726–733.
- Idham, Z., I.I. Muhamad, and M.R. Sarmidi. 2012. Degradation kinetics and color stability of spray-dried encapsulated anthocyanin from Hibiscus sabdariffa L. J Food Process Eng 35(4):522–542. doi: 10.1111/j.1745-4530.2010.00605.x.
- Kadam, D.M., R.A. Wilson, and S. Kaur. 2010. Determination of biochemical properties of foam mat dried mango powder. Int. J. Of Food Sci. Technol. 45:1626–1632. doi: 10.1111/j.1365-2621.2010.02308.x.
- Kadam, D.M., and S. Balasubramanian. 2011. Foam mat drying of tomato juice. J. Food Process Preserv. 35(4):488–495. doi: 10.1111/jfpp.2011.35.issue-4.
- Kandasamy, P., N. Varadharaju, S. Kalemullah, and R. Moitra. 2012. Production of papaya powder under foam-mat drying using methyl cellulose as foaming agent. Asian J. Food Agro-Ind. 5(05):374–387.
- Karim, A., and C.L. Law. 2017. Intermittent and nonstationary drying technologies: Principles and Applications. London: CRC Press.
- Kaushal, M., P.C. Sharma, and R. Sharma. 2013. Formulation and acceptability of foam mat dried seabuckthorn (Hippophae salicifolia) leather. J Food Sci Technol 50(1):78–85. doi: 10.1007/s13197-011-0236-0.
- Kha, T.C., C. Tuyen, M.H. Nguyen, and P.D. Roach. 2011. Effects of pre-treatments and air drying temperature on colour and antioxidant properties of gac fruit powder. Int. J. Food Eng. 7(3):1556–3758. doi: 10.2202/1556-3758.1926.
- Krasaekoopt, W., and S. Bhatia. 2012. Production of yogurt powder using foam-mat drying. AU J. Technol. 15(3):166–171.
- Krokida, M.K., V. Karathanos, Z. Maroulis, and D. Marinos-Kouris. 2003. Drying kinetics of some vegetables. J Food Eng 59(4):391–403. doi: 10.1016/S0260-8774(02)00498-3.
- Kudra, T., and C. Ratti. 2006. Foam-mat drying: Energy and cost analyses. Can. Biosyst. Eng. 48:3.
- Lomakina, K., and K. Mikova. 2006. A study of the factors affecting the foaming properties of egg white – a review. Czech J. Food Sci 24(3):110–118. doi: 10.17221/3305-CJFS.
- Maskan, M. 2001. Kinetics of colour change of kiwifruits during hot air and microwave drying. J Food Eng 48(2):169–175. doi: 10.1016/S0260-8774(00)00154-0.
- Mokhtar, T.A., Y.A. Yusof, N.L. Chin, S.H. Othman, A.D. Serikbaeva, and M.G. Aziz. 2015. Physicochemical properties of tamarind and pineapple fruit pulps and powders. Int. Food Res. J. 22(2):707–712.
- Moon, J.H., and W.B. Yoon. 2017. Effect of moisture content and particle size on grinding kinetics and flowability of balloon flower (Platycodon grandiflorum). In: Food Science and Biotechnology. p. 1–10.
- Okpala, L.C., and C.A. Ekechi. 2014. Rehydration characteristics of dehydrated West African pepper (Piper guineense) leaves. Food Sci. Nutr. 2(6):664–668. doi: 10.1002/fsn3.149.
- Prommajak, T., and P. Ravivan. 2013. Physical properties of gelatin extracted from skin of thai panga fish (Pangasius bocourti Sauvage). J. Food Appl. Biosci. 1(3):131–145.
- Quek, S.Y., N.K. Chok, and P. Swedlund. 2007. The physicochemical properties of spray-dried watermelon powders. Chem. Eng. Process.: Process Intensif. 46(5):386–392. doi: 10.1016/j.cep.2006.06.020.
- Rajkumar, P., R. Kailappan, R. Viswanathan, G. Raghavan, and C. Ratti. 2007. Foam mat drying of alphonso mango pulp. Drying Technol. 25(2):357–365. doi: 10.1080/07373930601120126.
- Ramallo, L.A., and R.H. Mascheroni. 2012. Quality evaluation of pineapple fruit during drying process. Food Bioprod. Process. 90(2):275–283. doi: 10.1016/j.fbp.2011.06.001.
- Ranjani, I.S., and K. Ramamurthy. 2010. Relative assessment of density and stability of foam produced with four synthetic surfactants. Mater. Struct. 43(10):1317–1325. doi: 10.1617/s11527-010-9582-z.
- Sagar, V., and P.S. Kumar. 2010. Recent advances in drying and dehydration of fruits and vegetables: A review. J Food Sci Technol 47(1):15–26. doi: 10.1007/s13197-010-0010-8.
- Sandler, N., K. Reiche, J. Heinämäki, and J. Yliruusi. 2010. Effect of moisture on powder flow properties of theophylline. Pharmaceutics 2(3):275–290. doi: 10.3390/pharmaceutics2030275.
- Sangamithra, A., S. Venkatachalam, S.G. John, and K. Kuppuswamy. 2015b. Foam mat drying of food materials: A review. J. Food Process Preserv.. 39:3165–3174. doi: 10.1111/jfpp.12421.
- Sangamithra, A., V. Sivakumar, K. Kannan, and S.G. John. 2015a. Foam-mat drying of muskmelon. Int. J. Food Eng. 11(1):127–137. doi: 10.1515/ijfe-2014-0139.
- Shruthi, V.H., C.T. Ramachandra, U. Nidoni, S. Hiregoudar, N. Naik, and A.R. Kurubar. 2016. Roselle (Hibiscus Sabdariffa L.) as a source of natural colour: A review. Plant Arch. 16(2):515–522.
- Sujata, Y. 2014. Egg powder and its quality control. Online Int. Interdiscip. Res. J. 4(1):204–219.
- Thuwapanichayanan, R., S. Prachayawarakorn, and S. Soponronnarit. 2008. Drying characteristics and quality of banana foam mat. J Food Eng 86(4):573–583. doi: 10.1016/j.jfoodeng.2007.11.008.
- Thuwapanichayanan, R., S. Prachayawarakorn, and S. Soponronnarit. 2012. Effects of foaming agents and foam density on drying characteristics and textural property of banana foams. LWT-Food Sci.Technol. 47(2):348–357. doi: 10.1016/j.lwt.2012.01.030.
- Wong, P., S. Yusof, H. Ghazali, and Y. Che Man. 2002. Physico-chemical characteristics of roselle (Hibiscus sabdariffa L.). Nutr. Food Sci. 32(2):68–73. doi: 10.1108/00346650210416994.