
ABSTRACT
This paper describes the effect of harvest time on some fruit quality of green gage (Prunus domestica L.) genotypes. Fruits of 10 greengage genotypes including Damiri, Gareh Zar, MP102, MP115, MP125, Gojeh Soltan, MP110, Sari Zar Zehtab, and MP118 were collected in 2015 from a 15-year-old green gage orchard located at Maragheh, Iran. Fruit were picked three times (50 days after full bloom, 80 days after full bloom and during maturation) in 2015 from each genotype. Some parameters related to fruit quality, such as fruit weight (FW), dry weight (DW), fruit volume (FV), flesh firmness (FF), total soluble solids (TSS), titratable acidity (TA), vitamin C (VC), total phenolics (T-Phs), total flavonoid (T-Flav), total antioxidant (T-Ant), flavonoids [catechin (Cat) and quercetin (Quer)] and phenolic acids [caffeic acid (Caf) and chlorogenic acid (Chl)] were analyzed. Results showed a significant effect (p < .01) of genotype, harvest time, and interaction effect of genotype×harvest time on the studied traits. Traits such as TA, TSS, VC, and T-Phs increased with fruit development. Conversely, Chl, T-Ant, and FF decreased during fruit ripening stages. According to the PCA results, at all harvest times, Ghareh Zar genotype was best-characterized due to their considerable amounts of TA.
Introduction
Prunus L. (Rosaceae) is a diverse genus of about 200 species of small trees or shrubs with pentamerous flowers and monocarpellate drupes (Robertson, Citation1974). Species of the genus Prunus L. are distributed in the northern hemisphere and most of the cultivated species occur in semiarid climates and are found under varying ecological conditions (Donmez and Yildirimli, Citation2000). Many species of the genus Prunus L. is important for fruit production and it includes plums, apricots, sweet cherry, almonds and peaches (Gilani et al., Citation2011). Plums (Prunus spp.) are grown under a vast range of climatic conditions, as shown by the diversity of species worldwide. Generally, the European (Prunus domestica L.), the Asian or Japanese (Prunus salicina Lindl.) and the American (Prunus americana Marsh.) plums are more important in terms of commercial production. Green gage (Prunus domestica subsp. italica) is a type of plum that is widely grown in Iran. Green gage is a medium-sized fruit, rather asymmetrical, with green to green-yellowish skin, greenish-yellow flesh, fairly firm, tasty and sweet (Guerra and Casquero, Citation2008). The total area under green gage cultivation in Iran is more than 16000 ha with a total production of about 130000 tons (Agricultural Ministry of Iran, Citation2017). In Iran, the fruit of green gage consumed as not-fully ripe fruits in the spring and is among the most popular fruit species with a characteristic sweet-sour taste. Hardness, sweetness, juiciness, sourness are main parameters in determining the eating quality of fruits that can be affected by genotypes, environment and management factors. Sensory evaluation of green gage plums showed that the most valuable fruit were those with high levels of sugars, low levels of acidity and intermediate firmness (Guerra and Casquero, Citation2008). These traits have been used in order to evaluate different cultivars. Harvest date is one of the main factors determines the fruit quality and consumer acceptance. Some researchers study the effects of harvest date on fruits quality. Yousef et al. (Citation2016) reported an increasing trend of fruit soluble solid content and a decreasing trend of acidity during plum fruit maturation and ripening. Saridas et al. (Citation2016) reported a decrease in the total acid concentration of green plums (Prunus cerasifera Ehrh.) during the ripening progress. In other studies, researchers showed that phenolic phytochemicals and antioxidant activity would be influenced by maturity, genotype, and environmental conditions (Gündüz and Saraçoğlu, Citation2012; Sharma et al., Citation2012). Given that no previously-published studies have analyzed the fruit quality of green gages and its effect from harvest date in Iran, the present study was performed to assess the quality parameters of 10 green gage genotypes grown in East Azerbaijan Province, Iran, at different maturation stages.
Materials and Methods
Study Area and Data Collection
Fruits of 10 greengage genotypes including Damiri, Gareh Zar, MP102, MP115, MP125, Gojeh Soltan, MP110, Sari Zar Zehtab, and MP118 were collected in 2015 from 15-year-old green gage orchard with a plant spacing of 5 × 5 m located at Maragheh, Iran. Fruit were picked three times (first: 50 days after full bloom, second: 80 days after full bloom and third: during maturation) in 2015 from each genotype. For each harvest time and genotype, the experiment consisted of 3 replications which one tree was used for each replication. Fruit quality attributes including some parameters related to fruit quality, such as fruit weight (FW), fruit dry weight (DW), fruit volume (FV), flesh firmness (FF), total soluble solids (TSS), titratable acidity (TA), vitamin C (VC), pH, total phenolics (T-Phs), total flavonoid (T-Flav), total antioxidant (T-Ant), flavonoid and phenolic acids [catechin (Cat), caffeic acid (Caf), quercetin (Quer) and chlorogenic acid (Chl)] were determined.
Measurement of Traits
Fruit weight was measured by precision scales (0.1 g). From each tree, 10 fruits were used to determine flesh firmness that checked by Penetrometer (FT-327). The volume of each fruit was calculated according to water displacement method (Mohsenin, Citation1970) by following equation: Fruit volume = W/ɣ where W and ɣ were considered as weight of displaced water and weight density of water, respectively. The vitamin C content was determined by titration with 2,6-dichlorophenolindophenol (DCIP) (AOAC, Citation2000) and expressed in l mg of vitamin C per 100 g fruit weight (FW). Titrable acidity was determined according to Ferrer et al. (Citation2005) by titration with sodium hydroxide (0.1 N) to pH 8.10. Total phenolics content of green gage extracts was determined according to modified Folin–Ciocalteu procedure (Singleton et al., Citation1999) and results were expressed as mg of gallic acid equivalent (GAE) per g (mg GAE g−1) of the fresh weight. The determination of the antioxidant capacity was performed by Free Radical Scavenging effect over 1,1 -DiPhenyl-2-PicrylHydrazyl (DPPH) with some modifications (Brand-Williams et al., Citation1995; Odriozola-Serrano et al., Citation2008). Samples of green gage were centrifuged at 10000 rpm for 10 min at 4°C and aliquots of 0.01 ml of the supernatant were mixed with 3.9 ml of methanolic DPPH (0.025 g l−1) and 0.09 ml of distilled water. The homogenate was shaken vigorously and kept in darkness for 30 min. Absorption of the samples was measured on a spectrophotometer at 515 nm. To determine the antioxidant capacity of samples absorbance values were compared with those obtained from standard curves of trolox (10–100 μmol l−1). Antioxidant capacity values were expressed as trolox equivalents (TE) g−1 fw.
The total flavonoid content of fruit extracts was determined by a colorimetric method as described by Chang et al. (Citation2002) with modification. Flavonoids [catechin (Cat) and quercetin (Quer)] and phenolic acids [caffeic acid (Caf) and Chlorogenic acid (Chl)] were determined using high-performance liquid chromatography (HPLC) and method explained by Bakhshi and Arakawa (Citation2006). For this purpose, 1 ml of solvent (methanol/acetic acid, 85:15, v/v) was added to 1 g of green gage tissue. The samples were kept in a refrigerator for 24 h and centrifuged for 10 min at 10000 rpm. The supernatants of centrifuged samples were filtered through a disposable 0.45 μm syringe filter. Fifty microliters of the filtered sample were injected in HPLC (Waters, 1525, Milford, USA) equipped with a UV-Visible detector (Waters Dual λ Absorbance 2487), using C18 column: Waters Symentery C18 5 μm 4.6 × 150 mm (Waters, Dublin, Ireland), and detection at 280 and 350 nm. The Flavonoid and phenolic acids were identified by comparing their UV spectra and retention times with those of the corresponding standards and by the spiking of samples with the appropriate standard. Catechin and chlorogenic acid standards purchased from Sigma-Aldrich (Canada Ltd) and quercetin from extrasynthase, France.
Data Statistical Analysis
In order to show the effect of genotype and harvesting time on the green gage fruit morphological and biochemical traits, the analysis of variance was performed using SAS 9.2 (SASInstitute Inc., Cary, North Carolina, USA), Tukey comparison tests were also included at a significance level α = 0.05.
Relationships among the genotypes were investigated by principal component analysis (PCA). PCA was performed using the statistic program “Minitab 16”. For each harvest time, means of three replications were used to create a correlation matrix from which standardized principal component (PC) scores were extracted. To determine which of the PCs accounted for the greatest amount of variation, the eigenvalues of the 4 PCs were compared for each trait.
Result and Discussion
Results showed that the effects of genotype, harvest time, and the interaction effect of genotype×harvest time on studied traits were significant (p < .01; and ).
Table 1. Analysis of variance for studied traits of Green Gage cultivars at three harvest time.
Table 2. Analysis of variance for studied traits of Green Gage cultivars at three harvest time.
Results showed that FF decreased with fruit development. Conversely, FV, WW, and DW increased during fruit ripening stages. Similar results were previously reported by Saridas et al. (Citation2016) for green plums (Prunus cerasifera Ehrh.). Generally, firmness as an external quality parameter is associated with internal quality properties, such as eating quality, flesh color, and sugar content (Usenik et al., Citation2014).
TSS strongly depended on the ripening stage and it increased during fruit ripening. This result is in agreement with the results of Guerra and Casquero (Citation2010) who reported that the total soluble solids in the fruit increase with maturity stages. Saridas et al. (Citation2016) reported differences in total soluble solids among green plums cultivars that decreased with progressive ripening. The differences between cultivar can be attributed to sugar accumulation mechanism and activities of sugar metabolism enzymes due to controlled hormonal action (Osorio and Fernie, Citation2013; Saridas et al., Citation2016).
In all genotypes, TA in the first harvest time was lower than the second and third harvest time. The highest and lowest value of TA was related to Ghareh Zar in the second harvest time (4.9 mg malic acid 100 mL–1) and Damiri in the first harvest time (0.5 mg malic acid 100 mL–1), respectively. Osorio and Fernie (Citation2013) reported that the concentration of total acidity in two green plum cultivars increased during the fruit ripening. These results also agree with those obtained by Usenik et al. (Citation2013) for two plum cultivars. Gündüz and Saraçoğlu (Citation2012) reported a significant difference in total acidity between 18 accessions and five cultivars of plum (P. cerasifera).
The amount of VC was more variable between genotypes and harvest times but generally it was increasing for most of the genotypes during fruit development (). The highest (28.9 mg 100 g−1 FW) and lowest (1.6 mg 100 g−1 FW) value of vitamin C were observed in MP115 at third harvest time and MP110 at first harvest time, respectively. Serrano et al. (Citation2005) reported that VC levels halved during the early phases of sweet cherry fruit development and then progressively increased until the end of the ripening process. Increment of VC during the fruit ripening was reported in some crops such as Japanese plum (Yousef et al., Citation2016) and apricot (Hegedüs et al., Citation2011). Gündoğdu et al. (Citation2013) showed significant difference in VC content between apricot cultivars.
Table 3. Interaction effect of genotype×harvest time on studied traits.
As shown in , T_Ant content significantly decreased with fruit development. Numerous researchers have shown that the antioxidant capacity increases during fruit ripening (Mahmood et al., Citation2013; Usenik et al., Citation2013). Usenik et al. (Citation2013) reported the linear trend of average total antioxidant activity during the ripening of plum cultivars. They reported that the average total antioxidant activity was statistically higher in plum peel compared to flesh. However, Miletic et al. (Citation2012) reported the lack of clear trend in changes in the antioxidant capacity during fruit development of plum cv. ‘Stanley’ (Prunus domestica L.). Díaz-Mula et al. (Citation2009) reported that differences in antioxidant capacity depending on the variety during maturation of several plum varieties grown under the same conditions.
Table 4. Interaction effect of genotype×harvest time on studied traits.
The content of Chl during the fruit development did not have the same pattern for different genotypes (). It was declining for the Ghareh Zar, MP115, MP125, Sari Zar, and Zehtab genotypes while Zehtab genotype showed an increasing trend with fruit development. Increment of chlorogenic acid content during fruit growth and ripening were reported in Loquat (Ding et al., Citation2001). The enzyme quinate hydroxycinnamoyl transferase (CQT) catalyzes the reversible exchange of CoA thioester and quinate groups in the synthesis and breakdown of chlorogenic acid (Rhodes and Wooltorton, Citation1976). CQT activity has been shown to be stimulated with advanced fruit ripening. Due to these characteristic increases in enzyme activity, the biosynthesis of chlorogenic acid during ripening may be sustained, and the increase in enzyme activity leads to an accumulation of this phenolic compound (Ding et al., Citation2001).
Results showed that Damiri genotype at the second harvest time with 27.1 mg/kg FW had the highest and Zehtab genotype at the last harvest time with 0.2 mg kg−1 FW had the lowest value of catechin (Cat). Tomás-Barberán et al. (Citation2001) showed a progressive growth in CAT concentration during fruit development, a decrease being reported when the fruits reached maturation. The study that dealt with the determination of phenolic compounds in three species of plum reported that the content of catechin in P. domestica L. (5.17 mg kg−1 fw) was more than P. spinosa L. (2.12 mg kg−1 fw) and P. cerasifera Ehrh. (1.72 mg kg−1 fw) (Celik et al., Citation2017). A comparison of catechin content in 27 types of fruit showed that the highest content of this compound was recorded in plums (49 mg 100 g−1), followed by the content in apples (10–43 mg 100 g−1) and berries (5–20 mg 100 g−1) (Auger et al., Citation2004).
Variation of caffeic acid (Caf) during the fruit ripening did not have the same pattern in different genotypes. MP115 and Zehtab genotypes at the later harvest time showed the highest and lowest value of Caf, respectively. Tian et al. (Citation2009) reported that caffeic acid increased with harvest time delay in grape. Miletić et al. (Citation2013) showed a significant difference among two plum cultivars in terms of caffeic acid content. Celik et al. (Citation2017) recorded higher caffeic acid content in P. domestica L. and P. spinosa L. compared to P. cerasifera Ehrh.
The individual effect of harvest time showed a decreasing trend of Quer with progressive ripening. However, mean comparison of genotype×harvest time interaction effect showed a different response of genotypes. As shown in , Damiri genotype at the first harvest time had the highest value of Quer (50.35 mg 100 g−1 FW) and the lowest value (0.84 mg 100 g−1 FW) was recorded for Ghojeh Soltan genotype at the second harvest time. Bobrich et al. (Citation2014) reported that total quercetin glycoside content in two varieties of Japanese plum (Prunus salicina Lindl.) increased during the fruit ripening. Arancibia-Avila et al. (Citation2008) showed that the amount of quercetin in ripe durian (Durio zibethinus Murr., cv. Mon Thong) were significantly higher than in mature and overripe fruits.
The results showed that T-Phs increased with fruit development. This result is in agreement with the findings of Usenik et al. (Citation2013) who reported an increasing trend of total phenolic content in the peel of plum cultivars ‘Haganta’. However, findings of some researchers on plum cultivars showed decreased concentrations of phenols during ripening process (Vlaic et al., Citation2017). Saridas et al. (Citation2016) reported significant differences in total phenol content between green plum cultivars. The difference between reports on plums fruit total phenol content during the fruit development can be attributed to genetic, cultural practices and the maturity stage.
The T-Flv Content during the fruit development had not the same pattern for different genotypes (). Higher values of T-Flv were observed at the second harvest time for Damiri and MP118 genotypes with 108 and 104 mg QE 100 g−1, respectively. Vlaic et al. (Citation2017) reported that total flavonoid content in plum cultivars decreased during the fruit development stages.
PCA Analysis
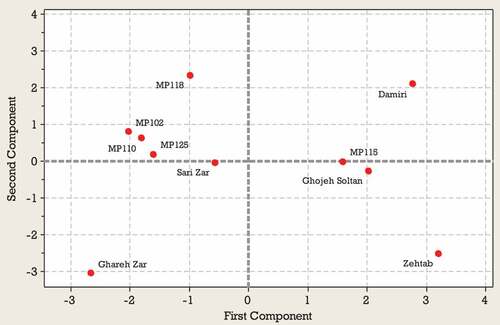
Generally principal component analysis is used to identify the most significant variables in the data set (Rakonjac et al., Citation2010). The results of the PCA for the first harvest time indicated that the first four PCs explained 34, 21, 17 and 13% of the total variation, totalling 85% (). Evaluation of the coefficients indicated that TSS, TA, FV, DW, T_Ant, and T_Flav were highly correlated with PC1 (, ). Caf, Cat, Chl, VC, and TA were among the most important traits correlated with PC2 (, ) and Chl, Quer and T-Phs were important components of PC3. Specific patterns of correlation between the variables tested can be visualized by comparing loading plots between the PCs. The objective of a loading projection is to visualize the position of the variables with respect to one another in two-dimensional space and their corresponding correlations. Variables closest to one another and far from the plot origin are positively correlated, while variables opposite one another on the plot are negatively correlated. shows the loading plot of the studied traits at first harvest time for first two PCAs. TSS, FV, DW, and T_Ant with positive loadings on PC1 significantly correlated with each other. Also, TA and T_Flav with negative loadings on PC1 significantly correlated with each other. In the PC2, a significant correlation was observed between Caf, Chl, Cat, and Quer with positive loadings and between VC and TA with negative loadings. shows the score plot of Green gage genotypes for the first two PCAs at the first harvest time. In fact, similar positions of various genotypes in the PCA plot indicated their similar traits. Ghareh Zar and Zehtab genotypes were best-characterized due to their considerable amounts of TA and T-Ant, respectively ( and ). As shown in , a close association was observed among MP110, MP125, and MP102 genotypes located on the left side of the plot.
Table 5. Eigenvalues, proportion of total variability and correlation between the variables at the first three principal components (PCs).
Figure 1. Loading plot of studied traits at first harvest time according to the first two PCAs.
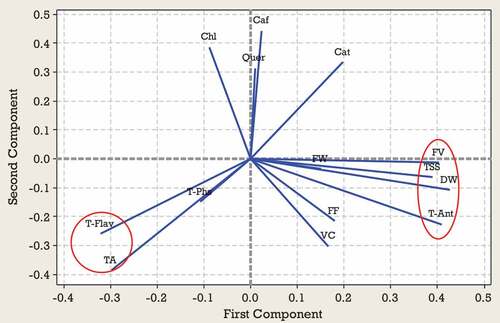
Figure 2. Score plot of Green gage genotypes for the first two PCAs at the first harvest time.
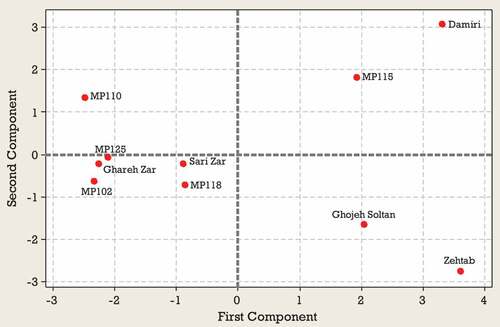
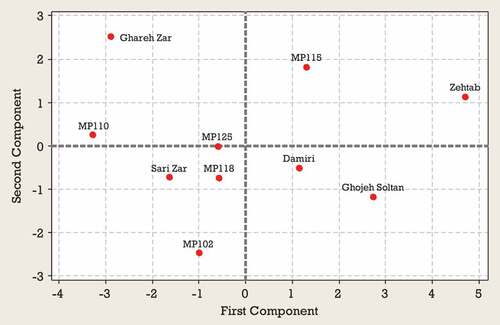
Results from the PCA for second harvest time indicated that 87% of the observed variability was explained by the first four components (). In the second harvest time, PC1 represented mainly from TSS, VC, FV, FW, DW, T-Ant, and T-Phs and accounted for 43% of the variance. PC2 represented Cat, Quer, and Caf accounted for 20% of the variance. PC3 explained TA, FF, Chl, and T-Flav and accounted for 13% of the variance. On PC4 the highest scores were due to TA FF, FW, and Chl (). According to , a significant positive correlation was observed between TSS, VC, FV, FW, DW, T-Ant, and T-Phs located on the lower right side of the plot. Also, a significant positive correlation was observed between Quer and Cat located in the upper right side of the plot (). Based on the position, Zehtab genotype is characterized by a higher amount of T-Phs content and Ghareh Zar genotype was best-characterized due to their considerable amounts of TA (). Sari Zar and MP118 genotypes were located close to the center of bi-plot, indicating that they could not be characterized by any of the studied traits ().
Figure 3. Loading plot of studied traits at the second harvest time according to the first two PCAs.
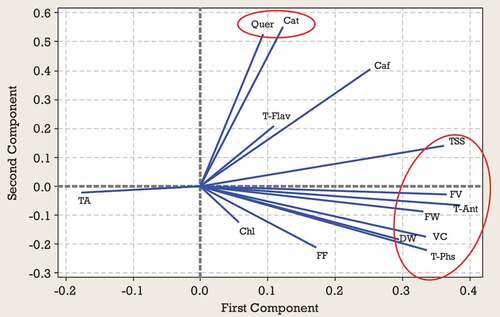
Figure 4. Score plot of Green gage genotypes for the first two PCAs at the second harvest time.
The results of PCA for third harvest time indicated that the first four components explained 85% of the total observed variability. PC1 represented TSS, FV, FW, DW, Quer, and T-Phs accounted for 43% of the variance. PC2 represented TA, FF, T-Ant, and Cat accounted for 20% of the variance. The highest contribution on PC3 corresponded to TA, T-Flav, and Caf. On PC4 the highest scores were due to TSS, T-Ant, Chl, and T-Flav. PC3 and PC4 explain 13 and 11% of the total variability observed, respectively (). PCA bi-plot (PC1 versus PC2) obtained from some morphological and biochemical traits of 10 Green gage genotypes are shown in the and . According to , a significant positive correlation was observed between TSS, VC, FV, FW, DW, Quer and T-Phs. Also, TA, Cat, and FF significantly correlated with each other. According to , based on the position, Zehtab genotype is characterized by a higher amount of T-Phs, Chl, FW and FV. Ghareh Zar genotype was best-characterized due to their considerable amounts of FF, TA and Cat (). Sari Zar, MP118, MP125, and Damiri genotypes were located close to the center of bi-plot, indicating that they could not be characterized by any of the studied traits ().
Figure 5. Loading plot of studied traits at the third harvest time according to the first two PCAs.
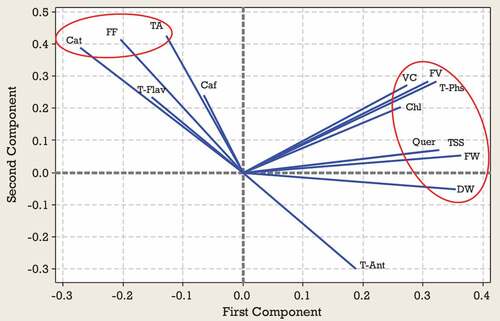
Figure 6. Score plot of Green gage genotypes for the first two PCAs at the third harvest time.
Conclusion
Results showed a significant response of fruit quality traits to harvest time. Also, a significant difference was observed between studied genotypes in terms of fruit quality traits. Generally, traits such as TA, TSS, VC, T-Flv, and T-Phs increased with fruit development. Conversely, Chl, T-Ant, and FF decreased during fruit ripening stages. Damiri genotype showed the highest value of TSS at the third harvest time and T-Flv and CAT at the second harvest time. The most T-Ant was observed in the Zehtab genotype at the first harvest time and the higher value of T-Phs and Chl belonged to this genotype at the third harvest time. A higher value of TA and VC were observed in Gareh Zar and MP115 genotypes, respectively.
References
- Agricultural Ministry of Iran. 2017. Annual Statistical Book of 2017.
- AOAC. 2000. Official methods of analysis. Gaithersburg, MD, Association of Official Analytical Chemists, Gaithersburg, MD: Association of Official Analytical Chemists, p. 27.
- Arancibia-Avila, P., F. Toledo, Y.-S. Park, S.-T. Jung, S.-G. Kang, B.G. Heo, S.-H. Lee, M. Sajewicz, T. Kowalska, and S. Gorinstein. 2008. Antioxidant properties of durian fruit as influenced by ripening. LWT-Food Sci. Technol. 41:2118–2125. doi: 10.1016/j.lwt.2007.12.001.
- Auger, C., N. Al-Awwadi, A. Bornet, J.-M. Rouanet, F. Gasc, G. Cros, and P.-L. Teissedre. 2004. Catechins and procyanidins in Mediterranean diets. Food Res. Int. 37:233–245. doi: 10.1016/j.foodres.2003.11.008.
- Bakhshi, D., and O. Arakawa. 2006. Induction of phenolic compounds biosynthesis with light irradiation in the flesh of red and yellow apples. J Appl. Hortic. 8:101–104.
- Bobrich, A., K.J. Fanning, M. Rychlik, D. Russell, B. Topp, and M. Netzel. 2014. Phytochemicals in Japanese plums: Impact of maturity and bioaccessibility. Food Res. Int. 65:20–26. doi: 10.1016/j.foodres.2014.06.030.
- Brand-Williams, W., M.-E. Cuvelier, and C. Berset. 1995. Use of a free radical method to evaluate antioxidant activity. LWT-Food Sci. Technol. 28:25–30. doi: 10.1016/S0023-6438(95)80008-5.
- Celik, F., M. Gundogdu, S. Alp, F. Muradoglu, S. Ercişli, M.K. Gecer, and I. Canan. 2017. Determination of phenolic compounds, antioxidant capacity and organic acids contents of Prunus domestica L., Prunus cerasifera Ehrh. and Prunus spinosa L. fruits by HPLC. Acta. Chromatogr. 29:507–510. doi: 10.1556/1326.2017.00327.
- Chang, -C.-C., M.-H. Yang, H.-M. Wen, and J.-C. Chern. 2002. Estimation of total flavonoid content in propolis by two complementary colorimetric methods. J. Food Drug Anal. 10:178–182.
- Díaz-Mula, H., P. Zapata, F. Guillén, D. Martínez-Romero, S. Castillo, M. Serrano, and D. Valero. 2009. Changes in hydrophilic and lipophilic antioxidant activity and related bioactive compounds during postharvest storage of yellow and purple plum cultivars. Postharvest Biol. Technol. 51:354–363. doi: 10.1016/j.postharvbio.2008.09.007.
- Ding, C.-K., K. Chachin, Y. Ueda, Y. Imahori, and C.Y. Wang. 2001. Metabolism of phenolic compounds during loquat fruit development. J. Agric. Food. Chem. 49:2883–2888. doi: 10.1021/jf0101253.
- Donmez, A.A., and Ş. Yildirimli. 2000. Taxonomy of the genus Prunus L. (Rosaceae) in Turkey. Turk. J. Bot. 24:187–202.
- Ferrer, A., S. Remón, A.I. Negueruela, and R. Oria. 2005. Changes during the ripening of the very late season Spanish peach cultivar Calanda: Feasibility of using CIELAB coordinates as maturity indices. Sci. Hortic. 105:435–446. doi: 10.1016/j.scienta.2005.02.002.
- Gilani, S.A., R.A. Qureshi, M. Khan, F. Ullah, Z. Nawaz, I. Ahmad, and D. Potter. 2011. A molecular phylogeny of selected species of Genus Prunus L (rosaceae) from Pakistan Using the TRN-L & TRN-F Spacer DNA. Afr. J. Biotechnol. 10:4550–4554.
- Guerra, M., and P. Casquero. 2008. Effect of harvest date on cold storage and postharvest quality of plum cv. Green Gage. Postharvest Biol. Technol. 47:325–332. doi: 10.1016/j.postharvbio.2007.07.009.
- Guerra, M., and P. Casquero. 2010. Post-harvest quality of ‘Green Gage’European plum in integrated production: Effects of year and fruit maturity. Int. J. Hortic. Sci. Technol. 85:66–70.
- Gündoğdu, M., T. Kan, and M.K. Gecer. 2013. Vitamins, flavonoids, and phenolic acid levels in early-and late-ripening apricot (Prunus armeniaca L.) cultivars from Turkey. HortSci. 48:696–700. doi: 10.21273/HORTSCI.48.6.696.
- Gündüz, K., and O. Saraçoğlu. 2012. Variation in total phenolic content and antioxidant activity of Prunus cerasifera Ehrh. selections from Mediterranean region of Turkey. Sci. Hortic. 134:88–92. doi: 10.1016/j.scienta.2011.11.003.
- Hegedüs, A., P. Pfeiffer, N. Papp, L. Abrankó, A. Blázovics, A. Pedryc, and É. Stefanovits-Bányai. 2011. Accumulation of antioxidants in apricot fruit through ripening: Characterization of a genotype with enhanced functional properties. Biol. Res. 44:339–344. /S0716-97602011000400004.
- Mahmood, T., F. Anwar, I.A. Bhatti, and T. Iqbal. 2013. Effect of maturity on proximate composition, phenolics and antioxidant attributes of cherry fruit. Pak. J. Bot. 45:909–914.
- Miletić, N., O. Mitrović, B. Popović, V. Nedović, B. Zlatković, and M. Kandić. 2013. Polyphenolic content and antioxidant capacity in fruits of plum (Prunus domestica L.) cultivars “V aljevka” and “M ildora” as influenced by air drying. J. Food Qual. 36:229–237. doi: 10.1111/jfq.2013.36.issue-4.
- Miletic, N., B. Popovic, O. Mitrovic, and M. Kandic. 2012. Phenolic content and antioxidant capacity of fruits of plum cv.’Stanley’ (‘Prunus domestica’ L.) as influenced by maturity stage and on-tree ripening. Asian J. Res. Crop Sci. 6:681–687.
- Mohsenin, N.N. 1970. Physical properties of plant and animial materials. Vol. 1. Structure, physical characterisitics and mechanical properties. Physical properties of plant and animial materials. Vol. 1. Structure, physical characterisitics and mechanical properties. Gordon and Breach Science Publishers, New York.
- Odriozola-Serrano, I., R. Soliva-Fortuny, and O. Martín-Belloso. 2008. Effect of minimal processing on bioactive compounds and color attributes of fresh-cut tomatoes. LWT-Food Sci. Technol. 41:217–226. doi: 10.1016/j.lwt.2007.03.002.
- Osorio, S., and A.R. Fernie. 2013. Biochemistry of fruit ripening, p. 1–19. In: G.B. Seymour, M. Poole, J.J. Giovannoni, and G. Tucker (eds.). Molecular biology of fruit maturation and ripening. Wiley-Blackwell, Ames, IA, USA.
- Rakonjac, V., M.F. Akšić, D. Nikolić, D. Milatović, and S. Čolić. 2010. Morphological characterization of ‘Oblačinska’sour cherry by multivariate analysis. Sci. Hortic. 125:679–684. doi: 10.1016/j.scienta.2010.05.029.
- Rhodes, M.J., and L.S. Wooltorton. 1976. The enzymic conversion of hydroxycinnamic acids to p-coumarylquinic and chlorogenic acids in tomato fruits. Phytochem. 15:947–951. doi: 10.1016/S0031-9422(00)84376-9.
- Robertson, K.R. 1974. The genera of Rosaceae in the southeastern United States. J. Arnold Arbor. 55:344–401.
- Saridas, M.A., N.E. Kafkas, M. Zarifkhosroshahi, O. Bozhaydar, and S.P. Kargi. 2016. Quality traits of green plums (Prunus cerasifera Ehrh.) at different maturity stages. Turk. J. Agric. For 40:655–663. doi: 10.3906/tar-1603-45.
- Serrano, M., F. Guillén, D. Martínez-Romero, S. Castillo, and D. Valero. 2005. Chemical constituents and antioxidant activity of sweet cherry at different ripening stages. J. Agric. Food. Chem. 53:2741–2745. doi: 10.1021/jf0479160.
- Sharma, S., R. Sharma, R. Pal, V. Paul, and A. Dahuja. 2012. 1-Methylcyclopropene influences biochemical attributes and fruit softening enzymes of ‘Santa Rosa’Japanese plum (Prunus salicina Lindl.). J. Plant Biochem. Biotechnol. 21:295–299. doi: 10.1007/s13562-011-0098-6.
- Singleton, V.L., R. Orthofer, and R.M. Lamuela-Raventós. 1999. Analysis of total phenols and other oxidation substrates and antioxidants by means of folin-ciocalteu reagent. Meth. Enzymol. 299:152–178.
- Tian, -R.-R., Q.-H. Pan, J.-C. Zhan, J.-M. Li, S.-B. Wan, Q.-H. Zhang, and W.-D. Huang. 2009. Comparison of phenolic acids and flavan-3-ols during wine fermentation of grapes with different harvest times. Mol. 14:827–838. doi: 10.3390/molecules14020827.
- Tomás-Barberán, F.A., M.I. Gil, P. Cremin, A.L. Waterhouse, B. Hess-Pierce, and A.A. Kader. 2001. HPLC− DAD− ESIMS analysis of phenolic compounds in nectarines, peaches, and plums. J. Agric. Food Chem. 49:4748–4760. doi: 10.1021/jf0104681.
- Usenik, V., F. Stampar, and D. Kastelec. 2013. Phytochemicals in fruits of two Prunus domestica L. plum cultivars during ripening. J. Sci. Food Agric. 93:681–692. doi: 10.1002/jsfa.5783.
- Usenik, V., F. Stampar, and D. Kastelec. 2014. Indicators of plum maturity: When do plums become tasty? Sci. Hortic. 167:127–134. doi: 10.1016/j.scienta.2014.01.002.
- Vlaic, R., S. Socaci, A. Muresan, C. Muresan, O. Moldovan, S. Muste, and V. Muresan. 2017. Bioactive compounds and volatile profile dynamics during fruit growth of several plums cultivars. J. Agr. Sci. Tech. 19:1565–1576.
- Yousef, A.R., D.M. Ahmed, and S. Sarrwy. 2016. Effect of different harvest dates on the quality of beauty and japanese plum fruits after ripening. Int. J. Chem. React. Eng. 9:8–17.