
ABSTRACT
This study aimed to screen 135 cultivars of fig (Ficus carica L.) to identify the most suitable cultivars in terms of morpho-agronomic and biochemical characters. The free radical scavenging activity was assessed through DPPH, ABTS and β-Carotene bleaching assays. The studied genotypes exhibited significant variability (p < .01) following all traits analyzed. The Canonical Correlation Analysis (CCA) revealed a significant relationship between biochemical components and morpho-agronomic traits of fig. With the exception of the drop at the ostiole, lenticel color, and seed sizes, all variables showed highly significant differences. All studied genotypes averaged the fruit weigh of 34.41 ± 14.78 g with a dominance of globose shape. Based on the principal component analysis, the most discriminant attributes were the fruit geometrical traits, color, and peel characteristics. Also, the total sugars (10.08–15.10 g/100 gdw), total anthocyanins (0,41 to 47.95 mg cy-3-rutinoside/100 gdw) and flavonoids (103,7 ± 8.9–14.6 ± 4.6 mg CE/100 gdw) contributed significantly in fig assessment. Unweighted pair group cluster analysis based on Euclidean distance revealed five distinct groups. The local genotype ‘Ounq Hmam PS14ʹ showed a typical profile and was classified as an independent branch. The findings confirmed the effectiveness of combining morpho-agronomic and biochemical analyses in fig assessment. They also showed that the studied fig germplasm has high phenotypic diversity, which is probably more genetically related. The studied accessions can be recognized as an important gene pool for future breeding programs.
Introduction
Figs (Ficus carica L., 2n = 26) are one of the oldest cultivated plants (Valdeyron and Lloyd, Citation1979). They have evolved into over 800 different species, making the Ficus genus one of the most known in the number of species of all plant genera (Pourghayoumi et al., Citation1986; Veberic and Mikulic-Petkovsek, Citation2016). Fig trees belong to the Mulberry family (Moraceae). It was believed that they have been domesticated five thousand years earlier than millet and wheat (Hirst, Citation1996). Since then, scientists have been interested to study the diversity within fig species (Khadivi et al., Citation2018). The East Mediterranean region is considered the area of its domestication (Ercisli et al., Citation2012; Tous and Ferguson, Citation1996), and it spread to the West of the Mediterranean area (Falistocco, Citation2009). According to the Food and Agriculture Organization, the Mediterranean countries are the principal producers of figs. Turkey is accounting for 26.8% of the total world production. The top five producers (in addition to Turkey) include Egypt (201 709 t), Morocco (85 172 t), Algeria (81 768 t) and Iran (71 848 t) combined, supplying almost 70% of the world’s fig market (FAOSTAT, average production between 1994–2017).
Fig fruits are multiple or compound fruits that do not differ in appearance from the flowers, a specially adapted type of inflorescence called syconium (Veberic and Mikulic-Petkovsek, Citation2016). It is consumed fresh or dried and widely used for its medicinal properties (Ercisli et al., Citation2012). Figs are an important component of the balanced Mediterranean diet owing to their high nutritional value (Crisosto et al., Citation2011; Solomon et al., Citation2006). It is an important source of bioactive compounds (Ercisli et al., Citation2012; Gürbüz et al., Citation2018). They contain high concentrations of phytochemicals and antioxidant compounds that have attracted substantial interest in the past three decades. Their potential health-promoting properties are mainly related to the antioxidant capacity provided by phenolic compounds (Çalişkan and Polat, Citation2011; Sagar and Kumar, Citation2010). Numerous studies have been reported that daily and regular intake of fruits is associated with reduced risks of chronic degenerative diseases and with protection against damage by reactive oxygen species (ROS) such as cancer and cardiovascular diseases (Dewanto et al., Citation2002; Solomon, Citation2006; Boudet, Citation2007; Pan et al., Citation2019).
In Morocco, fig planting is ancestral, and has been cited in historical sources as a main fig cultivation area, and still it is (Hssaini et al., Citation2019), where a large number of typical local varieties exist. Although figs are a common fruit in the Moroccan diet, they remain underexploited, because of their short shelf-life. It has been clearly stated that exploring biodiversity based on morpho-agronomic and biochemical traits is essential to improve nutritional value, quality and productivity through breeding programs (Hoogendijk and Williams, Citation2001; Wojdyło et al., Citation2016).
There is a lack of scientific studies regarding biochemical properties and systematic information on morphological traits of different cultivars of Moroccan fig fruits.
However, there is no scientific study yet comparing morpho-agronomic and biochemical attributes among fig accessions under the Moroccan climate. In addition, this is the first report to screen morphological, peel color and antioxidant proprieties of Moroccan local fig clones and to assess their relatedness. Hence, the present study was designed to evaluate the variability among a large sample of fig cultivars (135 local clones and introduced varieties) under the same climatic conditions by assessing morphological traits and the amount of phytochemical compounds and free radical scavenging activity. In addition, this work aims to study the effectiveness of combining morpho-agronomic and biochemical markers in fig assessment and to determine correlations between all parameters in order to provide information on the descriptors that are potentially important in assessing fig genotypes.
Materials and Methods
Plant Material, Sampling and Experimental Design
The plant material consisted of 135 genotypes of which 94 are local clones and 41 are imported varieties (). These genotypes are maintained in an ex-situ collection belonging to the experimental station of the National Institute of Agricultural Research (INRA Meknes, Morocco). The genotypes were planted following a randomized complete block (RBC) design with three replicates per genotype. Samples were collected during the maturity period (June–October of 2017). Figs were considered fully ripened when the receptacle had three-fourths reddish-purple coloration and when they were easily separated from the twig. They were picked randomly at different positions around the canopy and at a height of 160 cm.
Table 1. List of fig local clones and foreign varieties included in this study.
Morpho-agronomic Assessment
Fig samples were assessed using 33 descriptors established by International Plant Genetic Resources Institute (IPGRI), 22 of which were qualitative and 11 of which were quantitative (IPGRI, Citation2003) (). Fifteen replications per sample were considered. Quantitative attributes were measured using a digital caliper (Digital Caliper 68,202, ML Tools and Equipment, Burlingame, CA). Peel color measurements were obtained from two spots located on opposite sides of the equatorial region of the fruit using a NH310 colorimeter (Shenzhen 3NH Technology, China). The mean of the two measurements was considered as one replicate. Chromatic analysis was carried out following the CIE (Commission International de l’Eclairage) system of 1976. Each sample was examined with three replications.
Table 2. List of qualitative and quantitative IPGRI Ficus carica L. descriptors and colorimetric coordinates included into morpho-agronomic analysis of fig collection.
Biochemical Analysis
Extraction Procedure
Extraction was performed according to the method previously described by Sanders et al. (Citation2000) and slightly modified by Xie and Bolling (Citation2014). First, 1 g aliquots of each powder were homogenized in 20 ml of ethanol and ultra-pure water (80:20, v/v) at 4°C for 15 min using an IKA T-18 Basic Ultra-Turrax homogenizer (IKA Werke GmbH & Co., Staufen, Germany). The homogenate was then centrifuged for 10 min at 4°C at 3000 g, and the supernatant was removed from the residue. The latter was homogenized and the supernatant removed as above, for a total of three extractions. The supernatants are then combined and filtered through Whatman No.1 filter paper.
Compound Analysis
All analyses were performed in triplicate using UV-vis spectrophotometer (Shimadzu UV-1800 Kyoto), Japan.
Total phenol content (TPC)
TPC was determined using Folin–Ciocalteu micro method (Waterhouse, Citation2002). The TP is expressed as gallic acid equivalent per dry weight of fig fruit (mg GAE/gdw).
Total Flavonoid Content (TFC)
TFC was measured using the colorimetric method with aluminum chloride (Barreira et al., Citation2008). The results were expressed as (+)-catechin equivalent per dry weight (mg CE/gdw).
Total Anthocyanin (TA)
TA content was quantified according to the pH differential method (Cheng and Breen, Citation1991) and expressed as g cyanidin-3-rutinoside equivalents per g dry weight of fruit (mg cy-3 rutinoside/gdw). Total soluble sugars were determined using phenol sulfuric acid method of Dubois et al. (Citation1956).
Total proanthocyanidins (TPAC)
was determined based on acid hydrolysis and color formation (Porter et al., Citation1985). The mixture absorbance was measured at 540 nm. Results expressed in mg cyaniding equivalent per 100 g of dw.
Total soluble sugars
Total soluble sugars were determined calorimetrically using phenol sulfuric acid method of Dubois et al. (Citation1956) with glucose solution as standard. Solutions and standards were measured at 490 nm.
Soluble solids (TSS), titrable acidity and pH
TSS was determined by extracting and mixing drops of juice from each fruit into a digital refractometer (Atago Inc.) Titrable acidity was determined by titrating fig juice with 0.1 N of NaOH. The results are expressed as % citric acid (Ranganna, Citation1986). The pH of fig juice was measured with a pH-meter (OAKTON, pH 700 series, Singapore) (AOAC 981.12).
Antioxidant Activity
The free scavenging activity was evaluated with different assays: (i) the DPPH (radical 2,2-diphenyl-1-picrylhydrazyl) method as described by Brand-Williams et al. (Citation1995), (ii) the ABTS [2,2-azinobis-(3-ethylbenzothiazoline-6-sulfonic acid)] as described by Re et al. (Citation1999) and (iii) the β-Carotene bleaching test was performed as described by Tepe et al. (Citation2006). The mixture absorbance was measured, respectively, at 515, 734 and 470 nm using a spectrophotometer (ThermoSpectronic Heγios γ, England). Results were expressed as mM trolox equivalent/g of extract.
Statistical Analysis
Since we used different measures, data were standardized (µ = 0 and a σ = 1) in order to transform all characters to a comparable scale. Data analysis was performed using SPSS v22. Thus, analysis of variance was performed to test significant differences among the samples collected. Principal component analysis was carried out using correlation matrix. A distance matrix generated from cultivar data was used for cluster analysis based on Euclidean distance using Rstudio software (version 1.0.136) to understand the patterns of variability among the cultivars.
Results and Discussion
Morpho-agronomic Assessment
Morpho-agronomic traits are summarized in . Among the two fruit shapes observed, the ‘globose’ shape was the most dominant (76%) with an index (width/length) varying from 0.91 to 1.1 (). Among all genotypes, about 21 were oblong with index values between 0.73 and 0.89. The majority (70%) of studied genotypes had a symmetric shape of fruit and did not have a drop at the eye (65%). The fig shape and its index are of great importance when it comes to local and international trade. The globose shape is preferred for its suitability for packaging and transportation (Benettayeb et al., Citation2017).
Table 3. Dominant frequencies and analysis of variance of fruit qualitative traits.
Most samples were relatively easy to peel (51%). The peel cracks were mostly abundant (72%). Similarly, the ribs on the fig peel were present (81%). Fruit peel color varied from yellow to green and purple. Green-yellow was the dominant color (46%). Half cultivars had a small cavity (52%). Pulp texture was less coarse (52%), while the predominant internal color (pulp color) was pink (45%). The majority of analyzed genotypes had a white ostiole (51%) and were little juicy (74%). Most genotypes had a medium seed size ().
All variations in the fruit geometrical characteristics were significant at p < .001 level, with exception of the ostiole diameter (). Thus, a very important range of variations was observed, especially the fruit weight with a coefficient of variation of 0.4 and an average value of 34.41 ± 14.78 g. The genotypes ‘Lmandar Noir’, ‘Bougie’, ‘Chaaba Ourgoud’, ‘Kadota’ and ‘Brown Turkey’. Similar work carried out on a large part of diversity in different countries, showed great variability in fruit weights that varied between 12,3.2 and 99,4 g in Turkey (Çalişkan and Polat, Citation2008), 24 and 58 g in Tunisia (Aljane et al., Citation2005) and from 30 to 85 g in Slovenia (Podgornik et al., Citation2010). The fruit volume ranged between 10 and 85 cm3 with an average volume of 35.17 ± 14.7 cm3. The highest values were observed with the genotypes ‘Bougie’ (80 ± 4.6 cm3) and ‘Ghoudan 2233ʹ (73.3 ± 6.6 cm3). Fruit length and width were, respectively, in the range of 21.34–48.83 mm with an average of 34 ± 5.9 and 25.93–61.58 mm with an average of 39.85 ± 7.23 mm. The recorded values are in agreement with the findings of previous works (Çalişkan and Polat, Citation2008; Gozlekci, Citation2011; Khadivi et al., Citation2018). Fruit sizes were considered as an important trait in the fig fresh consumption (Gündoğdu et al., Citation2018). Hence, small fruits are, generally, used for canning, whereas big ones are consumed as fresh. Moreover, the fruit size is an important character that reflects the proper maintenance of the tree (Aksoy et al., Citation2003). The stalk length and width ranged between 2.95 and 16.3 mm and between 2.92 and 7.96 mm, respectively. The highest size was recorded with ‘Mnedar 289ʹ and ‘Figue de Marseille’ followed by ‘Trojana’ then ‘El Ghani’. The longest fruit neck was recorded in Bioudi 2878 (9.52 mm) followed by Nardine (9.4 mm) and Kodota (9.2 mm) among the evaluated germplasm of fig. Short neck length is not suitable for the fig fruit because damages may occur due to difficulties in the harvest (Ozeker and Isfendiyaroglu, Citation1998). ().
Table 4. Range, mean, standard error and analysis of variance of quantitative morphagronomic and colorimetric attributes of fig collection.
The ostiole diameter of figs varied from 2.34 to 8.79 mm with an average of 5.13 ± 1.14 mm. The highest values were recorded in the foreign varieties ‘Grosse dame blanche’, ‘INRA 1506ʹ and ‘Bioudi 2878ʹ having of 8.79 ± 0,73 mm, 7.93 ± 0.4 mm, 7.88 ± 0.3 mm, respectively. These results are similar to those reported by Aksoy et al. (Citation2003) and Gozlekci (Citation2011). Peel thickness was in the range of 1.32 ± 0.3–8.35 ± 0.63 mm with a coefficient of variation of 0.44. It was highest in ‘Breval Blanca 2736ʹ and ‘Violette d’Agenteruil’ in which the average values were, respectively, 8.35 and 7.8 mm ().
The present study focused particularly on L*, c* and h° indices, since a* and b* are merely coordinates that indirectly reflect hue and Chroma, and were reported not independent variables (). The fig peel color showed a great variation among genotypes (p < .001). It varied from bright yellow (high lightning and Chroma values) to dark purple (negative L* values) including intermediate colors such as green–yellow, brown, red–purple, blue–purple, etc. Lightening (L*) values ranged from 16.71 (dark-colored peel) to 83.64 (light-colored peel). The genotypes ‘Palmeras’ and ‘Hamra’ had the brightest peel color (83.64 ± 5.4 and 81.52 ± 4.2, respectively). Whereas, ‘Bellone’ and ‘Ghoudan_PS1ʹ were darker and recorded the lowest values of L* (16.71 ± 1.8 and 20.43 ± 0.9 successively). The Chroma was higher in genotypes with clear and bright fruit peel color where it varied generally between 40 ± 1.5 and 63.7 ± .5.6. The lowest values in c* were recorded by genotypes having dark fruit peel color with a range of variation from 1.98 ± 1.2 to 30 ± 1. The hue angle, which is the actual color, ranged between 1.24° ±0.9° and 360° ± 10.1. About 30% of genotypes present a value of h° about 100 which is in the range of green–yellow colors. The genotypes with the highest values of L* (between 65 and 80) had the hue in the range of yellow colors (about 90°). About 15% of genotypes had the hue angle in the range of blue colors (270°) (). The results are globally in accordance with several previous studies (Rodov et al., Citation2012; Sedaghat et al. Citation2018; Viuda-Martos et al., Citation2015).
Biochemical Analysis
All fig accessions showed significant differences at 0.001 level (). Total soluble sugars were higher in local genotypes. Thus, ‘Zerqui_PS5ʹ averaged the highest value of 15.1 ± 2.62 g/100 gdw, followed by ‘ElQuoti Lbied_PS3ʹ and ‘Rhoudane 2227ʹ, which the average concentrations were, respectively, 14.53 ± 1.52 and 14 ± 1.66 g/100 gdw with an average of 12.08 ± 1.26 g/100 gdw. In general, the amounts of soluble sugars reported in fig collection are in agreement with previous works (Ercisli et al., Citation2012; Sedaghat and Rahemi, Citation2018). Total phenol content (TPC) was in a range of 25.33 (INRA 1606) and 322 mg GAE/100 gdw (‘White Adriatic’) with a global mean of 142.74 mg GAE/100 gdw. TPC is known to contribute mainly to the high antioxidant capacity in vegetables. However, in addition to sugars and organic acids, they also contribute to sweet, bitter, or astringent flavors of fruit. Moreover, they mostly influence the fruit aroma (Tomas-Barberan and Espin, Citation2001). According to the literature, TP is essentially concentrated in the fig peel, as well as other fruits including apple and apricot (Çelik et al., Citation2008; Solomon et al., Citation2006).
Table 5. Range, mean, standard error and analysis of variance of fig accessions biochemical analysis.
The highest concentrations of total flavonoid (TFC) were found in ‘White adriatic_102ʹ (103.7 ± 8.9 mg CE/100 gdw), ‘INRA 1301ʹ (101 ± 0.8 mg CE/100 gdw) and ‘INRA 1306ʹ (96,05 ± 7.04 mg CE/100 gdw). However, the lowest values were recorded by ‘Kadota’, ‘Rey blanche’ and ‘Diamna’ with an average amount of 14.6 ± 4.6, 14.5 ± 5.4 and 15.3 5 ± 5.8 mg CE/100 gdw respectively (). Flavonoids are one of the major groups of fig fruit polyphenols. They count for the largest group of plant phenolics, accounting for over half of the 8000 naturally occurring phenolic compounds (Kamiloglu et al., Citation2016; Wojdyło et al., Citation2016). Flavonoids are commonly classified as ‘‘environmental compounds’’ because they are often produced in direct response to environmental conditions (Caldwell et al., Citation2005). Total anthocyanins (TA) ranged from 0.41 to 47.95 mg cy-3-rutinoside/100 gdw with an average of 13.57 ± 10.1 g/100 gdw. The genotypes ‘INRA 2105ʹ, ‘Burjasot blanca’ and ‘INRA 1302ʹ exhibited the highest amounts of total anthocyanins where the values were, respectively, 52.95 ± 6.37; 42.57 ± 6.42 and 40.92 ± 4.67 mg/100 gdw. TA was not detected in some cultivars such as ‘Filalia 2211ʹ and ‘Trojana’. In dark figs, the amount of TA was, significantly higher than figs light-colored figs. In general, TA is particularly concentrated in the fruit peel (Del Caro and Piga, Citation2008; Solomon et al., Citation2006). Total proanthocyanidins (TPA) showed a narrower range of variation among genotypes (0.18–8.51 mg/100 gdw). ‘Mendar Noir’ (8.51 ± 1.5 mg/100 gdw) and ‘Cello dama blanca’ (6.64 ± 2.7 mg/100 gdw) exhibited the highest values. TPA was not detected in some genotypes including ‘INRA 1314ʹ and ‘Princesse’ (). In figs, proanthocyanidins are principally monomers of (epi)catechin (Pascual-Teresa et al., Citation2000). They are reported to contain TPA more than red wine and tea (Aksoy, Citation2017).
The amounts of total phenolic compounds reported above are similar to those reported in previous works (Bucić-Kojić et al., Citation2011; Çalişkan and Polat, Citation2011; Harzallah et al., Citation2016; Wojdyło et al., Citation2016); however, total phenol content (TPC) was slightly lower than those of other studies on commercial fig cultivars (Del Caro and Piga, Citation2008; Piga et al., Citation2005).
Regardless of the three methods used to assess the radical scavenging capacity, significant variability has been revealed among cultivars (p < .001). The DPPH assay ranged from 20.92 to 488.20 with an average of 180.44 ± 10.3 mM Trolox eq/100 gdw (). ‘Kahlouta’ (488.2 ± 8.5 mM Trolox eq/100 gdw), ‘INRA 2501ʹ (451.36 ± 9.4 mM Trolox eq/100 gdw) and ‘INRA 2603ʹ (433.5 ± 11.1 mM Trolox eq/100 gdw) cultivars showed the highest antioxidant potential, whereas, the cultivars ‘INRA 1314ʹ, ‘Trojana’ and ‘Noukali’ showed the lowest antioxidant capacity where the average values were 20.92 ± 5.2, 46.04 ± 5.7 and 46.6 ± 5.25 mM Trolox eq/100 gdw, respectively. Current total antioxidant capacity results were similar to those reported by Oliveira et al. (Citation2009) and Manian et al. (Citation2008).
The free radical scavenging activity determined by ABTS method also revealed a wide range of variation among genotypes [31.32–658.21 mM Trolox eq/100 gdw] with an average of 425.5 mM Trolox eq/100 gdw. The highest antioxidant capacity values were recorded by the genotypes ‘V12ʹ (658.2 ± 5.6 mM Trolox eq/100 gdw) and ‘El khal’ (632 ± 7.8 mM Trolox eq/100 gdw) (). These results are in agreement with those reported by Solomon et al. (Citation2006). Similarly, β-Carotene bleaching test results varied significantly among cultivars in a range of [73.5–824.31] with an average of (403.42 ± 8.38 mM Trolox eq/100 gdw). ‘Melissosyki’, ‘Hmidi’ and ‘El Qoti Lezreq’ showed the highest inhibition of peroxidation. Most of genotypes with the highest values of radical’s inhibition showed the high amounts of total flavonoids and anthocyanins where the values were, respectively, in the range (76–103 mgCE/100 gdw) and (28–48 mg cyanidin-3-rutinoside/100 gdw). Recent studies have further supported the ability of fig fruits to scavenge free radicals and related it to their high amounts of antioxidant compounds including flavonoids and anthocyanins (Bey et al., Citation2013; Manian et al., Citation2008; Oliveira et al., Citation2009; Solomon et al., Citation2006). Overall, compared to DPPH and ABTS free radical scavenging assays, β-Carotene bleaching test exhibited the highest radical scavenging values.
Total soluble solid content (TSS) was in the range of 8–48% with an average value of 19.26 ± 5.41%. The highest amounts of TSS were recorded by the local genotypes ‘Ounq Hmam_PS14ʹ, ‘INRA 2307ʹ and ‘INRA 1303ʹ where the average values were, respectively, 40.06 ± 7.48%, 36.46 ± 3.42%, 30.33 ± 5.48%. Titrable acidity ranged between 0.07% and 1.78% with an average of 0.76 ± 0.31%. The highest amounts of titrable acidity were found in the genotypes ‘Dottato Perguerolles’, ‘Kahoulta 2251ʹ, ‘Ghoudan_PS4ʹ (1.72 ± 0.05, 1.66 ± 0.45 and 1.64 ± 0.2, respectively). However, it was substantially low in the genotypes ‘Sebti_PS10ʹ, ‘Noukali 2254ʹ and ‘Conidria’ (0.07 ± 0.15, 0.13 ± 0.01 and 0.14 ± 0.05%, respectively) (). Gozlekci, (Citation2011), reported TSS between 13% and 29%, whereas titrable acidity ranged from 0.1% to 0.51%. Ateyyeh and Sadder (Citation2006), found that the TSS varied between 21.61% and 26.75% while the amount of citric acid was in the rage of 0.28–0.44%.
The results showed different maturity indices (TSS/Titrable acidity) that varied significantly among cultivars (). The highest indices were recorded by ‘Sebti_PS10ʹ, ‘Noukali 2254ʹ and ‘Chaari_PS15ʹ, which, respectively, averages of 219.3 ± 5.35, 138.35 ± 9,1 and 104.5 ± 9.0. In contrast, the lowest values were observed with the genotypes ‘Dottato Perguerolle’ (7.85 ± 1.57), ‘V2(b)’ (8.81 ± 0.19) and ‘Hafer Bghal’ (8.81 ± 0.41). These results are in agreement with those of Sanchez et al. (Citation2003); Çalişkan and Polat (Citation2012); Trad et al. (Citation2013); Jiménez-Gómez et al. (Citation2016). Total soluble sugar (°Brix) and acidity are usually satisfactory indices in many fruits. The variation in this index designates equilibrium between the increasing sugar concentration and decreasing titratable acidity during the ripening processes (Jayasena and Cameron, Citation2008).
Correlation between Biochemical Constituent and Morpho-agronomic Traits
The linear relations between biochemical component data (set 1), and morphological trait data (set 2) were analyzed via canonical correlation analysis (CCA). The CCA examines the maximum correlation possible between two data sets. The four reported methods are based on somewhat different theoretical frameworks. The first three were significant (p < .0001), which leads to reject the hull hypothesis. However, being the most common method used, only the Wilks’ test will be interpreted. Therefore, the study model was statistically significant with a Wilk’s λ of 0.238 (F = 103, 2880) = 4.35 and p < .0001 (). Accordingly, we can reject the null hypothesis that there was no relationship between the two variable sets and conclude that there probably was a relationship between biochemical and Morpho-agronomic variables. Furthermore, the Wilk’s λ was very small, which means that the variance shared between the two sets of variables and across all canonical functions was 1- λ = 76.2%. Therefore, the full model was both statistically significant and had what may be considered a large effect size. On the other hand, the relationship between biochemical and Morpho-agronomic markers is largely captured by the first two variates that explained 83.92% of the variance within the functions (). As a result, combining the biochemical and morphological characters was worthy, since it can provide information about the relationships between variables that are potentially important in assessing fig genotypes.
Table 6. Statistical significance tests for the full canonical correlation analysis model.
Table 7. Eigenvalues, canonical correlations and related statistics for the first three variates.
Principal Component Analysis
Principal component analysis (PCA) based on correlation coefficients was used to identify patterns of variability among the genotypes studied and to discriminate between variables in the data set (). The aim of this analysis was to define the main factors for reducing the number of effective parameters to classify the fig tree genotypes based on their physicochemical and peel color attributes. In our study, only a principal component loading of more than 0.5 was considered as being significant for each factor. Total variance of 51% was explained by six components. The first three components consisted of 19 variables, which represent more than 38% of all total variables, and explained more than 32% of the total variability observed, which means that these attributes had the highest variation between the genotypes and had the highest impact on discrimination of them (). The first component accounted for 21.6% of the total variance, which is strongly influenced by the fruit peel color (L* (0.58), c* (0.56), visual color (0.5)) and geometrical characters (weight (0.78), length (0.68), width (0.84), stalk width (0.64), neck length and width (0.65 and 0.51, respectively), ostiole width (0.51), fruit volume (0.7) and fruit shape (−0.56)). The second component accounted for 9.66% of the total inertia and is mainly influenced by Total anthocyanins (0.53) total soluble solids (−0.6), fruit peel thickness and symmetry (0.58 and 0.54, respectively) and pulp texture (−0.52). The third function represents 9.2% of the total variation which is defined essentially by stalk length and abscission (−0.51 and 0.52, respectively) and neck length (0.61). These variables were the most effective characters for discriminating and identifying the studied genotypes. In addition, these traits are economically important and can also be used as a useful tool for selecting genotypes for breeding programs or to recommend new cultivars with superior traits. The present findings were in agreement with the previously reported results in figs (Çalişkan and Polat, Citation2008; Podgornik et al., Citation2010) and caprifig (Khadivi-Khub and Anjam, Citation2014).
Table 8. Loading factor of variation in the principal components (PCs) in the studied fig genotypes. Only variables with an eigenvalue superior to 0.5 with one of each component were presented.
Cluster Analysis
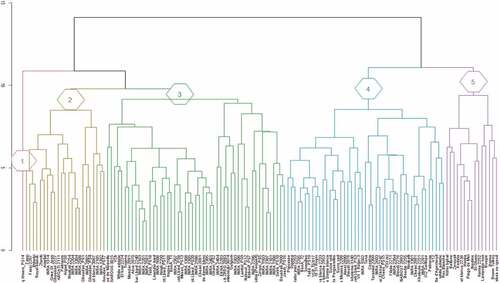
Multivariate analysis showed high polymorphism within studied fig accessions based on all evaluated variables. Unweighted pair group method (UPGMA) cluster analysis using Euclidean distance coefficient was performed to highlight the similarities and differences among the cultivars (). The latter were clustered into five main groups. The local genotype ‘Ounq Hmam PS_14ʹ was classified as a distinct group, with typical profiles. Having a dark-colored fig, this genotype exhibited the lowest fruit weight (13 g) and volume (20 cm3) with the longest neck (6.8 mm). He also recorded the highest TSS (47.5%). The second group included 24 cultivars characterized by dark-colored figs with low peel color intensity (c*), intermediate fruit weight, ease of peeling and symmetric form. They also exhibited important amounts of total anthocyanins. This group clustered all clones denominated ‘Ghoudan’ and ‘Fassi’ that are widely cultivated in Moroccan traditional orchards. The third group consisted of 51 cultivars. These genotypes had light-colored figs with high amounts of total flavonoids and important stalk sizes. However, they showed low levels of sugars and no fruit neck. The fourth cluster included 45 accessions characterized with light-colored figs (high values of L* and c*) with important geometrical traits, particularly fruit weight. In contrast, they had low amounts of sugars, anthocyanins, and flavonoids. The last group consisted of 15 light-colored fig cultivars with the heaviest fruits. They also showed important fig geometrical characters and exhibited intermediate amounts of sugars, flavonoids, anthocyanins and free radical scavenging capacity (ABTS and Linoleic acid peroxidation inhibition).
Figure 1. Cluster analysis of the studied fig genotypes based on the Morpho-agronomic and Biochemical attributes using Euclidean distance. Discriminated clusters were specified by typical numbers.
The results showed that the studied fig germplasm has a high phenotypic variation. Because the genotypes were planted in the collection under the same edapho-climatic condition and agricultural practices, the observed variation is probably more related to their genetics. Ideally, this study should be performed for several years in order to assess the impact of the climate on Morpho-agronomic and biochemical attributes of this collection. Phenotypic assessment is always needed and it should be included in any program of conservation and use of genetic resources (Giraldo et al., Citation2010).
Conclusion
There are not many exhaustive works emphasizing the fig diversity (Ficus carica L.) by using multivariate analysis of large sample length cultivars in Morocco. The present work is the first report on fig germplasm assessment in Morocco using a mixture of morpho-agronomic and biochemical traits. Using 49 descriptors, the results showed high amounts of variability among all genotypes. The genotypes ‘Lmandar Noir’, ‘Bougie’,’Chaab Ourgoud’ and ‘Kadota’ showed the most important fruit geometrical traits. Whereas, the genotypes ‘INRA 2105ʹ, ‘White Adriatic’,’ Brown Turkey’ and ‘Cuello Dama Blanca’ exhibited the most promising biochemical attributes. Geometrical traits, chromatic coordinates, total sugars, and anthocyanin content were the most discriminant variables in cultivar assessment. These descriptors captured a high level of a total variance within cultivars. Furthermore, the canonical correlation between the two set of variables was statistically significant with about 1- λ = 98.4% of shared variance. Therefore, combining the two analyses may have a large size effect in fig germplasm assessment. Therefore, they can be suggested as a powerful approach in fig selection. Finally, this work is a significant contribution to the selection of highly discriminant variables to optimize resources for a multivariate assessment of fig germplasm. The findings have important implications for fig collection management in order to maintain longevity and diversity of the species and will facilitate its use in breeding programs.
Authors contribution
Lahcen Hssaini designed the methodology of the research, analyzed samples, performed the statistical analysis and interpreted the data. Jamal Charafi and Hafida Hanine helped in the methodology and provided the technical support for designing and conducting research. Ibtissam Guirrou and Abderrahman Mekaoui contributed to plant sampling and analysis. Rachid Razouk and Said Ennahli performed the review and Lahcen Hssaini wrote the manuscript.
Declaration of Interest
Declare conflicts of interest or state “The authors declare no conflict of interest”.
Acknowledgments
This work was financed by Competitive Mechanism of Research-Development and Extension (MCRDV) program founded by the Ministry of Agriculture, Fisheries, Rural Development, Water and Forests of Morocco.
References
- Aksoy, U. 2017. The dried fig management and the potential for new products. Acta Hortic. 1173: 377–382. doi: 10.17660/Acta Hortic.2017.1173.65. doi:10.17660/ActaHortic.2017.1173.65.
- Aksoy, U., H.Z. Can, A. Misirli, S. Kara, G. Seferoglu, and N. Sahin. 2003. Fig (Ficus carica L.) selection study for fresh market in Western Turkey. Acta Hortic. 605:197–203. doi: 10.17660/ActaHortic.2003.605.29.
- Aljane, F., A. Ferchichi, and M Boukhris. 2005. Pomological characteristics of local fig (ficus carica) cultivars in southern tunisia. Acta Hortic 798:123–128.
- Anonymous. 2003. IPGRI, “Descriptors for Fig (Ficus carica L.),” International plant genetic resources institute (IPGRRI), Rome, Italy and International Center for Advanced Mediterranean Agronomic Studies (CIHEAM), Paris, 52 p.
- Ateyyeh, A.F., and M.T. Sadder. 2006. Growth pattern and fruit characteristics of six common fig (Ficus carica L.) cultivars. Jordan. Jordan J. Agric. Sci. 2(2):105–112.
- Barreira, J.C., I.C. Ferreira, M. Oliveira, and J.A. Pereira. 2008. Antioxidant activities of the extracts from chestnut flower leaf skins and fruit. Food Chem. 107:1106–1113. doi: 10.1016/j.foodchem.2007.09.030.
- Benettayeb, Z.E., M. Bencheikh, B. Setti, and S. Chaillou. 2017. Genetic diversity of Algerian fig (Ficus carica L.) cultivars based on morphological and quality traits. Hortic. Soc. India 74(3):311–316. doi: 10.5958/0974-0112.2017.00064.0.
- Bey, M.B., H. Louaileche, and S. Zemouri. 2013. Optimization of phenolic compound recovery and antioxidant activity of light and dark dried fig (Ficus carica L.) varieties. Food Sci. Biotechnol. 22(6):1613–1619. doi: 10.1007/s10068-013-0258-7.
- Boudet, A.M. 2007. Evolution and current status of research in phenolic compounds. Phytochemistry 68(22–24):2722–2735. doi: 10.1016/j.phytochem.2007.06.012.
- Brand-Williams, W., M.E. Cuvelier, and C. Berset. 1995. Use of a free radical method to evaluate antioxidant activity. Food Sci. Technol. 28:25–30.
- Bucić-Kojić, A., M. Planinić, S. Tomas, S. Jokić, I. Mujić, M. Bilić, and D. Velić. 2011. Effect of extraction conditions on the extractability of phenolic compounds from lyophilised fig fruits (Ficus carica L.). Pol. J. Food Nutr. Sci. 61(3):195–199. doi: 10.2478/v10222-011-0021-9.
- Caldwell, C.R., S.J. Britz, and R.M. Mirecki. 2005. Effect of temperature, elevated carbon dioxide, and drought during seed development on the isoflavone content of dwarf soybean [Glycine max (L.) Merrill] grown in controlled environments. J. Agric. Food Chem. 53(4):1125–1129. doi: 10.1021/jf0355351.
- Çalişkan, O., and A.A. Polat. 2008. Fruit characteristics of fig cultivars and genotypes grown in Turkey. Sci. Hortic. 115(4):360–367. doi: 10.1016/j.scienta.2007.10.017.
- Çelik, H., M. Özgen, S. Serçe, and C. Kaya. 2008. Phytochemical accumulation and antioxidant capacity at four maturity stages of cranberry fruit. Sci. Hortic. 117(4):345–348. doi: 10.1016/j.scienta.2008.05.005.
- Çalişkan, O., and A.A. Polat. 2011. Phytochemical and antioxidant properties of selected fig (Ficus carica L.) accessions from the eastern Mediterranean region of Turkey. Sci. Hortic. 128(4):473–478. doi: 10.1016/j.scienta.2011.02.023.
- Çalişkan, O., and A.A. Polat. 2012. Morphological diversity among fig (Ficus carica L.) accessions sampled from the Eastern Mediterranean Region of Turkey. Turk. J. Agric. For. 36(2):179–193.
- Cheng, G.W., and P.J. Breen. 1991. Activity of phenylalanine ammonia-lyase (PAL) and concentrations of anthocyanins and phenolics in developing strawberry fruit. J. Am. Soc. Hortic. Sci. 116:865–869. doi: 10.21273/JASHS.116.5.865.
- Crisosto, C.H., L. Ferguson, and V. Bremer. 2011. Fig (Ficus carica L.). In: E.E. Yahia (ed.). Posharvest biology and technology of tropical and subtropical fruits. Cambridge, UK. pp. 134–158.
- Del Caro, A., and A. Piga. 2008. Polyphenol composition of peel and pulp of two Italian fresh fig fruits cultivars (Ficus carica L.). Eur. Food Res. Technol. 226(4):715–719. doi: 10.1007/s00217-007-0581-4.
- Dewanto, V., X. Wu, K.K. Adom, and R.H. Liu. 2002. Thermal processing enhances the nutritional value of tomatoes by increasing total antioxidant activity. J. Agric. Food Chem. 50(10):3010–3014. doi: 10.1021/jf0115589.
- Dubois, M., K.A. Gilles, J.K. Hamilton, P.A. Rebers, and F. Smith. 1956. Colorimetric method for determination of sugars and related substances. Anal. Chem. 28:350–356. doi: 10.1021/ac60111a017.
- Ercisli, S., M. Tosun, H. Karlidag, A. Dzubur, S. Hadziabulic, and Y. Aliman. 2012. Color and antioxidant characteristics of some fresh fig (Ficus carica L.) genotypes from northeastern Turkey. Plant Foods Hum. Nutr. 67(3):271–276. doi: 10.1007/s11130-012-0292-2.
- Falistocco, E. 2009. Presence of triploid cytotypes in the common fig (Ficus carica L.). Genome 52(11):919–925. doi: 10.1139/G09-068.
- Giraldo, E., M. López-Corrales, and J.I. Hormaza. 2010. Selection of the most discriminating morphological qualitative variables for characterization of fig germplasm. J. Am. Soc. Hortic. Sci. 135(3):240–249. doi: 10.21273/JASHS.135.3.240.
- Gozlekci, S. 2011. Pomological traits of fig (Ficus carica L) genotypes collected in the west Mediterranean region in Turkey. J. Anim Plant Sci. 21(4):646–652.
- Gündoğdu, M., S. Ercisli, I. Canan, E. Orman, M. Sameeullah, M. Naeem, and R.B. Ayed. 2018. Diversity in phenolic compounds, biochemical and pomological characteristics of Arbutus unedo fruits. Folia Hortic. 30(1):139–146. doi: 10.2478/fhort-2018-0014.
- Gürbüz, N., S. Uluişik, A. Frary, A. Frary, and S. Doğanlar. 2018. Health benefits and bioactive compounds of eggplant. Food Chem. 268:602–610. doi: 10.1016/j.foodchem.2018.06.093.
- Harzallah, A., A.M. Bhouri, Z. Amri, H. Soltana, and M. Hammami. 2016. Phytochemical content and antioxidant activity of different fruit parts juices of three figs (Ficus carica L.) varieties grown in Tunisia. Ind. Crops Prod. 83:255–267. doi: 10.1016/j.indcrop.2015.12.043.
- Hirst, K., 1996. Fig trees and archaeology. The history of the domestication of fig trees. About.com Archaeology. http://archaeology.about.com/od/domestications/a/fig trees.htm.
- Hoogendijk, M., and D.E. Williams. 2001. Characterizing the genetic diversity of home garden crops: Some examples from the Americas, p.34–40. In: J.W. Watson and P.B. Eyzaguirre (Eds.), Home gardens and in situ conservation of plant genetic resources in farming systems, IPGRI: Proceedings of the Second International Home Gardens Workshop. Witzenhausen, Germany.
- Hssaini, L., H. Hanine, R. Razouk, S. Ennahli, A. Mekaoui, and J. Charafi. 2019. Characterization of local fig clones (Ficus carica L.) collected in Northern Morocco. Fruits 74(2):55–64. doi: 10.17660/th2019/74.2.1.
- Jayasena, V., and I. Cameron. 2008. °Brix/acid ratio as a predictor of consumer acceptability of Crimson Seedless table grapes. J. Food Qual. 31(6):736–750. doi: 10.1111/jfq.2008.31.issue-6.
- Jiménez-Gómez, C.P., J.A. Cecilia, D. Durán-Martín, R. Moreno-Tost, J. Santamaría-González, J. Mérida-Robles, R. Mariscal, and P. Maireles-Torres. 2016. Gas-phase hydrogenation of furfural to furfuryl alcohol over Cu/ZnO catalysts. J. Catal. 336:107–115. doi: 10.1016/j.jcat.2016.01.012.
- Kamiloglu, S., G. Toydemir, D. Boyacioglu, J. Beekwilder, R.D. Hall, and E. Capanoglu. 2016. A review on the effect of drying on antioxidant potential of fruits and vegetables. Crit. Rev. Food Sci. Nutr. 56(sup1):S110–S129. doi: 10.1080/10408398.2015.1045969.
- Khadivi, A., R. Anjam, and K. Anjam. 2018. Morphological and pomological characterization of edible fig (Ficus carica L.) to select the superior trees. Sci. Hortic. 238:66–74. doi: 10.1016/j.scienta.2018.04.031.
- Khadivi-Khub, A., and K. Anjam. 2014. Characterization and evaluation of male fig (caprifig) accessions in Iran. Plant Syst. Evol. 300(10):2177–2189. doi: 10.1007/s00606-014-1038-4.
- Manian, R., N. Anusuya, P. Siddhuraju, and S. Manian. 2008. The antioxidant activity and free radical scavenging potential of two different solvent extracts of Camellia sinensis (L.) O. Kuntz, Ficus bengalensis L. and Ficus racemosa L. Food Chem. 107(3):1000–1007. doi: 10.1016/j.foodchem.2007.09.008.
- Oliveira, A.P., P. Valentão, J.A. Pereira, B.M. Silva, F. Tavares, and P.B. Andrade. 2009. Ficus carica L.: Metabolic and biological screening. Food Chem. Toxicol. 47:2841–2846. doi: 10.1016/j.fct.2009.09.004.
- Ozeker, E., and M. Isfendiyaroglu. 1998. Evaluation of table fig cultivars in Cesme peninsula. Acta Hortic. 480:55–60. doi: 10.17660/ActaHortic.1998.480.7.
- Pan, Y., Y. Wang, X. Fan, W. Wang, X. Yang, D. Cui, and M. Zhao. 2019. Bacterial intracellular nanoparticles exhibiting antioxidant properties and the significance of their formation in ROS detoxification. Environ. Microbiol. Rep. 11(2):140–146. doi: 10.1111/emi4.2019.11.issue-2.
- Pascual-Teresa, S., C. Santos-Buelga, and J.C. Rivas-Gonzalo. 2000. Quantitative analysis of flavan-3-ols in Spanish foodstuffs and beverages. J. Agric. Food Chem. 48(11):5331–5337. doi: 10.1021/jf000549h.
- Piga, A., A. Del Caro, G. Milella, I. Pinna, V. Vacc, and S. Schirru. 2005. HPLC analysis of polyphenols in peel and pulp of fresh figs. Acta. Hort. 798:301–306.
- Podgornik, M., I. Vuk, I. Vrhovnik, and D.B. Mavsar. 2010. A survey and morphological evaluation of fig (Ficus carica L.) genetic resources from Slovenia. Sci. Hortic. 125(3):380–389. doi: 10.1016/j.scienta.2010.04.030.
- Porter, L.J., L.N. Hrstich, and B.G. Chan. 1985. The conversion of procyanidins and prodelphinidins to cyanidin and delphinidin. Phytochemistry. 25:223–230. doi: 10.1016/S0031-9422(00)94533-3.
- Pourghayoumi, M., D. Bakhshi, M. Rahemi, A. Noroozisharaf, M. Jafari, M. Salehi, R. Chamane, and F. Ranganna. 1986. Hand book of analysis and quality control for fruits and veg- etables. 2nd ed. Tata Mc Graw Hill Publishing Co. Ltd., New Delhi.
- Ranganna, S. 1986. Handbook of analysis and quality control for fruit and vegetable products. 2nd ed. Mc-Graw Hill Publishing Co. Tata, New Delhi.
- Re, R., N. Pellegrini, A. Proteggente, A. Pannala, M. Yang, and C. Rice-Evans. 1999. Antioxidant activity applying an improved ABTS radical cation decolorization assay. Free Radic. Biol. Med. 26(9–10):1231–1237. doi: 10.1016/S0891-5849(98)00315-3.
- Rodov, V., Y. Vinokur, and B. Horev. 2012. Brief postharvest exposure to pulsed light stimulates coloration and anthocyanin accumulation in fig fruit (Ficus carica L.). Postharvest Biol. Tec. 68:43–46. doi: 10.1016/j.postharvbio.2012.02.001.
- Sagar, V.R., and P.S. Kumar. 2010. Recent advances in drying and dehydration of fruits and vegetables: A review. J. Food Sci. Technol. 47(1):15–26. doi: 10.1007/s13197-010-0010-8.
- Sanchez, M.J., P. Melgarejo, F. Hernandez, and J.J. Martinez. 2003. Chemical and morphological characterization of four fig tree cultivars (Ficus carica L.) grown under similar culture conditions. Acta Hortic. (605): 33–36. doi: 10.17660/ActaHortic.2003.605.3.
- Sanders, T.H., R.W. McMichael, and K.W. Hendrix. 2000. Occurrence of resveratrol in edible peanuts. J. Agric. Food Chem. 48:1243–1246. doi: 10.1021/jf990737b.
- Sedaghat, S., and M. Rahemi. 2018. Effects of physio-chemical changes during fruit development on nutritional quality of fig (Ficus carica L. var.‘Sabz’) under rain-fed condition. Sci. Hortic. 237:44–50. doi: 10.1016/j.scienta.2018.04.003.
- Sherry, A., and R. K Henson. 2005. Conducting and interpreting canonical correlation analysis in personality research: A user-friendly primer. j. Pers. Assess 84(1):37–48.
- Solomon, A., S. Golubowicz, Z. Yablowicz, S. Grossman, M. Bergman, H.E. Gottlieb, A. Altman, Z. Kerem, and M.A. Flaishman. 2006. Antioxidant activities and anthocyanin content of fresh fruits of common fig (Ficus carica L.). J. Agric. Food Chem. 54:7717–7723. doi: 10.1021/jf060497h.
- Tepe, B., M. Sokmen, H.A. Akpulat, and A. Sokmen. 2006. Screening of the antioxidant potentials of six Salvia species from Turkey. Food Chem. 95:200–204. doi: 10.1016/j.foodchem.2004.12.031.
- Tomas-Barberan, F.A., and J.C. Espin. 2001. Phenolic compounds and related enzymes as determinants of quality in fruits and vegetables. J. Sci. Food Agric. 81:853–876. doi: 10.1002/jsfa.v81:9.
- Tous, J., and L. Ferguson. 1996. Mediterranean fruits, p. 416–430. In: J. JANICK (ed.). Progress in new crops. ASHS Press, Arlington, USA.
- Trad, M., B. Gaaliche, C.M.G. Renard, and M. Mars. 2013. Plant natural resources and fruit characteristics of fig (Ficus carica L.) change from coastal to continental areas of Tunisia. J. Agric. Res. Dev. 3(2):022–025.
- Valdeyron, G., and D. G. Lloyd. 1979. Sex differences and flowering phenology in the common fig, ficus carica l. Evolution. 673–685.
- Veberic, R., and M. Mikulic-Petkovsek. 2016. Phytochemical composition of common fig (Ficus carica L.) cultivars. Nutr. Compos. Fruit Cultiv. 235–255. Academic Press. https://doi.org/10.1016/B978-0-12-408117-8.00011-8
- Viuda-Martos, M., X. Barber, J.A. Perez-Alvarez, and J. Fernandez-Lopez. 2015. Assessment of chemical, physico-chemical, techno-functional and antioxidant properties of fig (Ficuscarica L.) powder co-products. Ind. Crops Prod. 69:472–479. doi: 10.1016/j.indcrop.2015.03.005.
- Waterhouse, A. L. 2002. Polyphenolics: determination of total phenolics. In R. E. Wrolstad (Ed.), Current protocols in food analytical chemistry. New York: John Wiley & Sons.
- Wojdyło, A., P. Nowicka, A.A. Carbonell-Barrachina, and F. Hernández. 2016. Phenolic compounds, antioxidant and antidiabetic activity of different cultivars of Ficus carica L. fruits. J. Funct. Foods. 25:421–432. doi: 10.1016/j.jff.2016.06.015.
- Xie, L., and B.W. Bolling. 2014. Characterisation of stilbenes in California almonds (Prunus dulcis) by UHPLC–MS. Food Chem. 148:300–306. doi: 10.1016/j.foodchem.2013.10.057.