
 ?Mathematical formulae have been encoded as MathML and are displayed in this HTML version using MathJax in order to improve their display. Uncheck the box to turn MathJax off. This feature requires Javascript. Click on a formula to zoom.
ABSTRACT
The objectives of this study were to compare variable rate and uniform fertilizer applications in apple (Malus domestica Borkh.) and its effect on production and economic return. In the study, 59.6% and 63.4% less fertilizer were applied in the variable rate treatments (VRT) in 2011 and 2012, respectively, with less than 4% difference in yield. Soil properties did not significantly affect yield and fruit quality. The VRT fertilizer cost was reduced by 2.3% and 7.6% in 2011 and 2012, respectively, and fruit quality was not significantly affected. Assessing yield to calculate fertilizer demand suggests variable rate fertilizer inputs can potentially increase the profitability of an apple orchard.
Introduction
Apples (Malus domestica Borkh.) are an important crop to Greece. The annual yield averaged 2340 kg ha−1 from 2014 to 2016 and was ranked as the seventh-largest producing tree fruiting crop (FAO, Citation2018). The main producing regions of apple in Greece are in Macedonia (Kastoria, Kozani, Pella, and Imathia) and Thessaly (Magnesia and Larissa). An estimated 53% of production is red apple varieties (predominantly ‘Red Delicious’) with 15% in green apple varieties (commonly ‘Granny Smith’) and the remaining orchards are planted in various varieties both traditional and new cultivars (USDA FAS, Citation2018).
Apples are a temperate deciduous tree that requires seasonal temperature fluctuation to ensure a successful fruiting cycle. Establishing an apple orchard requires matching the variety to the site and planting the trees for ease of access to manage farm operations (cultivating, mowing, fertilizing, pruning, pest management, and harvest). Prior knowledge of the site will mediate any potential issues to establishment, e.g. re-plant disorder, any residual herbicides, and soil-borne diseases. Once established, apple will need a regiment of care that is managed throughout the seasons where precise agricultural management can be applied. One area that has great potential for adoption is fertilization. Traditionally, growers tend to apply a uniformed amount of fertilizer to the orchard without regard to spatial differences in production. These differences are usually noted in plant vigor and yield, which may be a response to the heterogeneity of the soils. A lack of awareness to field spatial variability can lead to inefficiencies in applications of inputs leading to higher management cost and increased environmental impact (Pierce and Nowak., Citation1999).
Precision Agriculture (PA) is a management tool that utilizes technologies to improve production by using site-specific management practices (SSM). The SSM practices are based on the acquisition of data by recording inputs and site characteristics (e.g. fertilizer, pesticides, pruning, labor, and soils) and comparing the inputs to the results (yield and return on investment). Optimally, PA identifies areas of good and poor production, then applying SSM to improve weak production areas and optimize inputs to profitable areas of the orchard. The potential outcome should be increased yields, reduced inputs, and lower environmental impact (Basso et al., Citation2012; Robert, Citation2002, Robertson and Goffman, Citation2007). Once an orchard has been evaluated and orchard variability identified based on site characteristics (soils, weather, farming practices), the grower will need an approach to implement a fertilization program. Papadopoulos et al. (Citation2011) developed a decision support system (DSS) for crop nitrogen (N) fertilization based on soil, weather, and farming practices using expert experiences and annotating scientific and technical resources to develop a set of logic methodologies through ‘fuzzy theory’. The inputs and calculations were robust for fuzzy theory N fertilization and were used to develop an N balance output for cotton grown in Greece (Papadopoulos et al., Citation2011); however, this DSS is restrictive due to complexity and would be generally used by agronomists and extension agents. In a more simplistic model, rice fertilizer recommendations were based on yield response, agronomic efficiency, relative yield (ratio of yield based on relationship to N-P-K and total N-P-K), and soil nutrient supply (Xu et al., Citation2017), which has been developed into a DSS called Nutrient Expert for Rice for Chinese rice growers.
For precision agricultural methods to be adopted, there must be an economical benefit and ease of data collection for the grower. Much of the SSM has been focused on annual cropping systems, e.g. wheat (Lyle et al., Citation2013), soybean (Maestrini and Basso, Citation2018), and corn (Phillps and Majumdar, Citation2017). Where spatial analysis using global positioning systems (GPS) has been applied over large areas to collect data during routine farming with tractor-mounted GPS. Perennial crop management, e.g. tree fruits, small fruits, and vineyards are usually sold as fresh market fruit and are generally hand-harvested to preserve quality. Hand harvesting can be challenging to identify spatial variation in yield due to multiple harvests and labors moving fruit to a central location for processing. For tree fruit crops that are processed, harvest may be mechanized and done during a single harvest, e.g. olive, orange, and wine grape and PA may be feasible (Fountas et al., Citation2011; Lee and Ehsani, Citation2015; Santesteban et al., Citation2013). As an example, Fountas et al. (Citation2011) observed significant spatial variation in soil characteristics (nutrients, pH, and penetration resistance) between no-till and cultivated ground in a Greek commercial olive orchard. Through this work, areas in the orchard were demarcated, mapped, and a variable rate fertilization (VRF) recommendation was produced based on the data input (soil nutrient levels, soil pH, and yield). However, due to olive having extreme biennial bearing it was difficult to determine the effectiveness of VRF on yield.
Though VRF was not conclusively shown to be effective in olive (Fountas et al., Citation2011), there are other studies that demonstrate the benefit of VRF in other cropping systems. Cropping sorghum in Texas over two seasons demonstrated that applying a variable rate of N and phosphorus (P) fertilizers increased production by 369 kg ha−1 and reduced cost by $25 ha−1 (USD) when compared to uniform fertilizer applications (Yang et al., Citation2001). In Iowa, variable rate P was assessed in corn-soybean rotation over two seasons where yields were comparable between treatments with 12% to 41% less P being applied to the variable rate treatments (Wittry and Mallarino, Citation2004). An Indiana study comparing SSM and uniform P and potassium (K) applications to maize, soybean, and wheat crops demonstrated that soil type influenced returns and risk aversion should be predicated on soil mapping (Lowenberg-DeBoer and Aghib, Citation1999). For oranges grown in Brazil, spatial analysis of soil characteristic within the orchard demonstrated soil pH was closely associated to yield and optimizing soil pH could increase yield (Costa et al., Citation2014). Associating yield to characteristics like leaf and soil mineral nutrients and correlating that specific characteristic to an SSM input can be essential for PA adoption in orchard management.
All macronutrients (N, P, K, Ca, Mg, S) and micronutrients (B, Mn, Cu, Zn, Fe, Mo) are necessary for the required yield and quality of apples (Bennewitz Alvarez et al., Citation2011, Citation2017). Nitrogen is an essential macronutrient for developing a nutrient management program. Most perennial crop recommendations for N are based on a uniform application per unit area by the amount of N that is removed from the orchard through harvest, pruning, and leaf drop (IFA, Citation1992) or as an annual recommendation based on orchard age (Righetti et al., Citation1998). The amount of N applied to apple trees can affect flower bud formation, tree growth, yield, and fruit quality, especially fruit size and color (Fallahi et al., Citation1997, Citation2001; Neilsen and Neilsen, Citation2002; Raese et al., Citation2007; Bennewitz Alvarez et al., Citation2015). Thus, farmers must be careful with the N rates. High N rate invigorates growth (Huett, Citation1996; Weinbaum et al., Citation1992) and increases fruit weight but may decrease storability (El-Gazzar, Citation2000; Gosh et al., Citation2004; Hansen, Citation1980). Low rates of N can decrease yield and fruit size while causing greater extremes in alternate bearing fruit production, whereas optimal N rates produce high-quality fruit (Marsh et al., Citation1996) and improve storability (Tahir et al., Citation2007).
Managing orchards based on VRF is sparingly applied. This could be due to the complexity of developing an SSM map, the expense to collect data, and determining the appropriate data to stylize the variable rate. Concomitantly, studying tree fruit crops where biennial bearing is not managed (Fountas et al., Citation2011) and in crops susceptible to decline based on disease, e.g. orange (Schumann, Citation2010), the efficacy of VRF can be difficult to determine. Studies have used leaf tissue mineral analysis (Lopez-Granados et al., Citation2004) and soil nutrients (Zaman and Schuman, Citation2006) to develop management zones for VRF, which was effective in apple (Aggelopoulou et al., Citation2010) and pear (Vatsanidou et al., Citation2017). Apple and pear orchards are usually managed to minimize the effect of biennial bearing through winter pruning and crop thinning (Westwood, Citation1993), of which yield then can be used as an estimator for the efficacy of a VRF program. Vatsanidou et al. (Citation2017) developed a VRF program by replacing N that was removed by fruit harvest. Aggelopoulou et al. (Citation2010) evaluated apple orchard soils and determined that VRF could reduce fertilizer inputs but they suggested crop quality and yield needed further investigation.
Fertilization of apple using PA and applying VRF is poorly understood and there is an opportunity to study the efficacy of VRF. Thus, in a Greek commercial apple orchard, a variable rate fertilizer trial was conducted from 2010 to 2012 with the objectives of (1) evaluating a mathematical formula, using yield as the variable, to establish a VRF recommendation by zone and compare the calculated rates to uniform fertilization, (2) make comparisons of fruit quality between fertilization treatments, (3) evaluate site characteristics effects on fertilization treatments, and (4) create profit maps for financial analysis of the fertilization treatments.
Material and Methods
Experimental Site
Fertilization treatments were applied to an apple orchard located in Agia, Thessaly region, Central Greece (22º 44΄00.33΄΄E, 39º39΄55΄΄N, elevation 96 m). The orchard was planted in 2004 with ‘Granny Smith’ using ‘Red Delicious’ as a pollinator, all scions were grafted to MM106 as the rootstock. The orchard was 2.7 ha without elevation differences. It was planted at a spacing of 4 m between the rows and 1 m within the rows, making 10,000 trees ha−1. Pollinators were interspersed at a density of 1,250 trees ha−1 or every eighth tree. The orchard was managed conventionally, was drip irrigated (5 m3 ha−1 of irrigation per growing season including rain), weed-free strip maintained beneath the trees and row middles were cover cropped with natural vegetation and mowed, and traditionally fertilized at a uniformed rate once annually in late winter. Winter pruning and spring crop thinning (at ~10 mm fruitlet size) were performed annually to minimize biennial bearing response and improve fruit quality. The trials commenced in 2010 and ended in 2012.
Measurements
Weather Data
Weather data were requested from Hellenic National Meteorological Services (HNWS, Citation2018) for the Agia region. Daily relative humidity (RH), temperature (T), and precipitation for the 3 years of research were averaged on a 5-day basis from 1 Apr. to 15 May to show conditions during bloom and fruit set ().
Table 1. Weather data for 2010, 2011, and 2012 from 1 Apr. to 15 May. Measurements were averaged every 5 days
Yield Mapping
Harvest was by hand. In the orchard, rows were delineated into 20 m sections with flagging and labors placed apples in 20 kg bins marked for each section. A weight was collected of the fruit harvested within each section. Geographical positions were recorded from the middle of each section using a handheld global positioning system receiver (Garmin Etrex Legend H, Olathe, KS). The data were imported to ArcGIS 10.2 (ESRI 2013, Redlands, CA) software. Using ArcGIS, grids of 20 m × 4 m were designed into layers for mapping data. Harvests occurred on 12 Oct. 2010, 7 Nov. 2011, and 4 Nov. 2012. The 2010 harvest was used to establish a variable fertilizer rate, where the 2011 and 2012 harvests were to compare the variable rate to uniform applications of fertilizer.
Soil Properties
Identifying variability in the orchard and correlating that variability to yield is important to establish an SSM prescription. Thus, soil electrical conductivity (EC), texture (% sand, % silt, and % clay), and chemical composition (phosphorous: P; potassium: K; calcium carbonate: CaCO3; pH; and organic matter: OM) were analyzed. Soil EC was measured to a depth of 37.5 cm using an EM38 soil exploration instrument (EM38 RT, Geonics LTD, Ontario, Canada). The EM38 was designed as a nondestructive ground-penetrating induction soil salinity meter that can log data spatially when coupled with a DGPS (Differential-GPS 106, Trimble Inc., Sunnyvale, CA, USA) receiver. As the EC readings were collected, the data were simultaneously loaded into an Allegro CX (Juniper Systems Inc., Logan, UT, USA) at 1-s intervals. The data were later imported into ArcGIS software for the development of geospatial layers, as were all the soil analyses. Because the EM38 measures apparent conductivity in millisiemens per meter (mS/m), soil electrical conductivity will be noted as apparent electrical conductivity (ECa). The data were reported as vertical dipole readings.
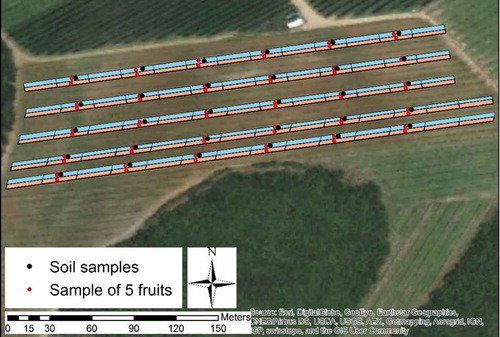
Within the orchard, the midpoint of the 20 m section, underneath the drip lines, and before annual fertilization, soil sampling was conducted in 2010 at 30 samples total to an average depth of 30 cm per sample (). The top 2.5 cm of soil was removed prior to sampling. This practice minimizes any significant affects on the analyses from the introduction of large rocks, organic material, or fertilizer into the matrix. The samples were allowed to air dry then passed through 2 mm sieve. The sieved soil was then partitioned and analyzed for soil texture (Bouyoucos, Citation1951) and chemical properties as mentioned previously. Soil texture was determined by evaluating the particle size of a known mass of dried soil dispersed in a column of water where the density of the suspension was measured at predetermined intervals using a Bouyoucos hydrometer. Soil pH was measured in a suspended 1:1 solution of soil and distilled water with a pH meter (Hanna Instruments, HI 9024 Microcomputer pH meter, Woonsocket, Rhode Island, USA). The initial pH of the distilled water was buffered to 7.0 pH and the solution was allowed to equilibrate for an hour prior to analysis (Grewelling and Peech, Citation1965; McLean, Citation1982). Organic matter (OM) was determined by oxidation reaction of the organic material then measuring the degree of reduction in soil, i.e. Walkey-Black method (Jackson, Citation1958; Sparks et al., Citation1996). Phosphorous was measured by the sodium carbonate extraction method (Olsen et al., Citation1954). Potassium was measured using the ammonium acetate method (Page et al., Citation1982) and CaCO3 was measured with Bernard method (Duchaufour, Citation1960). All sampling occurred in February 2011 before fertilization and after the soil profile had received sufficient precipitation (>1.5 cm within 5 days of sampling).
Figure 1. Fruit sample (red dots) and soil samples (black dots), within the 20-m sections where fertilizer applied uniformly (orange areas) and in variable rates (blue areas) in the orchard
Application of Fertilizers
Variable rate fertilization was calculated from yield collected the previous year. According to the International Fertilizer Association, 110.5 kg ha−1 N must be applied for every 44.8 t ha−1 yield (IFA, Citation1992) to account for pruning, fruit and leaf tissue loss plus an assumption of 20% to account for runoff and leaching (Neilsen and Neilsen, Citation2002). Equations were developed to determine the VRF based on the appropriate amount of N. VRF EquationEquations (1)(1)
(1) and (Equation2
(2)
(2) ) are as shown:
where F1: fertilizer in kg ha−1
Y: Recorded yield in t ha−1 last year
where F1 = fertilizer in kg ha−1
F2 = the final amount of fertilizer (including 20% added fertilizer) in kg ha−1
The study orchard had 25 rows for observation of which 13 rows were treated with VRF and 12 rows with uniform fertilizer rate (control). The control fertilization in 2011 was 137.5 kg N ha−1 and in 2012 105.0 kg N ha−1 as 11-15-15 N-P-K and 12-11-18 N-P-K, respectively. The grower chose the uniform rates. The variable rate applications were calculated and accurately weighed then applied by hand within the treatments.
Fruit Quality Mapping
Prior to yield harvest, commercially ripe ‘Granny Smith’ apples were collected from 60 georeferenced positions (20 m × 24 m grid) from within the fertilization treatments (30 uniform and 30 VRF treatments). From each position, five fruits were harvested. The harvested fruits were randomly selected from within the treatment; however, they were selected for fresh market quality. Damaged, diseased, small, and deformed fruits were omitted. There were a total of 300 fruits harvested for fruit quality mapping. In , the red dots show where the fruits were harvested for quality analysis.
Fruits were analyzed for weight (g), soluble solid content (SSC; °Brix) (ATAGO, Pocket Reflectometer Pal-1, Tokyo, Japan), flesh firmness (kg) (Turoni, 53205 Digital Fruit Pressure Tester, Forli, Italy), and the liquid extract tested for pH and acidity (Hanna Instruments, HI 9024 microcomputer pH meter, Woonsocket, Rhode Island, USA). The five fruits from each sampling position were weighed and averaged for individual fruit weight. Fruit flesh firmness was measured with an 11 mm plunger after the peel was removed from opposite sides at the equatorial region; the averages of the two measurements were calculated for individual fruit flesh firmness. After the firmness testing, juice from each fruit was extracted and analyzed for SSC, pH, and acidity. Extraction consisted of dicing the apple flesh (without the peel) and macerating it in a juicer (Hamilton Beach, Glen Allen, VA, USA) and then passing the pulp through a screen. Acidity was analyzed by titrating a known mass of juice with 0.1 N NaOH to an endpoint of pH 8.2 and reported as % malic acid (Garner et al., Citation2010).
Financial Analysis
Variable rate fertilization was compared to uniform fertilization through simple accounting by subtracting input cost of fertilizer from the value of marketable yield of ‘Granny Smith’ apples. Earnings were calculated for each 20 m × 4 m section. Fertilizer was valued at 0.7 Euros kg−1 and 0.3 Euros kg−1 for the fresh market ‘Granny Smith’. Earnings maps were created in ArcGIS 10.2.
Data Analysis
A detailed data analysis was carried out to acquire basic descriptive statistics of the studied properties. Pearson’s correlation was applied between the studied properties to assess their relationship and linear regression coefficient to provide the quality of their relationship. SPSS software (SPSS Inc., Release 17.0., Chicago, USA) was utilized for the analysis.
Results and Discussion
Soil Properties
Soils within the region of Thessaly have been characterized from east to west (Yassoglou et al., Citation2017). The study orchard was located in the eastern region of Thessaly within the Larissa soil series where the soils are medium to course in structure and generally well drain and well suited for agronomic production. In our study orchard, the average texture was 36% sand, 36% silt, and 28% clay, which can be classified as a clay loam soil with soil texture types within the 20 m sections from clay to silt loam () (Brady and Weil, Citation2008). East Thessaly climate is classified as mesothermic Mediterranean with an annual rainfall of 430 mm and is noted by wet winters and dry summers (Yassoglou et al., Citation2017), which necessitates irrigation. This region, as well as most of Greece, has limestone in its parent soil-building material and with moderate rainfall tends to have a residual effect on pH due to calcium carbonate (CaCO3). The soil in the orchard had an average of 2.5% CaCO3 and 6.9 pH. Generally, soils in eastern Thessaly are mildly acidic to slightly alkaline, which is ideal for tree fruit production especially apple (Westwood, Citation1993). Soil organic matter in this region tends to be low and even under perennial crop production, like apple, our findings were similar to previously reported trends in soil OM (Yassoglou et al., Citation2017), where an average OM of 1.5% was observed (). Potassium and phosphorus levels were also similar to previously reported values (Yassoglou et al., Citation2017). The orchard was low in P (4.2 ppm) and high K (190 ppm) was observed on the average (). For apple orchards in Greece, optimum ranges for CaCO3 (2.1–5%), P (17–25 ppm), and K (140–200 ppm) have been reported (Koukoulakis, Citation1995) and P was deficient in the study orchard.
Table 2. Descriptive statistics for soil properties measured in 2010
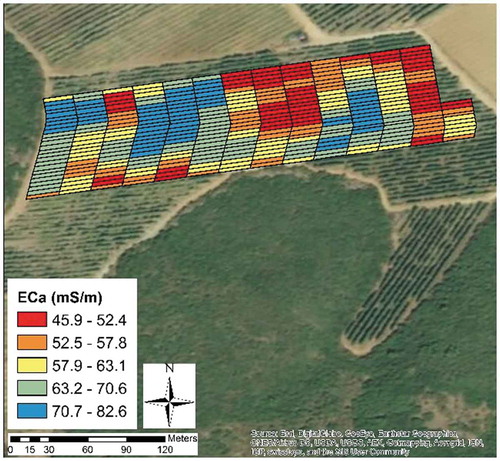
In the A soil horizon or to a depth of 24 cm, eastern Thessaly soils tend to be loam to clay in texture, have CaCO3 content of 5–15% and a xeric nature, the electrical conductivity of the soil can measure 16 mSm−1 and below 25 cm EC can range from 25 to 68 mSm−1 (Yassoglou et al., Citation2017). The EM38 measures ECa as mSm−1, readings of 45.9 mSm−1 to 82.6 mSm−1 were recorded at depths of 37.5 cm across the study orchard. Measurements were collected during the winter when the soil profile was wet, which suggests the high readings reflect the soluble nutrients and the soil texture (Doolittle et al., Citation2001). Soil texture variation affects soil moisture-holding capacity; the ECa readings revealed the orchard soil texture had greater conductivity in the eastern portion of the orchard () suggesting heavier soils. However, the ECa data for the entire orchard were normally distributed with a median value of 61 mSm−1 and the mean value of the readings was 61.67 mSm−1. The soil electrical conductivity correlated poorly with yield and would not have been useful as a variable for SSM in this orchard ().
Table 3. Correlation matrix between yield and soil ECa
Figure 2. Apparent electrical conductivity (ECa; mSm−1) measurements collected with an EM38 and georeferenced at the center of each flagged 20 m section within the study orchard. The eastern section of the orchard had higher readings; however, 45.9 mSm−1 is a higher reading then native soils of eastern Thessaly (16 mSm−1), which suggests the orchard has heavy soils. The average texture was classified as clay loam
Yield
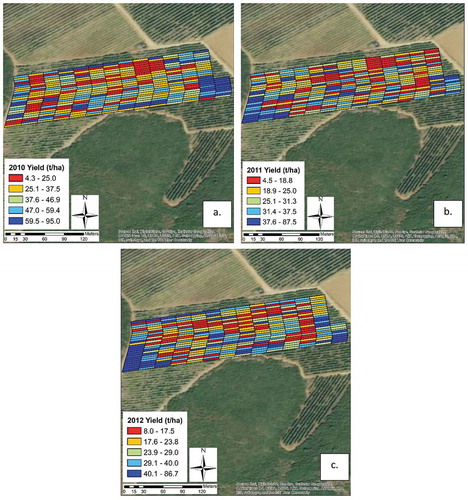
Though there was harvest variability in the orchard (), the average yield between a variable rate and uniform fertilization was not significantly different for 2011 and 2012 harvests ( and ). Yield comparisons of the 20 m sections showed variability at P≥ 0.001 (); however, this did not follow the uniform and VRF treatments and was not affected by ECa (). The yield was distributed normally (−1 < Skewness < 1) throughout the trial () suggesting that the measured parameters in this study were not contributing to the variation. Between the 20 m sections, the yields ranged from 5.6 t ha−1 to 89.8 t ha−1 over the trial and could not be correlated to any of the characteristics compared in this study, which suggests natural variation and the inherent biennial bearing characteristics of apple (Westwood, Citation1993) were affecting yield. In 2010, the orchard appeared to be on an on-year and 2011 an off-year, whereas 2012 may have been affected by poor pollination due to rain and overcast conditions ( and ).
Table 4. Minimum (t ha−1), Maximum (t ha−1), Mean (t ha−1), CV (%), and Skewness of yield during the 3 years of research
Table 5. Comparison of the descriptive statistics for both applications in 2011 at the soil-sampling locations. Column changes show the difference of the VRF application over the uniform application. Yield is expressed in t ha−1, firmness in kg, SSC in g soluble solids per 100 g of juice, acidity in percent and weight in g
Table 6. Comparison of the descriptive statistics for both applications in 2012 at the soil-sampling locations. Column changes show the difference of the VRF application over the uniform application. Yield is expressed in t ha−1, firmness in kg, SSC in g soluble solids per 100 g of juice, acidity in percent and weight in g
Figure 3. Yield maps from (a.) 2010, (b.) 2011 and (c.) 2012. Three hundred and thirty-three polygons are presented on each map. The red polygons had the lowest yield and the blue polygons the highest yield
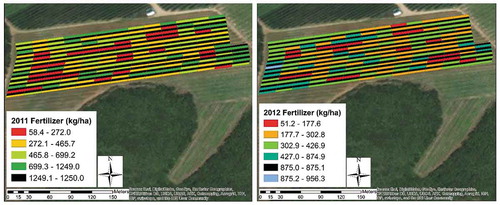
Though the variable fertilizer rates ranged from 51.2 kg ha−1 to 956.3 kg ha−1 (), this did not have a significant effect on yield (). Fertilizer rates in 2011 and 2012 were 59.6% and 63.4% lower in the variable rate treatments than the uniform applications. Aggelopoulou et al. (Citation2010) calculated the variable rate fertilizer plots would use 38% less fertilizer in their apple orchard and Vatsanidou et al. (Citation2017) suggested a 56% reduction of fertilizer in their pear orchard. These data show that measuring yield within sections of an orchard and applying fertilizer based on yield, the grower can potentially reduce inputs and reduce environmental impact.
Figure 4. Fertilizer rate maps for 2011 and 2012. The contiguous black polygons across the orchard from southwest to northeast are the uniform rates at 137.5 kg N ha−1 and 105.0 kg N ha−1 for 2011 and 2012, respectively. Variable rates were applied based on yield and have been classed into ranges for clarity
Fruit Quality
Apples, including ‘Granny Smith’, are climacteric, which makes them ideal for controlled atmospheric (CA) storage. Unlike non-climacteric fruit, where the fruit is allowed to remain on the plant to ripen, apples are harvested prior to the physiological process of ripening or the upregulation of ethylene in the fruit (Patterson and Nichols, Citation1988). Drake et al. (Citation1991) noted that over the harvest dates in their study, ethylene was not detectable by 15 days postharvest. Unlike other apple varieties where background color change of the skin from a greenish tint to yellowish tint is considered an indicator of maturity (Kupferman, Citation1993), ‘Granny Smith’ is a green-skinned variety of apple and allowing any background color change would diminish quality. Hence, optimum harvest maturity indices for ‘Granny Smith’ have been suggested to be firmness at 8.4 kg, SSC at 11.8, and titratable acids at 0.7% (Patterson and Nichols, Citation1988). In our study, firmness was lower than suggested firmness (Patterson and Nichols, Citation1988), which may be due to climate. The climate of the apple production region in Washington State is much cooler during harvest than that of central Greece, where warmer temperatures may be softening the fruit. The firmness of the fruits collected from the areas where VRF applied was 7.5% higher than the fruits of the other fertilizer treatment and were not significant between the fertilizer treatments in 2011 (); however, in 2012 the variable rate fertilizer treatment fruits were 5% firmer (P = .025, ). In 2012, sugars were 20% greater in the variable rate fertilizer treatment and non-significant in 2011. For both 2011 and 2012, titratable acidity was the only indices that were significantly different, where the VRF treatment was 19% and 44% greater in acidity for 2011 and 2012, respectively. For both 2011 and 2012, the average acidity was 1.9%, which is 264% greater than the suggested index for ‘Granny Smith’. For Greek growers of ‘Granny Smith’ apple, the high acidity may be a trade-off to compensate for softening the fruit.
Generally, fruit quality was similar across the treatments and did not have any significant correlation to the soil. The exception was in 2011 where the VRF showed a significant response (P < .05) across the 20 m sections when comparing ECa and acidity. However, in 2012 the same variation was not observed, suggesting the response could have been due to biennial bearing or seasonal variation. From the data collected in our study, no negative effects were observed from VRF.
Returns Map
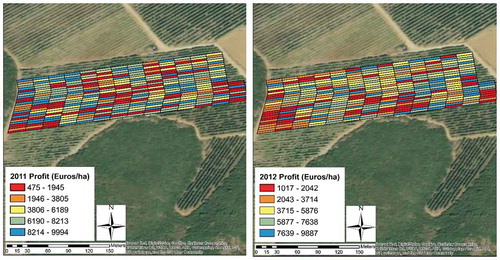
A cost analysis map was produced to identify the level of productivity () based on yield. Values were calculated using the assumptions that fertilizer cost 0.7 Euros kg−1 and the apples returned 0.3 Euros kg−1. As with yield, there was a tremendous amount of variability, though the outcomes for 2011 and 2012 were marginal. The VRF returned only 2.3% and 7.6% more income for 2011 and 2012, respectively (). This calculation suggests how much was in the budget for developing an SSM practice. Because there was not a specific region of the orchard that yielded heavier, producing an SSM practice could be obtained by motioning yield from quadrants of 0.25 to 0.5 ha and fertilizing based on calculations presented here. However, the average profit from utilizing VRF in both years (~5%) compared to uniform treatment seems very small. On the other hand, a profit margin of 5% as related to orchard size may contribute significantly to profit margin in an economy of scale. This may be most notably observed as the price for apples fluctuates. A small increase of 0.10 Euros kg−1 at 2340 kg ha−1 would equal 11.7 Euros ha−1 added to each ha of production or pays for 17 kg of fertilizer.
Table 7. Summary (whole field and not only the soil-sampling locations) of the Fertilizer (kg ha−1) used, yield (kg ha−1), Revenue (Euros ha−1), Expenses (Euros ha−1), Profit1 (Euros ha−1), Profit2 (%) for the 2 years of applying VRF at the apple orchard
Figure 5. Return maps in 2011 and 2012. The red color presents the negative or small return and the blue color presents the highest return
Conclusions
Variable rate fertilization, as applied to the apple orchard, demonstrated that an SSM practice could be used as the basis for precision agriculture. However, it was observed that none of the soil characteristics tested would be a good indicator for developing an SSM practice. Because yield and fruit quality were not negatively affected by VRF, developing an SSM practice by collecting yield from delineated sections of the orchard and calculate N rates based on the formulae used here could reduce fertilizer cost. Further research in this area could possibly include using tractor-mounted scales or load cells and radio-frequency identification (RFID) technology to measure individual bins for geospatial location and weight (Ampatzidis et al., Citation2016; Ampatzidis and Vougioukas, Citation2009; Ampatzidis et al., Citation2010, Citation2012). However, the grower should carefully consider costs involved in the SSM practice to remain competitive.
References
- Aggelopoulou, K., D. Pateras, S. Fountas, T. Gemtos, and G. Nanos. 2010. Soil spatial variability and site-specific fertilization maps in an apple orchard. Precis. Agr. 12:118–129. doi: 10.1007/s11119-010-9161-x.
- Ampatzidis, Y., L. Tan, R. Haley, and M.D. Whiting. 2016. Cloud-based harvest management information system for hand–Harvested specialty crops. Comput. Electron. Agr. 122:161–167. doi: 10.1016/j.compag.2016.01.032.
- Ampatzidis, Y., M. Whiting, P. Scharf, and Q. Zhang. 2012. Development and evaluation of a novel system for monitoring harvest labor efficiency. Comput. Electron. Agr. 88:85–94. doi: 10.1016/j.compag.2012.06.009.
- Ampatzidis, Y., and S. Vougioukas. 2009. Field experiments for evaluating the incorporation of RFID and barcode registration and digital weighing technologies in manual fruit harvesting. Comput. Electron. Agr. 66:166–172. doi: 10.1016/j.compag.2009.01.008.
- Ampatzidis, Y., S. Vougioukas, D. Bochtis, and C. Tsatsarelis. 2010. A yield mapping system for hand-harvested fruits based on RFID and GPS location technologies: Field testing. Precis. Agr. 10:63–72. doi: 10.1007/s11119-008-9095-8.
- Basso, B., L. Sartori, D. Cammarano, C. Fiorentino, R.P. Grace, and S. Fountas. 2012. Environmental and economic evaluation of N fertilizer rates in a maize crop in Italy: A spatial and temporal analysis using crop models. Biosystems Eng. 113:103–111. doi: 10.1016/j.biosystemseng.2012.06.012.
- Bennewitz Alvarez, E.A.V., R. Cazanga Solar, M. Carrasco Benavides, C. Fredes, J.E.A. Mejia, and T. Losak. 2017. Vegetative and productive responses of organic apple (Malus domestica L.) to fossilized red guano and a controlled-release fertilizer. Chilean J. Agr. Anim. Sci. 33:213–220.
- Bennewitz Alvarez, E.A.V., T. Cooper, C. Benavides, T. Losak, and J. Hlusek. 2011. Response of “Jonagold” apple trees to Ca, K and Mg fertilization in an andisol in southern Chile. J. Soil Sci. Plant Nutr. 11:71–81.
- Bennewitz Alvarez, E.A.V., T. Cooper, T. Losak, J. Hlusek, and M. Carrasco. 2015. Effect of decreasing levels of N amendments on organic “Granny Smith” apple trees. J. Soil Sci. Plant Nutr. 15:79–90.
- Bouyoucos, G.H. 1951. A recalibration of the hydrometer method for making mechanical analyses of soils. Agron. J. 43:434–438. doi: 10.2134/agronj1951.00021962004300090005x.
- Brady, N.C., and R.R. Weil. 2008. The nature and properties of soils. 14th ed. Pearson Prentice Hall, Englewood Cliffs, N.J.
- Costa, N.R., M.D. Carvalho, E.A. Dal Bern, F.C. Dalchiavon, and R.R. Caldas. 2014. Orange yield correlated with soil chemical attributes aiming specific management zones. Pesquisa Agropecuária Trop. 44:391–398. doi: 10.1590/S1983-40632014000400001.
- Doolittle, J., M. Peterson, and T. Wheeler. 2001. Comparison of two electromagnetic induction tools in salinity appraisals. J. Soil Water Conserv. 56:257–262.
- Drake, S. R., F. E. Larsen, and S. S Higgins. 1991. Quality and storage of 'granny smith' apples on seedling, m.26, and mm.111 rootstocks. j. am. soc. Hortic. Sci 116:pp. 261–264.
- Duchaufour, P. 1960. Precis de Pedologie. Masson, Paris, FR.
- El-Gazzar, A.A.M. 2000. Effect of fertilization with nitrogen, potassium, and magnesium on Anna apples. Part 1. Effect of nitrogen fertilization. Ann. Agr. Sci. 3:1145–1152.
- Fallahi, E., S.W. Conway, K.D. Hickey, and E.C. Sams. 1997. The role of calcium and nitrogen in postharvest quality and disease resistance of apples. HortScience. 32:831–835. doi: 10.21273/HORTSCI.32.5.831.
- Fallahi, E., W.M. Colt, C.R. Baird, B. Fallahi, and I. J. Chun. 2001. Influence of nitrogen and bagging on fruit quality and mineral concentrations of bc-2 fuji apple. Horttechnology 11(3):462–466.
- Food and Agriculture Organization of the United Nations (FAO). 2018. FAOSTAT apples. 27 Aug. 2018. http://www.fao.org/faostat/en/#data/QC.
- Fountas, S., K. Aggelopoulou, C. Bouloulis, G. Nanos, D. Wulfsohn, T. Gemtos, A. Paraskevopoulos, and M. Galanis. 2011. Site-specific management in an olive tree plantation. Precis. Agr. 12:179–195. doi: 10.1007/s11119-010-9167-4.
- Garner, D., C.H. Crisosto, P. Wiley, and G.M. Crisosto. 2010. Measurement of pH and titratable acidity. 5 Sep. 2018. http://fruitandnuteducation.ucdavis.edu/files/162035.pdf.
- Gosh, S., S. Manna, and B. Mathew. 2004. Effect of nitrogen and potassium fertilization on custard apple grown under rain fed laterite soils. Environ. Ecol. 22:144–147.
- Grewelling, T., and M. Peech. 1965. Chemical soil tests. Cornell Univ. Ag. Exp. Sta. Bull. 960:12–29.
- Hansen, P. 1980. Yield components and fruit development in Golden Delicious apples as affected by the timing of nitrogen supply. Sci. Hort. 12:243–257. doi: 10.1016/0304-4238(80)90005-9.
- HNMS. 2018. Hellenic National Meteorological Service. 14 May 2018. http://www.emy.gr/emy/en/.
- Huett, D.O. 1996. Prospects for manipulating the vegetative–Reproductive balance in horticultural crops through nitrogen nutrition: A review. Crops Pasture Sci. 47:47–66. doi: 10.1071/AR9960047.
- IFA. 1992. International Fertilizer Association. World Fertilizer Use Manual, 15 May 2015. http://www.fertilizer.org/ifa/Home-Page/LIBRARY/World-Fertilizer-Use-Manual/by-common-names.
- Jackson, M.L. 1958. Soil chemical analysis. Prentice Hall, Englewood Cliffs, NJ.
- Koukoulakis, P. 1995. Basic principles of rational fertilization of crops. Crop Anim. Husb. 9:43–61. [in Greek].
- Kupferman, E.M. 1993. Fruit maturity and storage for Gala Fuji and Braeburn. Compact Fruit Tree 26:82–84.
- Lee, W.S., and R. Ehsani. 2015. Sensing systems for precision agriculture in Florida. Comput. Electron. Agr. 112:2–9. doi: 10.1016/j.compag.2014.11.005.
- Lopez-Granados, F., M. Jurado-Exposito, S. Alamo, and L. Garcia-Torres. 2004. Leaf nutrient spatial variability and site-specific fertilization maps within olive Olea europaea L. Orchards. European J. Agron. 21:209–222. doi: 10.1016/j.eja.2003.08.005.
- Lowenberg-DeBoer, J., and A. Aghib. 1999. Average return and risk characteristics of site specific P and K management: Eastern corn belt on-farm trial results. J. Production Agr. 122:276–282. doi: 10.2134/jpa1999.0276.
- Lyle, G., M. Lewis, and B. Ostendorf. 2013. Testing the temporal ability of landstat imagery and precision agriculture technology to provide high resolution historical estimates of wheat yield at the farm scale. Remote Sens. 5:1549–1567. doi: 10.3390/rs5041549.
- Maestrini, B., and B. Basso. 2018. Predicting spatial patterns of within-field crop variability. Field Crops Res. 219:106–112. doi: 10.1016/j.fcr.2018.01.028.
- Marsh, K.B., R.K. Volz, and P. Reay. 1996. Fruit color, leaf nitrogen level, and tree vigor in ‘Fuji’ apples. New Zeal. J. Crop Hort. Sci. 24:393–399. doi: 10.1080/01140671.1996.9513976.
- McLean, F. 1982. Soil pH and lime requirement, p. 199–224. In: A.L. Page (ed.). Methods of soil analysis. Part 2. Chemical and microbiological properties. Am. Soc. Agron., Soil Sci. Soc. Am. Madison, WI.
- Neilsen, D., and G.H. Neilsen. 2002. Efficient use of nitrogen and water in high-density apple orchards. HortTechnology. 12:19–25. doi: 10.21273/HORTTECH.12.1.19.
- Olsen, S.R., C.V. Cole, F.S. Watanabe, and L.A. Dean. 1954. Estimation of available phosphorus in soils by extraction with sodium carbonate. US Dept. Ag. circ.939.
- Page, A.L., R.H. Miller, and D.R. Keeney. 1982. Methods of soil analysis. 2nd. Am. Soc. Agron. Madison, WI.
- Papadopoulos, A., D. Kalivas, and T. Hatzichristos. 2011. Decision support system for nitrogen fertilization using fuzzy theory. Comput. Electron. Agr. 78:130–139. doi: 10.1016/j.compag.2011.06.007.
- Patterson, M.E., and W.C. Nichols. 1988. Harvest maturity and storage of ‘Granny Smith’ apples for late CA and uniform market quality. Post Harvest Pomology Newsl. 6:8–10. Postharvest Information Network, 8 Oct. 2018. http://postharvest.tfrec.wsu.edu/pages/N6I2B.
- Phillips, S., and K Majumdar. 2017. The role of precision agriculture in closing maize yield gaps. Better Crops, 101 (2), pp. 26–28. http://www.ipni.net/publication/bettercrops.nsf/0/B346A4C5C12654D0852581240072C74E/$FILE/BC-2017-2%20p26.pdf
- Pierce, F.J., and P. Nowak. 1999. Aspects of precision agriculture. Adv. Agron. 67:1–85.
- Raese, J.T., R.S. Drake, and A.E. Curry. 2007. Nitrogen fertilizer influences fruit quality, soil nutrients and cover crops, leaf color and nitrogen content, biennial bearing and cold hardiness of ‘Golden Delicious’. J. Plant Nutr. 30:1585–1604. doi: 10.1080/01904160701615483.
- Righetti, T., K. Wilder, R. Stebbins, D. Burkhart, and J. Hart. 1998. Apples: nutrient management guide. Oregon State University Extension Service, EM 8712. https://catalog.extension.oregonstate.edu/sites/catalog/files/project/pdf/em8712.pdf.
- Robert, P.C. 2002. Precision agriculture: A challenge for crop nutrition management. Plant Soil. 247:143–149. doi: 10.1023/A:1021171514148.
- Robertson, G.P., and P. Goffman. 2007. Nitrogen transformations, p. 341–364. In: E.A. Paul (ed.). Soil microbiology, ecology, and biochemistry. 3rd. Academic/Elsevier, New York.
- Santesteban, L.G., S. Guillaume, J.B. Royo, and B. Tisseyre. 2013. Are precision agriculture tools and methods relevant at the whole-vineyard scale? Precis. Agr. 14:2–17. doi: 10.1007/s11119-012-9268-3.
- Schumann, A.W. 2010. Precise placement and variable rate fertilization application technologies for horticultural crops. HortTechnology. 20:34–40. doi: 10.21273/HORTTECH.20.1.34.
- Sparks, D.L., A.L. Page, P.A. Helmke, R.H. Lowppert, P.N. Soltanpour, M.A. Tabatabai, C.T. Johnson, and M.E. Sumner. 1996. Methods of soil analysis Part 3 – Chemical methods. Soil Sci. Soc. Am. Madison, WI. https://www.waterboards.ca.gov/waterrights/water_issues/programs/bay_delta/california_waterfix/exhibits/docs/Islands/II_41.pdf
- Tahir, I.I., E. Johansson, and E.M. Olsson. 2007. Improvement of quality and storability of apple cv. Aroma by adjustment of some pre-harvest conditions. Sci. Hort. 112:164–171. doi: 10.1016/j.scienta.2006.12.018.
- United States Department of Agriculture Foreign Agricultural Service (USDA FAS). 2018. Global agricultural information network (GAIN) report: Greece fresh deciduous fruit annual report 2017, 27 Aug. 2018. https://gain.fas.usda.gov/Recent%20GAIN%20Publications/Fresh%20Deciduous%20Fruit%20Annual%202017_Rome_Greece_10-31-2017.pdf.
- Vatsanidou, A., G.D. Nanos, S. Fountas, J. Baras, A. Castrignano, and T.A. Gemtos. 2017. Nitrogen replenishment using variable rate application technique in a small hand-harvested pear orchard. Spanish J. Agr. Res. 15:e0209. doi: 10.5424/sjar/2017154-10986.
- Weinbaum, S.A., R.S. Johnson, and T.M. DeJong. 1992. Causes and consequences of overfertilization in orchards. HortTechnology. 2:112–121. doi: 10.21273/HORTTECH.2.1.112b.
- Westwood, M.N. 1993. Temperate-zone pomology: Physiology and culture. 3rd ed. Timber Press, Inc, Portland, OR.
- Wittry, D., and A. Mallarino. 2004. Comparison of uniform and variable rate phosphorus fertilization for corn-soybean rotations. J. Am. Soc. Agron. 96:26–33. doi: 10.2134/agronj2004.0026.
- Xu, X., P. He, F. Yang, J. Ma, M.F. Pampolino, A.M. Johnston, and W. Zhou. 2017. Methodology of fertilizer recommendation based on yield response and agronomic efficiency for rice in China. Field Crops Res. 206:33–42. doi: 10.1016/j.fcr.2017.02.011.
- Yang, C., J. Everitt, and J. Bradford. 2001. Comparison of uniform and variable rate nitrogen and phosphorus fertilizer application for grain sorghum. Trans. ASAE. 44:201–209. doi: 10.13031/2013.4676.
- Yassoglou, N., C. Tsadilas, and C. Kosmas. 2017. The soils of Greece. Springer Intl. Publ, Cham, Switzerland.
- Zaman, Q., and W.A. Schuman. 2006. Nutrient management zones for citrus based on variation in soil properties and tree performance. Precis. Agr. 7:45–63. doi: 10.1007/s11119-005-6789-z.