
ABSTRACT
In this study, genetic diversity and phylogenetic analyzis based on cpDNA trnL intron and trnL-F sequences of L. nobilis L. populations were made. Persea schiedeana and Endiandra wolfei taxa were used as outgroups. Plant samples were collected from various different provinces and districts of the Aegean region and brought to the laboratory. Genomic DNAs were isolated from fresh and green leaves of the plants. trnC and trnD primers were used for the trnL intron region, and trnE and trnF primers were used for the trnL-F region. The obtained DNA sequences were then corrected using BioEdit and FinchTV programs. MEGA 6.0 program was used both phylogenetic analyzis and the detection of genetic distances. For the intron region of the trnL, the mean nucleotide composition was determined as 36.5% T, 20.2% C, 26.4% A and 16.9% G. These values were found as 30.7% T for 15.9% C, 31.9% A and 21.6% G for the trnL-F region. The lowest distance for the trnL intron region was found 0.000 while the highest distance was 0.004. The value was found 0.000 for the trnL-F region. The phylogenetic tree, which was obtained using both trnL intron and trnL-F sequences, consisted of two large branches. As a result, according to the data obtained from trnL intron and trnL-F sequences, the trnL intron sequence found a solvent in the phylogenetic relationship between L. nobilis populations, while the phylogenetic relationship between trnL-F sequence and L. nobilis populations was not found.
Introduction
The Lauraceae family is a family of about 50 genera and more than 2000 species, spreading in subtropical latitudes throughout the tropics, particularly in Southeast Asia and tropical America (Salleh et al., Citation2016). Laurus nobilis L. (Lauraceae) is an evergreen shrub plant which is native to the southern regions of Europe and the Mediterranean region (Verdian-rizi and Hadjiakhoondi, Citation2008). It is generally found in the Mediterranean climate zone; Portugal, Spain, Italy, the former Yugoslavia, Greece, Turkey and southern coastal regions of Africa. Laurus nobilis is the characteristic tree of the vegetation called maquis, in the Mediterranean region (Ertekin et al., Citation2009). Essential oil of Laurus nobilis leaf is used as a preservative and flavorant in the food industry. In addition, the essential oil obtained from the laurel is used in melanoma inhibition, joint and muscle pain relief, as preservative in cosmetic products, treatment of digestive system and skin problems, aromatherapy, massage products and as insect repellent (Gölükçü et al., Citation2017; Kaurinovic et al., Citation2010; Marques et al., Citation2016). Furthermore, anthocyanin in Laurus nobilis fruit is used as a natural colorant in the food, pharmaceutical and cosmetic industries (Karık et al., Citation2015). Aqueous extracts of laurel fruits and leaves have been used as an astringent agent in herbal medicines and for the treatment of various neurological, dermatological and urological diseases (Fidan et al., Citation2019).
Phylogenetics has become a powerful tool and a starting point in many areas of biology, such as developmental genetics, genomics, taxonomy and biogeography (Wei et al., Citation2014). Recently, many molecular markers have been developed to overcome the limitations of morphological and biochemical markers in plant phylogenetics, such as nuclear ribosomal DNA of the internal transcribed spacer (ITS), chloroplast DNA, inter-generic spacer (IGS), external transcribed spacer (ETS), and simple sequence repeat (SSR) technology which have been used in plant classification (Agarwal et al., Citation2008; Kim et al., Citation2015; Sun et al., Citation2015). Chloroplast DNA (cpDNA) sequence variations are widely used to investigate unique-specific relationships between angiosperms and other plants. However, the low evolutionary ratio of this molecule is a series limitation at intraspecific level (Taberlet et al., Citation1991). One of the non-coded zones is chloroplast DNA (cpDNA) pieces. Chloroplast DNA (cpDNA) sequences, particularly the non-coding regions such as the trnL (UAA) intron and the intergenic spacer of trnL (UAA) -trnF (GAA), are used in the capacity of revealing the phylogenetic relationships of the species (Liu et al., Citation2005) (). trnL-F region, comprising the trnL intron and trnL-F spacer, has become one of the most widely used chloroplast markers for phylogenetic analyzes in plants (Pirie et al., Citation2007).
Figure 1. trnL intron and trnL-F regions (Amirahmadi et al., Citation2010)
In this study, sequence analyzes of Laurus nobilis populations using (cpDNA) trnL intron and trnL-F sequences was performed to elucidate phylogenetic relationships and genetic diversity among the investigated taxa. The resulting sequences will provide relevant data in the field of genetic and agricultural biotechnology. Persea schiedeana and Endiandra wolfei taxa were used as outgroups.
Materials and Methods
Plant Samples and DNA Extractions
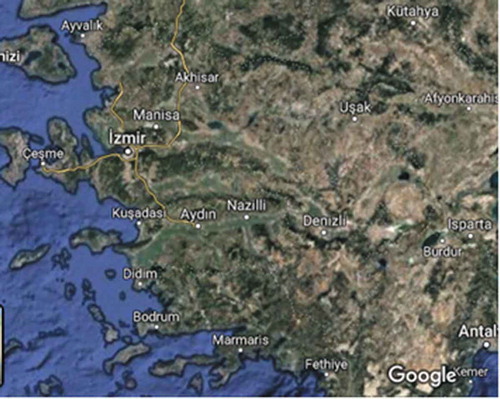
Laurus nobilis populations used in the study were collected from certain regions in Aegean region (Aydın, Kuşadası, Muğla, İzmir- Çiğili, Seferihisar, Yeşilyurt, Manisa-Salihli) between July and September, 2018 (). Total genomic DNA was extracted using DNA Plant Kit (GeneMark). DNA samples were stored at −20°C.
Figure 2. Location of Aegean region. The maps were obtained from Google Maps (maps.google.com)
PCR Amplification and Sequencing
Specific primer pairs are used to replicated targeted regions; For trnL intron region trnDc (F) 5ʹ CGA AAT CGG TAG ACG CTA CG 3ʹ, trnD (R) 5ʹ GGG GAT AGA GG ACT TGA AC 3ʹ, for trnL-F IGS region replicate trnE (F) 5ʹ GGT TCA AGT CCC TCT ATC CC 3ʹ, trnF (R) 5ʹ ATT TGA ACT GGT GAC ACG AG 3ʹ primer pairs were used (Taberlet et al., Citation1991). The amplification process was performed in 25 µL PCR reaction. Each PCR reaction contained 1 µL trnC and 1 µL for trnD primers (For trnL intron), for trne primer, 1.0 µL for trnf primer (5 µM each) (For trnL-F), 5.0 µL Master mix (250 µM dNTP, 0.75 U Taq DNA polymerase, reaction buffer, 2 Mm MgCl2), 1.0 µL total genomic DNA (approximately 25 ng), and 17.0 µL ddH2O. Optimized PCR condition given in . Gel electrophoresis with 0.8% agarose gel run in 1X TBE (Tris-Borate EDTA) buffer was used to size fractionate amplicons. Subsequently, gels were stained with ethidium bromide and visualized on a UV trans-illuminator. The trnC/trnD and trnE/trnF primer pairs were used both for amplification and for sequencing which were conducted at Triogen Inc. (İstanbul, Turkey). For each sample, forward and reverse sequencing reactions were performed and the sequences were checked via GenBank (NCBI) through BLASTn search. Later obtained DNA sequences were edited both manually and by using BioEdit (Hall, Citation1999) and FinchTV programs.
Table 1. Cycles and conditions of cpDNA trnL intron and trnL-F region PCR reactions
Alignment and Phylogenetic Analyzes
ClustalW program was used to align the sequences (Thompson et al., Citation1994). The obtained DNA sequences were transferred into FASTA format with the help of Microsoft Office Word program, since this program works in the FASTA format, and made ready for alignment. DNA base sequences were aligned using the default commands in ClustalW program and base differences between the populations were detected. The phylogenetic tree generated based on Maximum Likelihood and neighbor-joining (NJ) (Saitou and Ne, Citation1987) methods were constructed using MEGA 6.0 software (Tamura et al., Citation2013). The phylogenetic tree was evaluated with bootstrap test based on 1000 replicates (Felsenstein, Citation1985). Sequences of Persea schiedeana (GU250777.1) and Endiandra wolfei (KC428508.1) taxa used as outgroups in the tree were retrieved from NCBI.
Results and Discussion
Molecular markers are important advances in plant biotechnology and are a part of the DNA associated with any gene region or gene region in the genome (Yeşiltaş and Kolören, Citation2019). The chloroplast is maternally inherited in most angiosperms and contains its own genome that encodes many chloroplast specific components. Chloroplasts contain genes that are highly conserved for more variable regions that are informative for essential plant life and evolutionary history (Filiz et al., Citation2018). In this study, trnL intron sequences obtained ranged from 519 to 528 nucleotides among 8 specimens. Average nucleotide composition of trnL intron sequences was 36.5% T, 20.2% C, 26.4% A and 16.9% G. The highest AT content (63.1%) and the lowest GC content (36.9%) was observed in Denizli population, while the lowest AT content (62.5%) and the highest GC content (37.5%) were recorded in Kuşadası population (). Genetic distance method based on trnL intron set was performed with MEGA 6.0 software. The divergence values varied from 0.000 to 0.004 (). Tajma’s Neutrality Test was calculated on the basis of trnL intron sequences of all eight populations using MEGA 6. Eight numbers of sequences (m) gave one segregation site (S) revealing very low nucleotide diversity (π) of 0.001004 (). Substitution pattern and rates were estimated under the Tamura and Nei (Citation1993) model. Relative values of instantaneous r should be considered when evaluating them. For simplicity sum of r values is made equal to 100. The transitional substation rates were found higher than rates of different transitional substitutions are shown in bold and those of transversionsal substitutions are given in italics. The nucleotide frequencies are A = 26.51%, T/U = 36.95%, C = 19.90%, and G = 16.64%. For estimating ML values, a tree topology was automatically computed. The maximum Log likelihood for this computation was −682.907 (). For cpDNA trnL-F sequences, the average base length ranged from 372 to 376 nucleotides among 8 specimens (Except for outgroups Persea schiedeana and Endiandra wolfei). Average nucleotide composition of trnL-F sequences was 30.7% T, 15.9% C, 31.9% A and 21.6% G. The highest AT content (63.50%) and the lowest GC content (33.40%) was observed in while the lowest AT content (62.40%) and the highest GC content (37.60%) were recorded in (). Genetic distance method based on trnL-F set was performed with MEGA 6.0 software. The divergence values varied from 0.000 to 0.000 (). Tajma’s Neutrality Test was calculated on the basis of trnL-F sequences of all eight populations using MEGA 6. Eight numbers of sequences (m) gave zero segregation site (S) revealing very low nucleotide diversity (π) of 0.00000 (). Substitution pattern and rates were estimated under the Tamura and Nei (Citation1993) model. Relative values of instantaneous r should be considered when evaluating them. For simplicity sum of r values is made equal to 100. The transitional substation rates were found higher than rates of different transitional substitutions are shown in bold and those of transversionsal substitutions are given in italics. The nucleotide frequencies are A = 33.24%, T/U = 30.32%, C = 14.58%, and G = 21.87%. For estimating ML values, a tree topology was automatically computed. The maximum Log likelihood for this computation was −459.986 ().
Table 2. Length and A + T and G + C contents of trnL intron sequences of Laurus nobilis populations
Table 3. Pairwise sequence distances among Laurus nobilis populations taxa for trnL intron data using MEGA 6.0 software distance matrix
Table 4. Tajima’s Neutrality Test Values based on trnL intron of eight date Laurus nobilis populations MEGA6
Table 5. Maximum likelihood estimate of substitution matrix
Table 6. Length and A + T and G + C contents of cpDNA trnL-F sequences of Laurus nobilis populations
Table 7. Pairwise sequence distances among some Laurus nobilis populations for cpDNA trnL-F data using MEGA 6.0 software distance matrix
Table 8. Tajima’s Neutrality Test Values based on trnL-F of eight date Laurus nobilis populations MEGA6
Table 9. Maximum likelihood estimate of substitution matrix
The systematics of plant molecular has been rapidly advancing particularly in the last 20 years. This advancement has started to contribute to the molecular systematics by the use of sequence analyzes and the discovery of new phylogenetic analyzes methods. The sequence analyzes is very useful for the phylogenetic analyzes when morphological characters are insufficient in terms of phylogenetic knowledge (İnal et al., Citation2017). The non-coding regions in the chloroplast genome are frequently preferred for molecular systematics and genetic studies on plant population (Kalmer and Tekpınar, Citation2017). Maximum likelihood tree was formed based on trnL intron sequences of Laurus nobilis populations spread within Turkey and sequences of outgroups were taken from NCBI (GenBank). Laurus nobilis populations consist of two clades in the ML tree formed based on trnL intron sequences of the specimens. Clade 1, composed of Çiğli, Denizli, Salihli and Seferihisar populations. Clade 2, consist of Aydın, Kuşadası, Yeşilyurt and Muğla populations (). The neighbor-joining tree generated by cpDNA trnL intron sequences is shown in . The relationship between the populations could not be resolved in the NJ tree. Within the phylogenetic tree, Seferihisar and Kuşadası populations formed a group and Salihli and Denizli populations formed a group. Maximum likelihood and neighbor joining trees were formed based on trnL-F sequences of Laurus nobilis populations spread within Turkey and sequences of outgroups were taken from NCBI (GenBank). Laurus nobilis populations both phylogenetic trees were the same. Phylogenetic trees formed according to the chloroplast trnL-F sequence did not solve the relationship between Laurus nobilis populations ( and). As a results of, the data obtained through both trnL intron and trnL-F sequences did not have a solvent effect on the phylogenetic relationship between Laurus nobilis populations. Several studies were conducted in the past on the species of Laurus nobilis including; Sevindik (Citation2019) determined the molecular characterization of seven L. nobilis populations in the Aegean region using ISSR markers. Ten ISSR primers were used in the study. In total, 46 bands were obtained and 22 of these bands were polymorphic and the polymorphism rate was approximately 48%. The UPGMA phylogenetic tree formed according to ISSR data consisted of two large clades, Clade 1, Seferihisar, Yesilyurt, Denizli, Salihli and Çiğli populations as a subgroup, Aydin population as a separate subgroup. In the study, Muğla population was included in a separate clade. Bulut et al. (Citation2018) identified the genetic characterization of 95 Laurus nobilis chosen from Turkey/Hatay flora using SSR markers. As a result of the study, they identified 82 alleles with an average of 16.4 in 5 polymorphic loci in SSR analyzes. In addition, they found that the presence of laurels in Hatay is important in terms of revealing and protecting the genetic diversity. Rodríguez‐Sánchez et al. (Citation2009) investigated the phylographic analyzes of Laurus species spreading in Macaronesian and Mediterranean. In their study, 57 Laurus populations have used cpDNA (trnK-matK, trnD-trnT) sequence analyzes. They revealed the relationship between phylogenetic analyzes and haplotypes using these regions. The phylogenetic tree revealed monophyly for Laurus. They also found a close relationship between the Macaronesian populations of Laurus azorica and the western populations of Laurus nobilis. Arroyo-García et al. (Citation2001) revealed the genetic relationships of 14 Laurus nobilis and Laurus azorica populations from different geographical regions including the Canary and Madeira Islands, France and Italy using the AFLP molecular marker technique. The results of the study showed that AFLPs are very useful in analyzing the genetic similarity between the natural populations of Laurus. Arroyo et al. (Citation2010) identified the genetic diversity of 63 populations of Laurus nobilis and Laurus azorica species using 20 newly designed SSR markers. They found 196 alleles of 37 genotypes belonging to Laurus nobilis species. Additionally, it has been shown that SSR markers are useful tools for determining genetic diversity the populations of the Laurus species.
Figure 3. Phylogenetic tree of Laurus nobilis populations trnL intron sequences constructed using maximum likelihood method with MEGA 6.0
Figure 4. Phylogenetic tree of Laurus nobilis populations trnL intron sequences constructed using neighbor joining method with MEGA 6.0
Figure 5. Phylogenetic tree of Laurus nobilis populations trnL-F sequences constructed using maximum likelihood method with MEGA 6.0
Figure 6. Phylogenetic tree of Laurus nobilis populations trnL-F sequences constructed using neighbor joining method with MEGA 6.0
Conclusion
In conclusion, in the light of the findings of the present study, trnL intron sequence found a solvent in the phylogenetic relationship between L. nobilis populations, while the phylogenetic relationship between trnL-F sequence and L. nobilis populations was not found. To obtain more reliable phylogenetic results, different gene regions (nrDNA ITS) should be sequenced or genetic diversity can be elicited using different marker techniques (RAPD, ISSR, SSR, AFLP). In addition, the data obtained from the present study will shed light on further phylogenetic studies between both Laurus nobilis populations and other plant species.
Correction Statement
This article has been republished with minor changes. These changes do not impact the academic content of the article.
Additional information
Funding
References
- Agarwal, M., S. Neeta, and P. Harish. 2008. Advances in molecular marker techniques and their application in plant sciences. Plant Cell Rep. 27:617–631. doi: 10.1007/s00299-008-0507-z.
- Amirahmadi, S., S. Kazempour Osaloo, and A.A. Maassoumi. 2010. Loss of chloroplast trnLUAA intron in two species of Hedysarum (Fabaceae): Evolutionary implications. Iran J. Biotechnol. 8(3):150–155.
- Arroyo, J.M., C. Rigueiro, R. Rodríguez, A. Hampe, A. Valido, F. Rodríguez‐Sánchez, and P. Jordano. 2010. Isolation and characterization of 20 microsatellite loci for laurel species (Laurus, Lauraceae). Am. J. Bot. 97(5):e26–e30. doi: 10.3732/ajb.1000069.
- Arroyo-García, R., J.M. Martínez-Zapater, J.F. Prieto, and R. Álvarez-Arbesú. 2001. AFLP evaluation of genetic similarity among laurel populations (Laurus L.). Euphytica 122(1):155–164. doi: 10.1023/A:1012654514381.
- Bulut, M.Ç., C.Y. Özmen, A. Ergül, and F. Ayanoğlu. 2018. Genetic characterization of Bay Laurel (Laurus nobilis L.) populations using microsatellite markers and flow cytometry. J. Agric. Faculty Mustafa Kemal Univ. 23(2):242–253.
- Ertekin, M., E. Kırdar, A. Sezgin, and H.B. Özel. 2009. Bazı Büyüme Düzenleyicilerin Akdeniz Defnesi (Laurus nobilis L.) Fidanlarının Gelişimi Üzerine Etkileri. Kastamonu Üniversitesi Orman Fakültesi Dergisi 9(2):171–176.
- Felsenstein, J. 1985. Confidence limits on phylogenies: An approach using the bootstrap. Evolution 39(4):783–791. doi: 10.1111/j.1558-5646.1985.tb00420.x.
- Fidan, H., G. Stefanova, I. Kostova, S. Stankov, S. Damyanova, A. Stoyanova, and V.D. Zheljazkov. 2019. Chemical composition and antimicrobial activityof Laurus nobilis L. essential oils from Bulgaria. Molecules 24(4):804. doi: 10.3390/molecules24040804.
- Filiz, E., M.E. Uras, I.I. Ozyigit, U. Sen, and H. Gungor. 2018. Genetic diversity and phylogenetic analyses of Turkish rice varieties revealed by ISSR markers and chloroplast trnl-F region. Fresenius Environ. Bull. 27(12):8351–8358.
- Gölükçü, M., H. Tokgöz, and D.Y. Turgut. 2017. Defne (Laurus nobilis) Uçucu Yağ Bileşimi Üzerine Distilasyon Süresinin Etkisi. Food Health 4(1):37–42.
- Hall, T.A. 1999. Bioedit: A user-friendly biological sequence alignment editor and analyses program for Windows 95/98/NT. Nucleic Acids Symp. 41:95–98.
- İnal, B., A. Aydın, A.G. İnce, and M. Karaca. 2017. Genetic relationships among continental cotton species based on ITS1 gene region aligned with different alignment tools. J. Mol. Biol. Biotechnol. 1(2):1–6.
- Kalmer, A., and A.D. Tekpınar. 2017. Centaurea Cinsine Ait Beş Türün trnT-LF cpDNA Bölgesi Kullanılarak Filogenetik İlişkilerinin Belirlenmesi. Cumhuriyet Sci. J. 38(4):52–59. doi: 10.17776/csj.363294.
- Karık, Ü., F. Çiçek, E. Oğur, M. Tutar, and F. Ayas. 2015. Türkiye Defne (Laurus nobilis L.) Populasyonlarının Uçucu Yağ Bileşenleri. Anadolu 25(1):1–16.
- Kaurinovic, B., M. Popovic, and S. Vlaisavljevic. 2010. In vitro and in vivo effects of Laurus nobilis L. leaf extracts. Molecules 15:3378–3390. doi: 10.3390/molecules15053378.
- Kim, S.J., K.S. Cho, K.O. Yoo, K.B. Lim, Y.J. Hwang, D.C. Chang, and K.S. Kim. 2015. Sequence analysis of the Internal Transcribed Spacer (ITS) region of the nuclear ribosomal DNA (nrDNA) Chrysanthemum species in Korea. Hortic. Environ. Biotechnol. 56(1):44–53. doi: 10.1007/s13580-015-0085-2.
- Liu, Q., S. Ge, H. Tang, X. Zhang, G. Zhu, and B.-R. Lu. 2005. Phylogenetic relationships in Elymus (Poaceae: Triticeae) based on the nuclear ricosomal internal transcribed spacer and chloroplast trnL-F sequences. New Phytol. 170:411–420. doi: 10.1111/j.1469-8137.2006.01665.x.
- Marques, A., B. Teixeira, and M.L. Nunes. 2016. Bay laurel (Laurus nobilis) oils. Chapter 26, p. 239–246. In: V.R. Preedy (ed.). Essential oils in food preservation, flavor and safety. Academic Press, 896 pp, London, UK.
- Pirie, M.D., M.P.B. Vargas, M. Botermans, F.T. Bakker, and L.W. Chatrou. 2007. Ancient paralogy in the cpDNA trnL‐F region in Annonaceae: Implications for plant molecular systematics. Am. J. Bot. 94(6):1003–1016. doi: 10.3732/ajb.94.6.1003.
- Rodríguez‐Sánchez, F., B. Guzmán, A. Valido, P. Vargas, and J. Arroyo. 2009. Late Neogene history of the laurel tree (Laurus L., Lauraceae) based on phylogeographical analyses of Mediterranean and Macaronesian populations. J. Biogeogr. 36(7):1270–1281. doi: 10.1111/j.1365-2699.2009.02091.x.
- Saitou, N., and M. Ne. 1987. The neighbor-joining method: A new method for reconstructing phylogenetic trees. Mol. Biol. Evol. 4(4):406–425. doi: 10.1093/oxfordjournals.molbev.a040454.
- Salleh, W.M.N.H.W., F. Ahmad, K.H. Yen, and R.M. Zulkifli. 2016. Essential oil compositions of Malaysian Lauraceae: A mini review. Pharm. Sci. 22(1):60–67. doi: 10.15171/PS.2016.11.
- Sevindik, E. 2019. Molecular genetic diversity of some Laurus nobilis L. (Lauraceae) populations grown in the Aegean region/Turkey. Adv. Food Sci. 41(2):28–31.
- Sun, Y.L., H.M. Kang, S.H. Han, Y.C. Park, and S.K. Hong. 2015. Taxonomy and phylogeny of the genus citrus based on the nuclear ribosomal DNA ITS region sequences. Pak. J. Bot. 47(1):95–101.
- Taberlet, P., L. Gielly, G. Pautou, and J. Bouvet. 1991. Universal primers for amplification of three non-coding regions of chloroplast DNA. Plant Mol. Biol. 17(5):1105–1109. doi: 10.1007/BF00037152.
- Tamura, K., and M. Nei. 1993. Estimation of the number of nucleotide substitutions in the control region of mitochondrial DNA in humans and chimpanzees. Mol. Biol. Evol. 10:512–526. doi: 10.1093/oxfordjournals.molbev.a040023.
- Tamura, K., G. Stecher, D. Peterson, A. Filipski, and S. Kumar. 2013. MEGA6: Molecular evolutionary genetics analysis version 6.0. Mol. Biol. Evol. 30:2725–2729. doi: 10.1093/molbev/mst197.
- Thompson, J.D., D.G. Higgins, and T.J. Gibson. 1994. CLUSTALW: Improving the sensitivity of progressive multiple sequence alignment through sequence weighting, position-specific gap penalties and weight matrix choice. Nucleic Acids Symp. Ser. 22:4673–4680. doi: 10.1093/nar/22.22.4673.
- Verdian-rizi, M., and A. Hadjiakhoondi. 2008. Essential oil composition of Laurus nobilis L. of different growth stages growing in Iran. Zeitschrift Für Naturforschung C 63(11–12):785–788. doi: 10.1515/znc-2008-11-1201.
- Wei, W., L. HongLei, and C. ZhDuan. 2014. Analysis of plastid and nuclear DNA data in plant phylogenetics-evaluation and improvement. Life Sci. 57(3):280–286. doi: 10.1007/s11427-014-4620-7.
- Yeşiltaş, B.N., and O. Kolören. 2019. Molecular characterization of Sicyos species in Ordu and Giresun Provinces. Turk. J. Weed Sci. 22(1):37–44.