
 ?Mathematical formulae have been encoded as MathML and are displayed in this HTML version using MathJax in order to improve their display. Uncheck the box to turn MathJax off. This feature requires Javascript. Click on a formula to zoom.
ABSTRACT
The pectinase assisted extraction of Chironji fruit juice was carried out at different combinations of the concentration of pectinase (0.01–0.1 % w/w), temperature for incubation (30–50°C) and time of incubation (20–120 minutes). Conditions for obtaining maximum juice yield was established by deploying Response Surface Methodology (RSM), and Artificial Neural Network (ANN) combined with Genetic Algorithm (GA). The optimized conditions acquired through the RSM and ANN-GA technique predicted to yield 70.64% and 72.68% juice, respectively. The juice yield determined experimentally under RSM and ANN-GA optimized conditions were (70.73 ± 0.37) % and (72.52 ± 0.25) %, respectively. Based on the coefficient of determination (R2), absolute average deviation (AAD), and mean squared error (MSE) as well as on physicochemical properties of the juice extracted using optimized conditions, the ANN model was found to be better than RSM model.
Introduction
Chironji (Buchanania lanzan Spreng.) is an underused fruit tree species of socio-economic importance that belongs to the family of Anacardiaceae. It has been reported that the tree is originated in the Indian sub-continent (Malik et al., Citation2012). In the forests of Indian states of Maharashtra, Rajasthan, Chhattisgarh, Madhya Pradesh, Andhra Pradesh, Gujarat, Bihar, Jharkhand, and Odisha, the tree is commonly found and is known as achar, char, priyal, and charoli among the rural populace (Khatoon et al., Citation2015). The tree is also found in Australia, Myanmar, Pacific Islands, and Nepal. Seven species of the tree are reported in India, out of which Buchanania lanzan and Buchanania axillaris yield edible fruits (Siddiqui et al., Citation2016). The pulp of ripe fruit of Buchanania lanzan is usually consumed as raw and is delicious, having a sweet-sour taste (Sahu, Citation1998). During January and February, the fruit flowers, while it ripens in the month of May and June (Rajput et al., Citation2018). At ripening the fruit becomes black and contains about 39% pulp. The fruit pulp has been reported to contain approximately 0.67% fat, 1.27% crude fiber, 1.82% ash, 1.93% crude protein, and 20.51% carbohydrate (Sahu, Citation1998).
Since the fruit is edible, juice can be extracted from its pulp. During fruit juice extraction, depectinization using the pectinase enzyme is an important step to ensure the highest product quality and to obtain the maximum yield (Sharma et al., Citation2014). This enzyme disintegrates pectin-protein complexes by hydrolyzing pectin and facilitate easy access for the juice to extract out (Abdullah et al., Citation2007). Several studies have confirmed that utilization of pectinase enzymes for extraction can significantly increase the juice yield (Ghosh et al., Citation2016, Citation2017; Kambhampati et al., Citation2019; Lee et al., Citation2006; Mohanty et al., Citation2018). As far as pectinase enzyme is concerned, the concentration of enzyme, the temperature and time of incubation are some of the process parameters that influence the enzymatic assisted extraction process of juice. So these parameters need to be optimized to achieve maximum juice yield.
Response Surface Methodology (RSM) is a compilation of tools belonging to mathematics and statistics that are beneficial for numerous applications in engineering to model and optimize the processes, to analyze interactions among independent variables and dependent variables as well as to predict the dependent variables (Karabegović et al., Citation2013). Similarly, Artificial Neural Network (ANN) is a potent computing technique used for the modeling of the non-linear processes while Genetic Algorithm (GA) is an optimization tool based on the principle of biological evolution (Sivamani et al., Citation2019). ANN and RSM modeling provide varying benefits in the prediction and optimization capabilities of a particular process which leads researchers to make the comparison of the outcomes of both the techniques for better assessment of the investigated processes (Geyikçi et al., Citation2012). Therefore, this study aimed to optimize the process parameters using both RSM and combined ANN-GA technique to attain maximum yield of Chironji fruit juice along with analyzing the various physicochemical properties of the juice extracted using optimized conditions attained from both RSM and ANN-GA method.
Materials and Methods
Chironji Fruit Sample
Fresh Chironji fruits were purchased from the local market of Rourkela (22.2604° N, 84.8536° E), Odisha, India. Cleaning and washing of the sample were done manually after which they were packed in polythene bags and stored in the deep freezer at a temperature of −20°C for further experiments.
Design of Experiments
A rotatable central composite design (RCCD) was deployed to obtain the number of experiments to be carried out for the development of both RSM and ANN model. The RCCD design was prepared using the software Design Expert (11.0.5.0 version, Stat-Ease Inc.). The concentration of pectinase (X1), temperature for incubation (X2), and time of incubation (X3) were taken as the independent variable while juice yield (Y) was chosen as the dependent variable. presents the ranges of independent variables (coded and actual) that were decided on the basis of preliminary experiments. From the RCCD design, 20 number of experiments were obtained, of which six were center points. In , the results of all the 20 experiments that were conducted in triplicates are presented.
Table 1. Independent variables with their levels for rotatable central composite design
Table 2. RCCD experimental design with experimental, RSM predicted, and ANN predicted results of juice yield
The Extraction Process of Chironji Fruit Juice
The fruit samples were removed from the deep freezer and thawed for 2 hours prior to the experiments. Fruit pulp was obtained by removing the seed from the Chironji fruits. Then the fruit’s thick pulp was blended in a mixer grinder for 5 minutes. Since the blended pulp was also thick, water was needed to be added into it for extraction of juice. So some preliminary experiments were conducted by adding water into the pulp in the ratio (w/w) of 2:1, 1:1, and 1:2. The juice yield for all the three water-pulp mixtures was determined in the preliminary studies. Maximum juice yield was observed for the mixture containing water to pulp ratio of 2:1, whereas minimum juice yield was measured for the mixture having water to pulp ratio of 1:2. Thus the addition of water to the pulp in the ratio of 1:2 was ruled out, and only the ratios of 2:1 and 1:1 were considered. The physicochemical properties such as turbidity, viscosity, clarity, pH, total soluble solids, color, refractive index, antioxidant activity, and polyphenol were measured for the juices extracted from mixtures containing water to pulp ratio of 2:1 and 1:1. The physicochemical properties of the juice extracted from the mixture having water to pulp ratio of 1:1 were found to be better (data not reported) than that of the juice extracted from the mixture having water to pulp ratio of 2:1. Therefore, finally, water and pulp were mixed in the ratio of 1:1 for all 20 experiments based on preliminary results.
Pectinase from Aspergillus niger (EC 3.2.1.15, Enzyme activity: 8000–12,000 U/g, Hi-Media Lab, India) was used in this study. 100 g of water and pulp mix (1:1) were treated with pectinase according to the experiment design () for determining the juice yield. Pectinase in the range of 0.01 g to 0.1 g per 100 g of pulp alone was added. An orbital shaking incubator (REMI Laboratory Instrument, Mumbai, India) at 100 rpm was used for incubation at a particular combination of incubation time and temperature. The required temperature in the incubator was set as per the design of experiment before sample preparation. Once the temperature in the incubator reached the required level, the sample was prepared and kept in the incubator for the required time. Once the incubation was completed, the sample was removed from the incubator. Then, for inactivation of the pectinase, the suspension was held for 5 minutes at −2°C (Sandri et al., Citation2011). Finally, the juice was filtered using a doubled folded muslin cloth after which the juice yield was calculated using EquationEquation (1)(1)
(1) (Handique et al., Citation2019).
Response Surface Methodology
RSM was used to find the optimal condition of independent variables that varied on five levels. Juice yield was measured in triplicate, and for regression analysis, the mean values were taken. For the prediction of the optimum conditions, Design-Expert software (11.0.5.0 version, Stat-Ease Inc.) was used for analyzing the data and for developing a second-order polynomial model (EquationEquation (2)(2)
(2) ) for fitting the experimental data.
Where Y is the juice yield predicted by the RSM model, A0 is the intercept, Ai, Aii, and Aij are coefficients of linear, quadratic, and interaction model terms, respectively. Xi and Xj are the coded levels of the independent variables.
To evaluate the correctness of the developed polynomial model as well as for finding the significant model terms that influence the juice yield, the analysis of variance (ANOVA) was carried out.
ANN Modeling with GA Optimization
A feed-forward type ANN model was constructed using the Neural Network Fitting app (nftool) in MATLAB (Version R2018a, Academic license, MathWorks) for predicting the juice yield. The network contained an input layer having three neurons and a single neuron in one output layer. Also, only one hidden layer was chosen to construct the model to avoid the over-fitting issue. The single hidden layer’s number of neurons was selected by means of trial and error method. The hyperbolic tangent sigmoid (tansig) transfer function was selected for converting the input to the neurons of the hidden layer to its output while in case of the output layer linear (purelin) transfer function was taken. The Neural Network Fitting app uses a function named “mapminmax” that codes the input data to the range of −1 to 1, and the coded data are converted back into actual values after passing through the neurons of the output layer (Abidoye and Das, Citation2014). In this study, the network was trained by the Levenberg-Marquardt algorithm (trainlm) which is a type of back-propagation algorithm. For constructing the ANN model, 70% of the data were taken for training the model to obtain the neural network parameters while rest of the data were divided into 15% each for validation and testing of the model. After training was completed, the weights and bias values of the ANN model was obtained which were used in EquationEquation (3)(3)
(3) for predicting the juice yield (Y).
Where Xi is the independent input variables, U is the weights of lines between input and hidden layer, TH is the bias of neurons of the hidden layer, W is the weights of lines between output layer and hidden layer, and TO is the bias of neuron of output layer.
The GA was used to find the optimum condition of independent variables with the goal of achieving maximum juice yield. The constructed ANN model was used for the development of the fitness function (EquationEquation (4)(4)
(4) ). Since GA always minimizes the fitness function (Kalathingal et al., Citation2019), EquationEquation (4)
(4)
(4) was minimized, which resulted in the attainment of the optimization objective.
Where, F is the fitness function and Y is the juice yield predicted by ANN model during GA optimization.
The GA optimization was performed in optimization toolbox in MATLAB. The GA parameters that were selected for carrying out optimization in this study were double vector population type with the size of 50, feasible population creation function, rank fitness scaling function, roulette selection function, scattered crossover function with crossover fraction of 0.75, forward migration, and adaptive feasible mutation function. The GA solver guide in the optimization toolbox in MATLAB (Version R2018a, Academic license, MathWorks) was followed for selecting GA parameters. The population size of 50 was taken as the number of independent variables were less than five. The feasible population creation function creates a random initial population that satisfies the bounds of the independent variables. The rank fitness scaling function scales the raw scores based on the rank of each individual, rather than its score. The roulette selection function simulates a roulette wheel with the area of each segment proportional to its expectation. The algorithm then uses a random number to select one of the sections with a probability equal to its area. Migration is the movement of individuals between subpopulations. Migration takes place toward the last subpopulation during forward migration. The adaptive feasible mutation function randomly generates directions that are adaptive to the last successful or unsuccessful generation. A step length is chosen along each direction so that bounds are satisfied.
RSM and ANN Model Comparison
Based on three statistical parameters such as coefficient of determination (R2), mean squared error (MSE), and absolute average deviation (AAD), the RSM and ANN model were compared. The mathematical formulas for determining these parameters are given in the following equations (Tao et al., Citation2014).
Where Yi,p and Yi,e are the predicted and experimental value, respectively at the ith experiment. Ym is the mean of all experiment while n is the total number of experiments.
Physicochemical Properties of the Juice
Various physicochemical properties of the untreated juice (control sample), and the juice treated with pectinase at both RSM and ANN-GA optimized conditions were determined, and the results are presented in .
Table 3. Analysis of variance (ANOVA) for the quadratic model
Table 4. Validation of RSM and ANN-GA model
Table 5. Physicochemical properties of the untreated juice (control) and pectinase treated juice at optimized conditions (RSM and ANN-GA)
Analysis of TSS, RI, and pH
Benchtop digital refractometer (Model RFM 700, Bellingham and Stanley, UK) was used to analyze TSS content (expressed in degree Brix, °B) and refractive index (RI). A pH meter (Eutech, India) was used to measure the pH of the samples.
Analysis of Turbidity, Viscosity, and Clarity
A digital turbidity meter (Model 335, Deluxe Company, India) was used to analyze turbidity (expressed as Nephelometric Turbidity Units, NTU). A viscometer attached to an ultralow viscous adaptor (DV2TLV, Brookfield, USA) was used for viscosity analysis (expressed in centipoise, cP) and was measured at 25 ± 1°C. A UV–visible spectrophotometer (AU2701, Systronics India Ltd., India) was used to determine clarity by measuring the transmittance (% T) of the samples at 660 nm.
Analysis of Color
Color values such as L*, a*, and b* were analyzed using a Hunter Lab calorimeter (ColorFlex EZ, Reston, Virginia, USA). Total color change (ΔE) was also calculated using EquationEquation (8)(8)
(8) , as stated by Fernández-Vázquez et al. (Citation2014).
Analysis of Antioxidant Activity and Total Phenolic Content
The total phenolic content of the samples was analyzed using gallic acid as standard, according to the Folin-Ciocalteau method proposed by Silva et al. (Citation2015). A UV–visible spectrophotometer (AU2701, Systronics India Ltd., India) was used to measure the concentration of phenols at 650 nm and was expressed in mg of gallic acid equivalents (GAE) per 100 ml of juice.
The antioxidant activity (expressed as % DPPH scavenging activity) was measured according to Shekhar and Anju (Citation2014) by analyzing the percentage decrease in absorbance of the sample compared to control at 517 nm, using the EquationEquation (9)(9)
(9) .
Statistical Analysis
A Duncan homogeneity test was carried out using SPSS Statistics 23.0 (IBM Corporation) to find out any significant difference between the three samples.
Results and Discussion
RSM Modeling and Optimization
The independent variables with their actual levels, along with the results of both experimental and predicted juice yield, are provided in .The maximum yield of juice was attained at 0.08% (w/w) concentration of pectinase and 46°C temperature for incubation after 100 minutes of incubation time (run number 12). For the prediction of the juice yield, a polynomial model of second-order (EquationEquation (10)(10)
(10) ) was generated by employing a multiple nonlinear regression analysis of the experimental results.
Where Y is the juice yield, X1, X2, and X3 are the coded values of concentration of pectinase, temperature for incubation, and time of incubation, respectively.
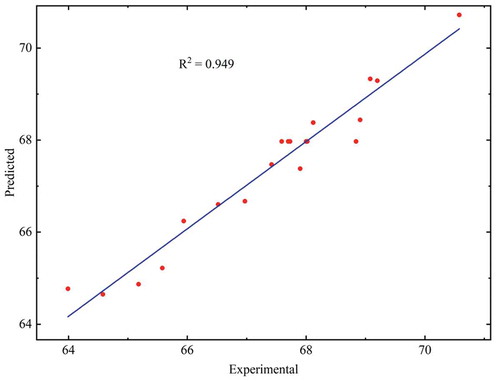
The outcomes of the ANOVA indicate the adequacy and significance of the developed model. In , the compiled results of the ANOVA for the quadratic model is provided. The model’s F-value of 20.64 suggested that the developed polynomial model was significant. There was a possibility of only 0.01% that, due to noise, an F-value greater than this could occur. The coefficient of determination (R2) and Adjusted R2 value were 0.9489 and 0.9029, respectively, that inferred a decent fit of the model to the experimental results (). Also, the difference between the predicted R2 (0.7309) and Adjusted R2 (0.9029) was lower than 0.2, which confirmed the reasonable agreement between them. Furthermore, the coefficient of variation of 0.7735% demonstrated the robustness of the generated model. The F-value of 1.63 of the lack of fit indicated that it was insignificant in relation to the pure error. A possibility of 30.33 % was there that F-value of lack of fit this big could occur as a result of noise. The model was further validated by this insignificant lack of fit.
Figure 1. RSM predicted vs. Experimental value of juice yield (%)
The impact of three independent variables (concentration of pectinase, temperature for incubation and time of incubation) on the juice yield was explained by means of the significant coefficient (p < .05) of the polynomial model of second-order. The p-value below 0.05 of the first-order linear effect along with the second-order quadratic effect of concentration of pectinase (X1 and X12) and time of incubation (X3 and X32) was indicative of the significant impact on the juice yield. The most crucial factor was the linear effect of time of incubation (X3), followed by the linear effect of concentration of pectinase (X1), the quadratic effect of time of incubation (X32) and concentration of pectinase (X12). Linear effects of X1 and X3 showed a positive impact on the juice yield, whereas their quadratic effects (X12 and X32) showed a negative impact. The interaction effect of independent variables (X1X2, X1X3, and X2X3) as well as the linear and quadratic effect of temperature for incubation (X2 and X22) was found to be insignificant.
The 3D response surfaces demonstrate how the interaction of independent parameters influences juice yield. shows the interaction of two independent parameters at a time while holding the third independent parameter at the center point.
Figure 2. Influence of interaction of independent variables on juice yield (%) (a) concentration of pectinase (% w/w) and temperature for incubation (°C), (b) concentration of pectinase (% w/w) and time of incubation (minutes), (c) temperature for incubation (°C) and time of incubation (minutes)
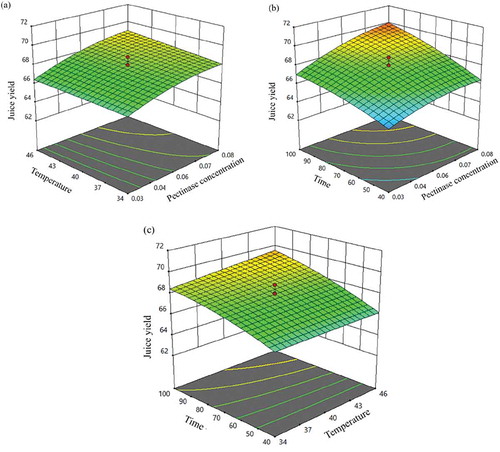
The graphs in illustrate that the juice yield increased with the increase in the concentration of pectinase. It was observed that the temperature for incubation did not have any substantial influence on juice yield. A similar observation was made by Handique et al. (Citation2019) while working on enzymatic extraction of banana juice. At 0.08% (w/w) concentration of pectinase and 46°C temperature for incubation, the juice yield was around 69%. Time of incubation had a significant effect on juice yield. With the increase in time of incubation, the juice yield increased. This is because, during the incubation period pectinase degrades pectin and releases the cell wall components into the juice (Sharma et al., Citation2014). Juice yield of about 70% was observed at 0.08% (w/w) concentration of pectinase and approximately 100 minutes time of incubation. It was found that the interaction of temperature for incubation and time of incubation did not significantly influence the juice yield.
Numerical optimization was executed to obtain the optimum combination of the concentration of pectinase, temperature for incubation, and time of incubation to get maximum juice yield. All three independent variables were kept in range, and the juice yield was maximized. The optimum combinations were obtained as 0.08% (w/w) concentration of pectinase, 45.8°C temperature for incubation, and 99.5 minutes time of incubation with a desirability value of 1. At these optimum conditions, the juice yield was predicted to be 70.64%.
ANN Modeling with GA Optimization
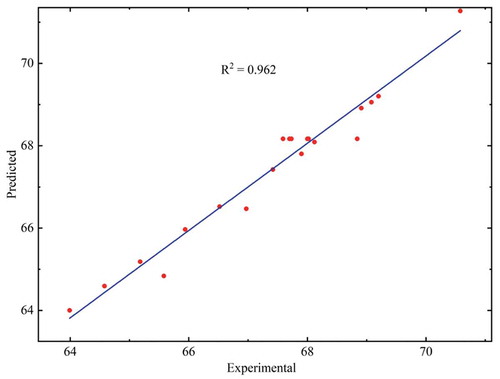
The juice yield predicted by the ANN model, which was trained with the Levenberg-Marquardt algorithm is presented in . By using trial and error method, eight neurons in the network’s single hidden layer were taken considering the minimum MSE and maximum R2 value for training, testing, and validation data set. Thus, the optimum ANN model’s architecture for predicting juice yield was three, eight, and one neuron in the input, hidden and output layer of the network, respectively. At epoch 3, the model’s finest validation performance was accomplished. The MSE value for the training, validation, and testing data set at this point were 0.049, 0.317, and 0.304, respectively. The lower MSE value confirmed the model’s accuracy for correct prediction. The R2 value for training, validation, and testing data set were 0.982, 0.973, and 0.975, respectively. This high R2 value of testing data set confirmed the high prediction ability of the developed ANN model for the unknown data. shows a regression plot for all data set. The R2 value of 0.962 for all data set suggested a good fit for the experimental data by the ANN model. The weights and bias values of the developed ANN model is given in EquationEquations (11)(11)
(11) –(Equation14
(14)
(14) ).
Figure 3. ANN predicted (all data set) vs. Experimental value of juice yield (%)
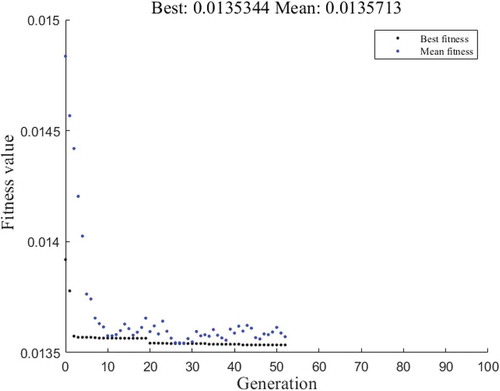
The developed ANN model was combined with GA for optimization of process parameters. shows the change in fitness value with the number of generation. After 52 generations, optimization was completed, and the optimum conditions were obtained as 0.09% (w/w) pectinase concentration, 48.7°C temperature for incubation, and 118 minutes time of incubation. At the optimized conditions, the juice yield predicted by the ANN model was 72.68%.
Figure 4. Change in fitness value with the change in the number of generations during GA optimization
Validation of RSM and ANN-GA Optimized Model
For validations of RSM and ANN-GA models, experiments were conducted in triplicates at optimized conditions, and the results are presented in . A paired t-test was carried out to find the significance (p < .05) between the predicted and experimental results. The p-value of 0.701 and 0.391 in RSM and ANN-GA model, respectively, confirmed that there was no significant difference between the predicted and experimental results at optimized conditions for both the models. At RSM optimized conditions, juice yield determined experimentally was 70.73 ± 0.37% while at ANN-GA optimized conditions, it was 72.52 ± 0.25%. The AAD for RSM and ANN-GA model at optimized conditions was found to be 0.4 % and 0.34%, respectively.
The juice yield for the untreated (control) sample was determined to find the percentage increase in the juice yield after pectinase assisted extraction at RSM and ANN-GA optimized conditions. The juice yield for the control sample was found to be 53.86 ± 0.45%. An increase of 16.87% and 18.66% in juice yield was achieved by using pectinase assisted extraction at RSM and ANN-GA optimized conditions, respectively.
RSM and ANN Model Comparison
The R2, MSE, and AAD were determined for comparing the RSM and ANN model. The value of R2 for RSM and ANN model (all data set) were 0.949, and 0.962, respectively. The higher R2 value of ANN model in comparison to the RSM model indicated the better predictive ability and accuracy for the ANN model. The MSE value for RSM and ANN model was 0.135, and 0.127, respectively, whereas the AAD was 0.433%, and 0.34% for RSM and ANN model, respectively. Both MSE and AAD for the ANN model was lesser than the RSM model. The results of all the three statistical parameters confirmed that both the models had good predictive ability and accuracy; however, the ANN model was found to be better than the RSM model.
Physicochemical Properties of the Juice
presents the various physicochemical properties of the control sample and juice extracted using RSM and ANN-GA optimized conditions.
Turbidity of the juice significantly reduced after pectinase treatment. There was a significant difference in turbidity of all three samples; however, a turbidity 91.333 ± 0.577 NTU was noted to be minimal in the ANN-GA optimized sample.
After pectinase treatment, the viscosity of the juice was lowered, and a substantial difference between the control sample and the pectinase treated sample was noted; however, there were no significant differences between the RSM and ANN-GA optimized samples. The RSM optimized sample was found to be less viscous with a viscosity of 1.273 ± 0.005 cP.
With pectinase treatment, the clarity of the juice increased, and significant differences between each of the three samples were observed. Highest clarity of 0.966 ± 0.057% T was measured in the ANN-GA optimized sample.
The pH of the juice reduced with the treatment of pectinase. No significant difference was observed between RSM and ANN-GA optimized samples; however, a substantial difference was noticed between the control sample and pectinase treated sample. Juice obtained under ANN-GA optimized conditions had a minimum pH of 4.06.
The juice’s total soluble solids (TSS) were improved with pectinase treatment. The maximum TSS of 14.466 ± 0.057 °Brix was recorded in ANN-GA optimized sample. There were considerable differences between the control sample and the sample treated with pectinase.
A significant difference in both L* and a* value was noted in all three samples. Between the control sample and optimized samples, b* value was found to be significantly different, but there was no significant difference observed between the RSM and ANN-GA optimized samples. L*, a*, and b* value was found to be maximum in the control sample while they were found to be minimum in ANN-GA optimized sample. A significant color change was observed between RSM and ANN-GA optimized samples. The maximum color change of 5.988 ± 0.094 was recorded in ANN-GA optimized sample.
The control sample’s refractive index and the sample treated with pectinase were found to be significantly different. With pectinase treatment, the refractive index increased; however, the refractive index of RSM and ANN-GA optimized sample were found to be same. A minimum refractive index of 1.353 was found for the control sample.
Antioxidant activity of the juice enhanced with the treatment of pectinase. Although there was a significant difference between the control sample and the sample treated with pectinase, there was no significant difference between optimized samples of RSM and ANN-GA. In the juice obtained under RSM optimized conditions, an antioxidant activity of 80.250 ± 0.803% in juice was found to be maximum.
A significant difference in polyphenol content between all three samples was observed. When the juice was extracted using RSM optimized conditions, the polyphenol content reduced to 92.853 ± 0.432 mg GAE/100 ml juice but when ANN-GA optimized conditions were used, the polyphenol content increased to 113.160 ± 0.427 mg GAE/100 ml juice.
These changes in the physicochemical properties are because; during the incubation period pectinase enzymes degrades pectin, which reduces the water-holding capacity of the cell and subsequently releases all the free water and the cell wall components into the juice (Sharma et al., Citation2014). The release of free water in to the juice leads to the decrease in turbidity, viscosity and increase in clarity. Further, the release of components such as sugars contribute to the increase in TSS. The increase in TSS content results in the reduction of refractive index of the juice. The release of bound phenolics during pectinase treatment results in the improvement in polyphenol content and antioxidant activity of the juice. These results are in concordance with previous studies proving that the degradation of pectin using pectinase enzyme can significantly reduce turbidity (Lee et al., Citation2006), viscosity, pH and increase TSS content (Handique et al., Citation2019), increase polyphenol content, and clarity (Sharma et al., Citation2014), and increase refractive index and antioxidant activity (Rinaldi et al., Citation2013).
Conclusion
In this study, Chironji fruit juice was extracted at different combination such as the concentration of pectinase, temperature, and time of incubation obtained from a rotatable central composite design. Response surface methodology and artificial neural network combined with genetic algorithm were deployed to find the optimum conditions of process parameters where maximum juice yield can be achieved. Both models fit the experimental data very well, which was confirmed from their R2 value of 0.949 for RSM model and 0.962 for ANN model. ANN model was found to be better than the RSM model based on the results of R2, MSE, and AAD value. The optimum conditions attained from RSM and ANN-GA methods were 0.08% and 0.09% (w/w) pectinase concentration, 45.8 and 48.7°C temperature for incubation, and 99.5 and 118 minutes of incubation time, respectively. An increase of 16.87% and 18.66% in juice yield was achieved by using the optimized conditions acquired from the RSM and ANN-GA method, respectively. The juice extracted using ANN-GA optimized conditions was found to have better physicochemical properties than the untreated juice and juice extracted using RSM optimized conditions.
References
- Abdullah, A.L., N. Sulaiman, M. Aroua, and M.M.M. Noor. 2007. Response surface optimization of conditions for clarification of carambola fruit juice using a commercial enzyme. J. Food. Eng. 81(1):65–71. doi: 10.1016/j.jfoodeng.2006.10.013.
- Abidoye, L.K., and D.B. Das. 2014. Artificial neural network modeling of scale-dependent dynamic capillary pressure effects in two-phase flow in porous media. J. Hydroinformatic. 17(3):446–461. doi: 10.2166/hydro.2014.079.
- Fernández-Vázquez, R., L. Hewson, I. Fisk, D.H. Vila, F.J.H. Mira, I.M. Vicario, and J. Hort. 2014. Colour influences sensory perception and liking of orange juice. Flavou 3(1):1. doi: 10.1186/2044-7248-3-1.
- Geyikçi, F., E. Kılıç, S. Çoruh, and S. Elevli. 2012. Modelling of lead adsorption from industrial sludge leachate on red mud by using RSM and ANN. Chem. Eng. J. 183:53–59. doi: 10.1016/j.cej.2011.12.019.
- Ghosh, P., R.C. Pradhan, and S. Mishra. 2016. Optimization of process parameters for enhanced production of Jamun juice using Pectinase (Aspergillus aculeatus) enzyme and its characterization. 3 Biotec. 6(2):241. doi: 10.1007/s13205-016-0561-0.
- Ghosh, P., R.C. Pradhan, and S. Mishra. 2017. Low‐temperature extraction of Jamun juice (Indian Black Berry) and optimization of enzymatic clarification using Box-Behnken design. J. Food Proces. Eng. 40:2. doi: 10.1111/jfpe.12414.
- Handique, J., S.J. Bora, and N. Sit. 2019. Optimization of banana juice extraction using combination of enzymes. J. Food Sci. Technol 56(8):3732–3743. doi: 10.1007/s13197-019-03845-z.
- Kalathingal, M.S.H., S. Basak, and J. Mitra. 2019. Artificial neural network modeling and genetic algorithm optimization of process parameters in fluidized bed drying of green tea leaves. J. Food Proces. Eng. doi: 10.1111/jfpe.13128.
- Kambhampati, V., S. Mishra, and R.C. Pradhan. 2019. Optimization of ultrasound‐assisted enzymatic extraction of Sohiong (Prunus nepalensis) juice. J. Food Proces. Eng. 42:1. doi: 10.1111/jfpe.12948.
- Karabegović, I.T., S.S. Stojičević, D.T. Veličković, N.Č. Nikolić, and M.L. Lazić. 2013. Optimization of microwave-assisted extraction and characterization of phenolic compounds in cherry laurel (Prunus laurocerasus) leaves. Separatio. Purificatio. Technol. 120:429–436. doi: 10.1016/j.seppur.2013.10.021.
- Khatoon, N., R.K. Gupta, and Y.K. Tyagi. 2015. Nutraceutical potential and phytochemical screening of Buchanania lanzan, an underutilized exotic Indian nut and its use as a source of functional food. J. Pharmacognos. Phytochem. 4(1):87–94.
- Lee, W., S. Yusof, N. Hamid, and B. Baharin. 2006. Optimizing conditions for hot water extraction of banana juice using response surface methodology (RSM). J. Food Eng. 75(4):473–479. doi: 10.1016/j.jfoodeng.2005.04.062.
- Malik, S., R. Chaudhury, N. Panwar, O. Dhariwal, R. Choudhary, and S. Kumar. 2012. Genetic resources of Chironji (Buchanania lanzan Spreng.): A socio-economically important tree species of central Indian tribal population. Genet. Resourc. Crop Evol. 59(4):615–623. doi: 10.1007/s10722-012-9801-2.
- Mohanty, S., S. Mishra, and R.C. Pradhan. 2018. Optimisation of enzymatic extraction and characterization of palm (Borassus flabellifer) juice. J. Food Meas. Charact. 12(4):2644–2656. doi: 10.1007/s11694-018-9882-5.
- Rajput, B.S., D. Gupta, S. Kumar, K. Singh, and C. Tiwari. 2018. Buchanania lanzan Spreng (Chironji): A vulnerable multipurpose tree species in Vindhyan region. J. Pharmacognos. Phytochem. 7(5):833–836.
- Rinaldi, M., A. Caligiani, R. Borgese, G. Palla, D. Barbanti, and R. Massini. 2013. The effect of fruit processing and enzymatic treatments on pomegranate juice composition, antioxidant activity and polyphenols content. LWT-food Sci. Technol. 53(1):355–359. doi: 10.1016/j.lwt.2013.02.015.
- Sahu, B.L. 1998. Effect of processing treatments on the quality characteristics of fruit pulp and seed Kernel of Chironji (Buchanania lanzan). JNKVV, Jabalpur, India.
- Sandri, I.G., R.C. Fontana, D.M. Barfknecht, and M.M. da Silveira. 2011. Clarification of fruit juices by fungal pectinases. LWT-food Sci. Technol. 44(10):2217–2222. doi: 10.1016/j.lwt.2011.02.008.
- Sharma, H.P., H. Patel, and S. Sharma. 2014. Enzymatic extraction and clarification of juice from various fruits–a review. Trend. Post Harve. Technol. 2(1):01–14.
- Shekhar, T.C., and G. Anju. 2014. Antioxidant activity by DPPH radical scavenging method of Ageratum conyzoides Linn. leaves. Am. J. Ethnomed. 1(4):244–249.
- Siddiqui, M.Z., A.R. Chowdhury, and N. Prasad. 2016. Evaluation of phytochemicals, physico-chemical properties and antioxidant activity in gum exudates of Buchanania lanzan. Proceedin. Nation. Acad. Sci. India Sec. B 86(4):817–822. doi: 10.1007/s40011-015-0539-4.
- Silva, S.F., C.A.R. Anjos, R.N. Cavalcanti, and R.M. Dos Santos Celeghini. 2015. Evaluation of extra virgin olive oil stability by artificial neural network. Food Chem. 179:35–43. doi: 10.1016/j.foodchem.2015.01.100.
- Sivamani, S., S. Selvakumar, K. Rajendran, and S. Muthusamy. 2019. Artificial neural network–genetic algorithm-based optimization of biodiesel production from Simarouba glauca. Biofuel 10(3):393–401. doi: 10.1080/17597269.2018.1432267.
- Tao, Y., D. Wu, Q.-A. Zhang, and D.-W. Sun. 2014. Ultrasound-assisted extraction of phenolics from wine lees: Modeling, optimization and stability of extracts during storage. Ultrason. Sonochem. 21(2):706–715. doi: 10.1016/j.ultsonch.2013.09.005.