
 ?Mathematical formulae have been encoded as MathML and are displayed in this HTML version using MathJax in order to improve their display. Uncheck the box to turn MathJax off. This feature requires Javascript. Click on a formula to zoom.
ABSTRACT
One of the most important requirements for cultivar identification in Vitis species is rapid and consistent genotyping using DNA-based markers. Genetic characterization and diversity of grapevine cultivars using molecular markers have been the subject of many studies. The Iranian grapevine biodiversity is one of the most important in the Middle East. In the present work, fourteen nuclear microsatellite markers were used to assess the genetic diversity and relationships among 25 local grapevine accessions collected from vine-growing areas of Qazvin province (Iran). A total of 81 distinct alleles were produced with amplified product sizes ranging from 91 to 432 bp. The number of observed alleles for each locus ranged from 2 (ISV3) to 9 (VVS3 and VVMD6), with the overall average of 5.79 allele per locus. The observed heterozygosity (Ho) ranged from 0.53 (ISV3) to 0.72 (VVSMD25), while the expected heterozygosity (He) varied between 0.49 (ISV3) and 0.87 (VVSMD25). The polymorphism information content (PIC) ranged between 0.50 for VVS3 and ISV3 to 0.87 for VVSMD25. However, Shannon’s information index (I) was found to be highest (2.13) in VVSMD25 locus, while the VVS3 locus had the lowest value with an average of 0.75 among SSR markers. According to Jaccard’s similarity coefficient and UPGMA algorithm, cluster analysis assigned the accessions into five groups. Despite similar names, the results revealed that the accessions belonged to different groups. The obtained PCoA scatter plots further strongly supported their UPGMA dendrogram results. Beside VVMD, VVS series of markers were also used in the present study and the results showed that these series of microsatellite markers were as efficient as VVMD series in terms of discrimination and polymorphism for studying grapevine cultivars. Among all the microsatellite loci, VVSMD25 (PID = 0.03, PIC = 0.87) was found to be the most informative among the accessions.
Introduction
Grapes (Vitis vinifera L.) are one of the most economically important horticultural crops in the world (FAO, Citation2017). There are more than 70 species in the Vitis genus from around the world, mostly distributed in tropical and temperate areas of the Northern Hemisphere (Dong et al., Citation2018). According to FAO, global cultivation area of grapes in 2017 was about 6931 thousand hectares with a global production of 74,276 tons and an average production of 1071 kg per hectare (FAO, Citation2017). The grapevine is grown in Iran over an area of more than 141,000 ha with a production of approximately 1.8 million tons (FAO, Citation2017). The grape genome size is estimated at approximately 500 Mbp, and it has a diploid genome with haploid chromosome number of 19 (Minio et al., Citation2017). They have a primarily temperate zone distribution, occurring extensively in the Northern Hemisphere. The cultivated species is Vitis vinifera L. ssp. sativa and its wild form Vitis vinifera L. ssp. sylvestris represents the only Vitis taxon naturally found (Emanuelli et al., Citation2013).
During the last few decades, the cultivated grapes have experienced another extreme decrease in genetic diversity, resulting in the reduction or even disappearance of many local grape genotypes (Emanuelli et al., Citation2013). Some cultivated varieties are old generated accessions that have been vegetatively multiplied for some parts and expanded in the whole world. In some areas the same accessions were renamed leading to synonyms (the same genotype under different names). Recently, there is a large but imprecise number of grapevine varieties in the world (This et al., Citation2006).
Accurate and reliable detection of grapevine accessions is of great importance for managing genetic resources, seedling certification by nursery owners, creating uniform vineyards, and selection of parents for controlled breeding. Moreover, there is limited information about the genetic resources and variation of grapevine in Iran. For this reason, it is of high importance to study local grapevine varieties and genotypes from the supposed primary domestication area and investigate the genetic relationships and kinship (Khadivi et al., Citation2017). Ampelography and biochemical markers (polymorphism of proteins and anthocyanins) have been used in the last decades to identify different cultivars of grapevine (Crespan et al., Citation1999). However, they have numerous basic constraints, for example ampelography is limited to complete growth and fruiting of plants, while grapevine plant materials are often exchanged as woody branches or cuttings, making their recognition impossible. Phenotype of plants is highly affected by environmental factors and plants’ nutritional and health status (especially viral infections). Different environments alter some of the traits and result in ampelography errors (Silvestroni et al., Citation1997).
Markers must prepare a remarkable discrimination power and yield rich genotype data in different labs and also be stable. It is especially significant in the case of grapevine that many varieties have been under cultivation for various places, and several molecular markers have been determined not to be perfectly stable in special old varieties, due to somatic mutation (Regner et al., Citation2006). After the year 2000 the microsatellite loci as locus-specific markers, based on variation in numbers of a repeated element of 1–6 bases, have been used to assess the genetic diversity, molecular-assisted breeding, and genetic characterization in many different plant species (Gupta and Varshney, Citation2000) including the grape (Cipriani et al., Citation2008, Citation2010; Dong et al., Citation2018; Emanuelli et al., Citation2013; Sefc et al., Citation2000). Grapevine genotyping is directly based on microsatellite markers or simple sequence repeats (SSR), which have been very beneficial not only for genetic distinguishing (Thomas et al., Citation1994) but for parentage analysis, too (Bowers and Meredith, Citation1997). These markers have some relevant advantages for research such as their highly informative, co-dominant, multi-allele genetic markers and high levels of polymorphism (Cipriani et al., Citation2010; Emanuelli et al., Citation2013). The efficiency of microsatellite markers in determining genetic relationships among various genotypes of grapevine and identifying synonym or homonym genotypes has already been verified previous works (Sabir et al., Citation2017), and identification of these grapes is of great importance in the conservation and management of genetic resources. The genetic diversity of wild and cultivated grapevine germplasm from the Mediterranean Basin and Central Asia was extensively investigated by a set of 20 nuclear SSR markers (Riaz et al., Citation2018). The results demonstrated the uniqueness and originality of this germplasm due to distinctive traits such as resistance to disease. Ebadi et al. (Citation2019) investigated the genetic and chloroplast variations of 35 Iranian grape genotypes and 10 European cultivars using 9 nSSR, 4 cpSSR, and 46 SNP markers. In this study, synonyms and homonyms cases were identified among the Iranian genotypes. Most Iranian genotypes were separated from European cultivars. Grouping of some Iranian genotypes with European grapevines in a cluster proposes that clonally propagated been exchanged probably from the Middle East to Europe or vice versa.
The present study was designed to investigate the characterization of genetic variation and accessions relatedness cultivated in vine-growing areas of Qazvin province (Iran) and to find their genetic similarities in order to use the results in breeding programs and maintaining genetic resources.
Materials and Methods
Plant Materials and Genomic DNA Extraction
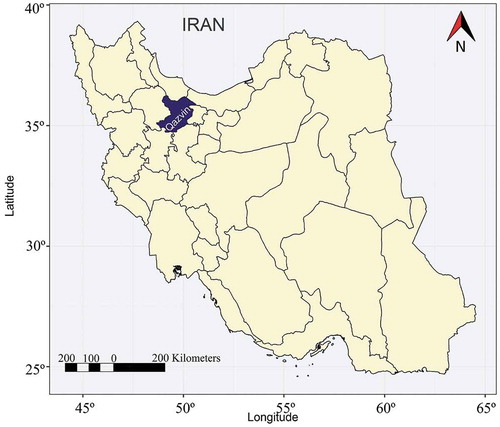
A total of 25 local grapevine samples were collected from an area of approximately 2,536 Km2 from the vineyards of Takestan County in Qazvin province (36°04ʹ11ʺN, 49°41ʹ45ʺE), which is one of the major grape-producing regions in Iran (). We collected fresh young leaves from each sample, which were dried in silica gel and stored at –80°C in liquid nitrogen for the following microsatellite molecular characterization. Detailed information regarding locations and codes of the study samples is shown in . Their DNA was extracted according to a combined method of Hanania et al. (Citation2004) and basic CTAB protocols. The optimized protocol in this study was based on elimination of the cytoplasmic contents of lysed cells in the early stages of DNA extraction. The quantity and quality of DNA samples were determined using 0.8% agarose-gel electrophoresis and NanoDrop 2000 UV–Vis spectrophotometer (Thermo Scientific, USA). For polymerase chain reaction (PCR), the samples were diluted to a 25 ng/μl after determining the concentration of DNA.
Table 1. List of grapevine accessions analyzed in the present study
Figure 1. Schematic map of Iran with collection sites for 25 grapevine accessions from Qazvin province. This map was produced using the ggplot2 package in R environment
Nuclear Microsatellite Characterization of Grapevine Accessions
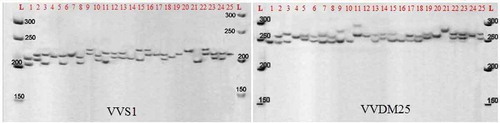
A total of 14 polymorphic microsatellite markers were used for evaluating allelic diversity in 25 grapevine accessions (). The following fourteen STMS loci were utilized: VVS1, VVS2, VVS3, VVS4, VVS5, ISV2, ISV3, and ISV4 (Thomas and Scott, Citation1993); VVMD6, VVMD8, VVMD24, and VVMD25 (Bowers et al., Citation1999, Citation1996); VrZAG25 (Sefc et al., Citation1999); Scu15vv (Arnold et al., Citation2002). PCR was performed in a reaction volume of 15 μl using microsatellite primers containing 1.5 ml of 10X PCR buffer (Fermentas, USA), 8.5 μl of sterile deionized water, 2 μl MgCl2 (25 mM), 0.6 μl dNTP mixture (5 mM), 1 μl of each primer (10 pM), 0.2 μl Taq DNA polymerase (5 U/ml), and 1 μl template DNA (25 ng/μl). PCR was run in a thermal cycler (Bio Rad, 170–8731, USA) with the following program: initial denaturation at 95°C for 4 min, first 10 cycles as touchdown (such that the annealing temperature was set at 10°C above primers melting temperature and reduced one degree in each cycle until reaching 10°C below primers melting temperature), 25 cycles of 95°C for 40 sec, 56°C for 30 sec, and 72°C for 45 sec, and final extension of 72°C for 3 min. A mixture of 10 μl PCR products and formaldehyde dye was loaded on 6% standard denaturing polyacrylamide gel (20 × 45 cm, 0.4 mm thick) and electrophorized (Bio Rad, squi-Gen GT, USA) with a voltage of 85 at 50°C for 40–60 min (depending on the length of loci), and then the gel was stained with silver nitrate method as described by Bassam et al. (Citation1991). shows an example for the profile of amplified product from grapevine accessions using VVS1 and VVDM25. The size of amplified DNA fragments was estimated with 100-bp ladders (Fermentas, USA).
Table 2. Information on microsatellite loci of the grapevine accessions used in this study including marker name, primer sequences, annealing temperature, and allele size range
Figure 2. Polyacrylamide gel profile of amplified product from 25 grapevine accessions using VVS1- and VVDM25-specific primers based on . L: Molecular ladder SMO313. The length of marker fragments is in base pairs (bp)
Analysis of Nuclear Microsatellite Data
Allele size and total number of alleles were determined for each nuclear microsatellite marker. Putative alleles were indicated by their estimated size in base pair (bp) and entered into a matrix in Microsoft Excel software. In the studied accessions, the alleles for each marker were denoted as a, b, and c, and the genetic distances of accessions were calculated using coefficients based on allele frequencies. The polymorphic information content (PIC) for each SSR loci was calculated as described by Botstein et al. (Citation1980) using the PowerMarker program version 3.25 (Liu and Muse, Citation2005).
where pi and pj are the frequencies of alleles i and j in the microsatellite locus, respectively.
Other summary statistics for each marker locus including observed heterozygosity (Ho), expected heterozygosity (He) and Shannon’s information index (I) which is the probability that two unrelated individuals will have the same genotype estimated on individual multilocus genotypes. All those statistics were calculated using GenAIEx software version 6.2 (Peakall and Smouse, Citation2006). To determine the similarity between the studied accessions, using the Numerical Taxonomy and Multiware Analysis System (NTSYS-pc) version 2.2 (Rohlf, Citation2006), cluster analysis was performed through UPGMA algorithm based on Jaccard’s similarity coefficient (Jaccard, Citation1908). Jaccard’s similarity coefficients was calculated using the SIMQUAL program in NTSYS-pc software, which is the common estimator of genetic identity and was calculated as follows: JC = NAB/(NAB + NA + NB), where NAB is the number of marker bands shared by two samples (A and B), and NA and NB represent the marker bands present only in sample A or B, respectively. Principal coordinate analysis (PCoA) of the Jaccard’s coefficient estimated were performed using DCENTER and EIGEN programs of NTSYS-pc version 2.2 software, and were visualized in ggplot2 package (Wickham et al., Citation2019). The probability of identity (PID) was computed according to the following formula:
The optimal number of clusters on the UPGMA dendrogram is determined by gap statistics (K) using R environment (R. Core Team, Citation2018) based on the genetic similarity matrix for microsatellite data (Tibshirani et al., Citation2001).
Results and Discussion
Nuclear Microsatellites Polymorphism among the Grapevine Accessions
Temperature of amplification (Ta) for fourteen nuclear microsatellite primers ranged from 47°C (VVS3) to 56°C (VVMD24 and VVMD25), and was used for generating SSR length polymorphism in grapevine accessions. All fourteen microsatellite primer pairs used in this study were polymorphic, of which 81 polymorphic alleles were amplified by different sizes, such that the number of alleles per locus was 2–9 with an average of 5.8 (, ). The size of amplified alleles ranged from 83 to 432 bp. An example of two of the band patterns generated by VVS1 and VVDM25 loci is shown in . The highest number of alleles belonged to VVS1 and VVMD25 primer pairs, each with 9 polymorphic alleles by different sizes, while ISV3 primer pairs had 2 alleles. Comparison of the present study with previous studies in grapevine, Liu et al. (Citation2014) reported the number of alleles detected by a single primer set to range from 6 to 12, with an average of 9 and Emanuelli et al. (Citation2013) using 22 microsatellite locus on 330 common accessions (109 Sativa, 110 Sylvestris and 111 Rootstocks) reported the average number of 22.7 alleles for per primer pairs (9–42 per locus). Since the average number of polymorphic alleles per microsatellite markers indicates the efficiency and appropriateness of that locus for estimating genetic diversity (Roder et al., Citation1998), those primers creating high numbers of polymorphic alleles are appropriate for studying genetic diversity. Through examining the relationship between the number of native species of vinifera in Peru and Argentina using 6 microsatellite loci, Martinez-Gomez et al. (Citation2003) reported 6–13 alleles per locus. Sefc and et al. (Citation2000) used 9 microsatellite markers to assess 164 grapevine cultivars and found 88 alleles with an average of 9.8 for each loci and a minimum and maximum number of 4 and 13 alleles for per primer pairs, respectively. The difference in the number of different alleles could be due to different numbers of genotypes and their different genetic basis.
Table 3. Summary of marker data revealed by fourteen microsatellite loci in 25 grapevine accessions collected from Iran
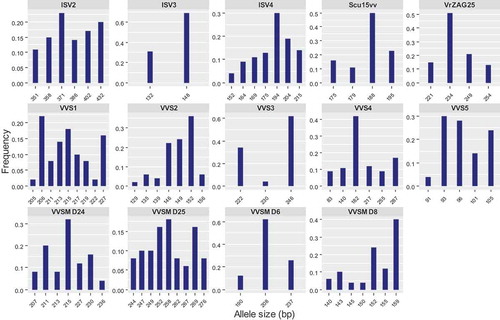
Figure 3. Distribution of allele frequencies for the loci of fourteen microsatellite markers studied to characterize 25 grapevine accessions. In each graph, horizontal axis represents the allele size (bp) for each microsatellite marker and vertical axis represents the observed allele frequency
The observed heterozygosity (Ho) ranged from 0.56 for VVS5 to 0.72 for VVSMD25, with an average of 0.65 whereas the expected heterozygosity (He) which reflects the probability of two random alleles difference of two accessions varied from 0.49 for ISV3 to 0.87 for VVSMD25, with the overall average was 0.70 (). Previous studies on microsatellite markers in grapevine reported a similar level of heterozygosity. In the survey of 20 SSR loci to determine of genetic structure among 1378 wild (V. vinifera spp. sylvestris) and cultivated (V. vinifera spp. sativa) samples, the observed and expected heterozygosity ranged from 0.535 (VVIn73) to 0.845 (VVIp31) and from 0.477 (VVIn73) to 0.803 (VVS2) respectively (Riaz et al., Citation2018). Moreover, in a set of six SSR markers from four cultivated populations of V. vinifera cv. containing 60 individuals, expected heterozygosity varied from 0.126 (VVMD7) to 0.790 (VVS2), with the overall average of 0.574 (Agar et al., Citation2012). da Silva et al. (Citation2015) reported that the numbers and frequencies of alleles in genetic diversity studies affect the marker heterozygosity. Compared to previous studies on the analysis of genetic diversity in Iranian grapes by microsatellite markers (Fatahi et al., Citation2003; Khadivi et al., Citation2017; Najafi et al., Citation2006; Ramezani et al., Citation2009), our results indicated higher He values. The large load of deleterious recessive mutations (Olmo, Citation1976) and habitat fragmentation and artificial selection pressure (Yaghuti et al., Citation2018) could be the reasons for higher Ho in this study. The mean major allele (most common) frequency was 0.40 and the 148-bp allele of locus ISV3 exhibited the highest major allele frequency (frequency = 0.69), and the 258-bp allele of locus VVSMD25 had the lowest major allele frequencies (frequency = 0.18). For other SSR markers, the most frequent alleles per locus were VVS1-206 (0.22), VVS2-152 (0.36), VVS3-246 (0.61), VVS4-182 (0.42), VVS5-93 (0.30), VVMD6-208 (0.62), VVSMD8-135 (0.40), VVSMD24-255 (0.32), VVSMD25-258 (0.18), ISV2-371 (0.23), ISV4-194 (0.30), VrZAG25-234 (0.51) and Scu15vv-188 (0.50). It is believed that other alleles have originated from a common allele. Moreno-Sanz et al. (Citation2008) studied 46 accessions from Spain using six SSR loci and also reported that allele frequencies greater than 40% were VVS2-147, VVMD27-185, VrZAG62-186, and VrZAG79-252.
Shannon’s information index ranged between 0.79 and 2.13 values. SSR VVSMD25 loci showed the highest value (2.13) and the lowest value (0.79) was detected in VVS3 loci with the average value of 1.49. The high value of Shannon’s information index for microsatellite loci indicates their effectiveness in establishing genetic relationship and diversity among accessions of grapevine. According to the SSR polymorphism of 43 grapevine accessions from Iran, Russia, and USA, Ramezani et al. (Citation2009) reported a range of 0.334 (VVS2) to 0.493 (SSrVrZAG21) with an overall value of 0.383 for Shannon’s information index, while Labagnara et al. (Citation2018) observed that Shannon’s information index varied from 1.536 (VrZAG79) to 2.049 (VVMD28) for 85 V. vinifera from ancient vineyards of Italy. Probability of identity values ranged between 0.03 for VVSMD25 to 0.34 for VVS3; they turned out to be higher than the threshold of 0.05 at which a microsatellite marker is considered hyper-polymorphic in grape (Sefc et al., Citation2000). The polymorphic information content (PIC) value determines the efficiency of each marker for reliable distinction. Based on their PIC, the most polymorphic loci were VVSMD25 (0.87) followed by VVS1 (0.85) and ISV3 (0.81), whereas VVS3 (0.50), ISV3 (0.50) and VVSMD6 (0.55) showed the lowest PIC (). Several studies on Vitis genus indicated that the most informative SSR markers included VVS2, VVMD5, VVS5, VVMD14, VVMD28, and VVMD36 (Agar et al., Citation2012; Borrego et al., Citation2001; Crespan and Milani, Citation2001; Ibañez et al., Citation2003; Lefort and Roubelakis-Angelakis, Citation2001).
Allele Frequency of Nuclear Microsatellite Markers
The highest rate of common allele frequency was seen in VVSMD6 marker (0.62) and the lowest in VVSMD25 (0.18). Thus, in the present study, all markers except for VVMD6 and VVS3 were highly informative and had a high discrimination power. This was reported by Najafi et al. (Citation2006) for VVMD6. However, VVS1 and VVMD25 had the highest polymorphism and the best discrimination. This was also reported for VVMD25 in Iranian cultivars by Najafi et al. (Citation2006). In terms of polymorphism level and high discrimination power, microsatellite loci of VVS2, VVS5, VVMD24, and VVMD8 were followed, respectively. Ten (12.3%) among the 81 polymorphic alleles detected in this study had a frequency lower than 0.05. The allele frequencies of fourteen microsatellite markers are displayed for each locus in . Allele frequencies revealed that not all markers were equally informative. The IVS3, VVS3, and VVSMD6 markers each had one allele with a much higher frequency than the other alleles (148 bp, 246 bp, and 208 bp, respectively). The VVS5 and VVSMD24 markers each had two alleles with high frequencies (96 bp −93 bp and 215 bp −211 bp, respectively).
UPGMA Clustering among the Grapevine Accessions
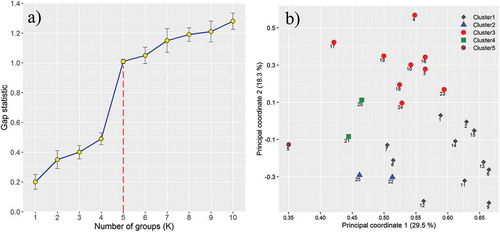
Using microsatellite loci data, a dendrogram was generated using UPGMA cluster analysis on based Jaccard’s similarity coefficient for the 25 grapevine accessions (). In addition, Jaccard’s similarity matrix was used to estimate the optimal number of clusters using analysis of gap statistics (K). The results of this analysis indicate a gap between K = 4 and K = 5 (a). This indicated that the UPGMA dendrogram can be clearly distinguished into five distinct groups based on the estimated gap statistics. The accession of ‘Ghoy Ozoum Habe Feshordeh’, presented the lowest similarity values compared to those from the groups and it was placed as a cluster individually. The most striking feature of the first group is alignment of two accessions of ‘Ghareh Ozoum Porrang’ and ‘Ghareh Ozoum Ablag (Dorang)’ in the same position revealing their synonymy. In fact, they share a single genotype known with different local names, despite their similar accessions. This situation occurs in accessions that are more similar in bunch morphology; however, they are considered as two different accessions because of their slight differences in grape size or color. In most cases, two accessions of ‘Asghari’ and ‘Bidaneh Sefid (Raisin)’ are considered very close by people and farmers, while based on the obtained dendrogram; the genotype of ‘Asghari’ has a greater distance from ‘Bidaneh Sefid’ and makes a subgroup with ‘Ghoghari Dirras.’ On the other hand, the genotype ‘Shirshireh‘ is closer to ‘Bidaneh Sefid‘ they constitute a distinct subgroup. Placement of ‘Ghoy Ozoum Habe Gerd’ and ‘Ghoy Ozoum’ ‘Poost Nazok’ suggests that in most cases, despite the perception of farmers and researchers who classify accessions according to their morphological characters, the apparent name does not often mean necessarily the same genetic content. In this group, instead of placing near ‘Ghareh Ozoum Habe Gerd,’ the genotype of ‘Gareh Ozoum Poost Nazok’ was placed at a farther distance, near ‘Ghareh Ozoum Kamrang.’ In addition, the genotype of ‘Ghareh Ozoum Kamrang’ in this group is placed in a farther distance from ‘Ghareh Ozoum Porrang’ and ‘Ghareh Ozoum Ablag (Dorang),’ further confirming this claim.
Figure 4. Cluster diagram for 25 grapevine accessions using microsatellite marker data based on Jaccard’s similarity coefficient and UPGMA algorithm
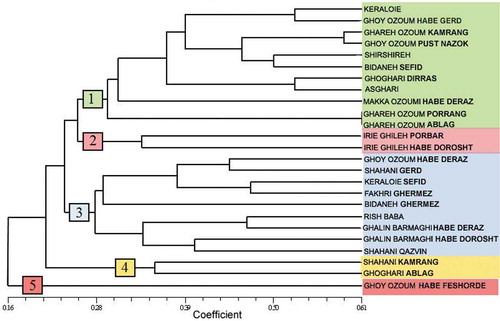
Figure 5. Grouping of grapevine accessions. (a) The gap statistic plot showed the optimal number of clusters. (b) Two-dimensional diagram plotted from principal coordinates analysis based on Jaccard’s distance matrix for genetic relationships of 25 grapevine accessions using microsatellites polymorphism data. The numbers at the front of any shape indicate the accession number. The color of the shapes indicates the five different groups identified through the UPGMA clustering
The second group comprised two accessions; ‘Irie Ghileh Porbar’ and ‘Irie Ghileh Habe Dorosht.’ According to the dendrogram, these accessions formed a group quite distinct from other accessions. This shows that some names of close and similar accessions were properly chosen and that genetic similarity arises from similar genetic content. The difference in nomenclature in fact reflects the actual difference of these accessions in their grape and bunch size. The similar pairs of accessions including ‘Ghalin Barmaghi Habe Deraz’ and ‘Ghalin Barmaghi Habe Dorosht,’ and ‘Shahani Gerd’ and ‘Shahani Qazvin’ are placed in the third group. However, similar accessions are close to each other and placed near other homonym accessions. ‘Ghalin Barmaghi Habe Deraz’ and ‘Rish Baba’ constitute a subgroup located shortly near ‘Ghalin Barmaghi Habe Dorosht.’ The fourth group consists of only two accessions; ‘Shahani Kamrang’ and ‘Ghoghari Ablag.’ As seen in the dendrogram, both accessions have also synonym accessions located in other groups. Thus, it can be argued that synonymy of some accessions based on morphological characters is not the reason for their similar genetic content. However, increasing the number of microsatellite loci with a proper distribution on chromosomes may also help to better discriminate the accessions. ‘Ghoy Ozoum Habe Feshordeh’ in group five, although having two synonym accessions in groups 1 and 3, is alone and away from all accessions. Nowadays, many cultivars have been removed from their origins and cultivated with various names in other places for different reasons such as immigration. This has led to the problem of homonyms with varied genetic constructs and synonyms with varied names, which has in practice created troubles for research and seedling certification (Dettweiler and Eibach, Citation2003).
Possible synonyms and homonyms of grapevine cultivars were identified in various ampelography and ampelometry studies, and microsatellite markers were used out to confirm these data. Crespan and Milani (Citation2001) used ampelography and molecular analysis of microsatellite markers for the identification of similar cultivars with different names in Italian grapevines. Although ‘Fresia’ and ‘Malvasia’ grapevine cultivars were showed to have some differences in terms of leaf size, middle lobe, and leaf shape through ampelography and ampelometry, but they were quite similar according to fingerprinting with microsatellite markers. Fatahi et al. (Citation2003) differentiated genotypes of 62 Iranian and American grapevines using nine microsatellite loci. Dendrogram obtained from molecular data attributed table and wine grapes and rootstocks to quite different groups. Homonym and synonym cultivars were also identified among Iranian cultivars. In fact, ‘Yaghoti Qasr,’ ‘Yaghoti Markaz,’ ‘Yaghoti Qazvin,’ and ‘Yaghoti Sefid Shiraz’ were the same cultivars named differently. In addition, the yields from the best selection of Siah grapevine including ‘Khoshnav’ and ‘Seyaveh’ had no differences. Using microsatellite markers, Doulati-Baneh et al. (Citation2013) identified synonyms among Iranian grapevine cultivars and found synonymy of ‘Moseli‘ and ‘SaghalSolian‘, ‘TabarzeSefid’ and ‘TabarzeQermez,’ ‘Dizamari’ and ‘Fakhri,’ ‘Khoshnav’ and ‘Rasha,’ and of ‘KeshmeshiSefid,’ ‘Rejin’ and ‘SefideShakhShakh.’ Migliaro et al. (Citation2019) identified 232 unique genotypes with the 22 polymorphic microsatellite markers among a collection of 379 rootstocks and non-vinifera accessions. Laiadi et al. (Citation2018) used nine nuclear SSR loci to clarifications and characterization of genetic diversity on 23 grape samples in northeastern Algeria, which they identified three cases of synonyms, ten cases of real duplication and four cases of homonymous in the collection grape cultivars.
Principal Coordinates Analysis among the Grapevine Accessions
For validation, the pattern-finding method of principal coordinates analysis (PCoA) was used which indicated good congruence with the pattern of UPGMA tree (b). The PCoA that revealed the distribution of the level of genetic variation in the sample of grapevine accessions evaluated showed five groups, almost similar to the results obtained by the UPGMA tree previously. The first coordinate of the studied accessions could only justify 29.5% of total variation and about 75% of total variation within the grapevine accessions was explained by the first 11 principal coordinates (not shown). Based on the results of PCoA analysis, ‘Ghareh Ozoum Kamrang’ accession showed the highest dissimilarity with other accessions.
The results of this study suggest that the used set of markers were greatly able to discriminate different accessions. High amount of mean PIC and low value of mean probability of identity (PI) for the studied accessions indicate also this point. Overall, microsatellite loci with PICs higher than 0.85 including VVS1 and VVSMD25 markers can be used as informative markers for rapid discrimination in vineyards and orchards of grapes. However, VVS3 and VVMD6 markers showed lower polymorphic percentage than the remaining microsatellite loci. Another important point was the use of VVS series of markers beside VVMD series and the results showed that they were as effective as VVMD series in terms of discrimination power and polymorphism rate for studying grapevine cultivars. The increasing number of microsatellite loci or using other molecular markers can help to verify the accuracy of our results.
Conclusion
According to the results, some names given to similar accessions usually based on grape appearance and color is sometimes correct and molecular analysis of accessions approves them. But sometimes, molecular analysis reveals the similarity of accessions that are differently named due to slight differences in grape color or shape. Even the apparent similarity of the accessions which result usually in synonymy is not a reason for their genetic similarity; hence it is important to be careful when studying synonym accessions. It was shown in the present study that ‘Ghareh Ozoum Porrang’ and ‘Ghareh Ozoum Dorang’ are in fact a single genotype. On the other hand, synonym accessions such as ‘Ghoy Ozoum,’ ‘Ghalin Barmaghi,’ ‘Shahani,’ and ‘Ghareh Ozoum Dorang’ are not specified in specific subtypes and are sometimes even in separate groups. The findings of this research helping to management and conservation these genetic materials and also identified the accessions with potential to be used in breeding programs for developing locally adapted cultivars.
Author’s Contribution
Farzan Taheri collected the leaf samples, conducted the microsatellite genotyping and wrote the manuscript. Hadi Darzi Ramandi analyzed the microsatellite data, drew the figures and wrote the manuscript.
Declaration of Interest
Declare conflicts of interest or state “The authors declare no competing interests”.
Literature Cited
- Agar, G., N. Yildirim, S. Ercisli, A. Ergul, and C. Yuksel. 2012. Determination of genetic diversity of Vitis vinifera cv. Kabarcik populations from the Coruh valley using SSR markers. Biochem. Genet 50:476–483. doi: 10.1007/s10528-011-9492-y.
- Arnold, C., M. Rossetto, J. Mcnally, and R.J. Henry. 2002. The application of SSRs characterized for grape (Vitis vinifera) to conservation studies in Vitaceae. Am. J. Bot. 89(1):22–28. doi: 10.3732/ajb.89.1.22.
- Bassam, B.J., G. Caetano-Anolles, and P.M. Gresshoff. 1991. Fast and sensitive silver staining of DNA in acrylamide gels. Anal. Biochem. 196:80–83. doi: 10.1016/0003-2697(91)90120-i.
- Borrego, J., I. Rodriguez, M.T. Andrés, J. Martin, J. Chavez, F. Cabello, and J. Ibáñez. 2001. Characterization of the most important Spanish grape varieties through isoenzyme and microsatellite analysis. Proc. Int. Symp. On Molecular Markers. Acta Hort. 546:371–375. doi: 10.17660/ActaHortic.2001.546.46.
- Botstein, D., R.L. White, M. Skolnick, and R.W. Davis. 1980. Construction of a genetic linkage map in man using restriction fragment length polymorphisms. Am. J. Hum. Genet. 32:314–331.
- Bowers, J.E., G.S. Dangl, and C.P. Meredith. 1999. Development and characterization of additional microsatellite DNA markers for grape. Am. J. Enol. Vitic. 50:243–246.
- Bowers, J.E., G.S. Dangl, R. Vignani, and C.P. Meredith. 1996. Isolation and characterization of new polymorphic simple sequence repeat loci in grape (Vitis vinifera L.). Genome 39:628–633. doi: 10.1139/g96-080.
- Bowers, J.E., and C.P. Meredith. 1997. The parentage of a classic wine grape, Cabernet Sauvignon. Nat. Genet 16(1):84–87. doi: 10.1038/ng0597-84.
- Cipriani, G., M.T. Marrazzo, G. Di Gaspero, A. Pfeiffer, M. Morgante, and R. Testolin. 2008. A set of microsatellite markers with long core repeat optimized for grape (Vitis spp.) genotyping. BMC Plant Biol. 8:127. doi: 10.1186/1471-2229-8-127.
- Cipriani, G., A. Spadotto, I. Jurman, G. Di Gaspero, M. Crespan, S. Meneghetti, E. Frare, R. Vignani, M. Cresti, M. Morgante, et al. 2010. The SSR-based molecular profile of 1005 grapevine (Vitis vinifera L.) accessions uncovers new synonymy and parentages, and reveals a large admixture amongst varieties of different geographic origin. Theor. Appl. Genet 121:1569–1585. doi: 10.1007/s00122-010-1411-9.
- Crespan, M., R. Botta, and N. Milani. 1999. Molecular characterization of twenty seeded and seedless table grape cultivars (Vitis vinifera L.). Vitis 38: 87–82.
- Crespan, M., and N. Milani. 2001. The muscats: A molecular analysis of synonyms, homonyms and genetic relationship within a large family of grapevine cultivars. Vitis 40:23–30.
- da Silva, T.A., L.B. Cantagalli, J. Saavedra, A.D. Lopes, C.A. Mangolin, M.F.P.S. Machado, and C.A. Scapim. 2015. Population structure and genetic diversity of Brazilian popcorn germplasm inferred by microsatellite markers. Electron. J. Biotechn. 18(3):181–187. doi: 10.1016/j.ejbt.2015.03.005.
- Dettweiler, E., and R. Eibach. 2003. The two Vitis databases as tools for germplasm management Vitis international variety catalogue and European Vitis database. Acta Hort. 603:505–509. doi: 10.17660/ActaHortic.2003.603.66.
- Dong, J., W. Liu, X. Li, W. Tan, O. Zhao, M. Wang, R. Ren, X. Ma, and X. Tang. 2018. Genetic relationships of 34 grapevine varieties and construction of molecular fingerprints by SSR markers. Biotechnol. Biotechnol. Equip. 32(4):942–950. doi: 10.1080/13102818.2018.1450162.
- Doulati-Baneh, H., S.A. Mohammadi, and M. Labra. 2013. Genetic structure and diversity analysis in Vitis vinifera L. cultivars from Iran using SSR markers. Sci. Hortic 160:29–36. doi: 10.1016/j.scienta.2013.05.029.
- Ebadi, A., N. Ghaderi, and Y. Vafaee. 2019. Genetic diversity of Iranian and some European grapes as revealed by nuclear and chloroplast microsatellite and SNP molecular markers. J. Hortic. Sci. Biotech. 94(5):599–610. doi: 10.1080/14620316.2019.1585210.
- Emanuelli, F., S. Lorenzi, L. Grzeskowiak, V. Catalano, M. Stefanini, M. Troggio, S. Myles, J.M. Martinez-Zapater, E. Zyprian, F.M. Moreira, et al. 2013. Genetic diversity and population structure assessed by SSR and SNP markers in a large germplasm collection of grape. BMC Plant Biol. 13:39. doi: 10.1186/1471-2229-13-39.
- FAO. 2017. FAO production yearbook of the United Nation. http://faostat.fao.org/faostat.
- Fatahi, R., A. Ebadi, N. Bassil, S.A. Mehlenbacher, and Z. Zamani. 2003. Characterization of Iranian grapevine cultivars using microsatellite markers. Vitis 42:185–192.
- Gupta, P.K., and R.K. Varshney. 2000. The development and use of microsatellite markers for genetic analysis and plant breeding with emphasis on bread wheat. Euphytica 113(3):163–185. doi: 10.1023/A:100391081.
- Hanania, U., M. Velcheva, N. Sahar, and A. Perl. 2004. An improved method for isolating high-quality DNA from Vitis vinifera nuclei. Plant Mol. Bio. Rep. 22:173–177. doi: 10.1007/BF02772724.
- Ibañez, J., M.T. Andrés, A. Molino, and J. Borrego. 2003. Genetic study of key Spanish grapevine varieties using microsatellite analysis. Am. J. Enol. Vitic. 54:22–30.
- Jaccard, P. 1908. Nouvelles recherches sur la distribution florale. Bull. Soc. Vaud. Sci. Nat. 44:223–270.
- Khadivi, A., A. Gismondi, and A. Canini. 2017. Genetic characterization of Iranian grapes (Vitis vinifera L.) and their relationships with Italian ecotypes. Agroforest Syst. 93(2):435–447. doi: 10.1007/s10457-017-0134-1.
- Labagnara, T., C. Bergamini, A.R. Caputo, and P. Cirigliano. 2018. Vitis vinifera L. germplasm diversity: A genetic and ampelometric study in ancient vineyards in the South of Basilicata region (Italy). Vitis 57:1–8. doi: 10.5073/vitis.2018.57.1-8.
- Laiadi, Z., M. Rahali, and H. Achour. 2018. Molecular clarifications of grapevine identities in Algerian germplasm collections using microsatellite markers. Jordan J. Biol. Sci. 12(3):317–322.
- Lefort, F., and K.K.A. Roubelakis-Angelakis. 2001. Genetic comparison of Greek cultivars of Vitis vinifera L. by nuclear microsatellite profiling. Am. J. Enol. Vitic 52:101–108.
- Liu, K.J., and S.V. Muse. 2005. PowerMarker: An integrated analysis environment for genetic marker analysis. Bioinformatics 21:2128−2129. doi: 10.1093/bioinformatics/bti282.
- Liu, C., X. Fan, J. Jiang, D. Guo, H. Sun, Y. Zhang, and J. Feng. 2014. Genetic diversity of Chinese wild grape species by SSR and SRAP markers. Biotechnol. Biotechnol. Equip. 26(2):899–2903. doi: 10.5504/BBEQ.2011.0146.
- Martinez-Gomez, P., D. Arulsekar, S. Potter, and T.M. Gradziel. 2003. An extended inter-specific gene pool available to peach and almond breeding as characterized using simple sequence repeat (SSR) markers. Euphytica 131:313–322. doi: 10.1023/A:1024028518263.
- Migliaro, D., G. De Lorenzis, G.S. Di Lorenzo, B. De Nardi, M. Gardiman, O. Failla, L. Brancadoro, and M. Crespan. 2019. Grapevine non-vinifera genetic diversity assessed by SSR markers as a starting-point for new rootstock breeding programs. Am. J. Enol. Vitic. Ajev. 2019:18054. doi: 10.5344/ajev.2019.18054.
- Minio, A., J. Lin, B.S. Gaut, and D. Cantu. 2017. How single molecule real-time sequencing and haplotype phasing have enabled reference-grade diploid genome assembly of wine grapes. Front. Plant Sci. 8:826. doi: 10.3389/fpls.2017.00826.
- Moreno-Sanz, P., B. Suárez, and M.D. Loureiro. 2008. Identification of synonyms and homonyms in grapevine cultivars (Vitis vinifera L.) from Asturias (Spain). J. Hortic. Sci. Biotechnol. 83(6):683–688. doi: 10.1080/14620316.2008.11512444.
- Najafi, J., B. Ghareyazie, S.A. Mohammadi, A. Hagh Nazari, and P. This. 2006. Genetic diversity of Iranian and some of European grapes revealed by microsatellite markers. Iran. J. Biotechnol. 4:36–44.
- Olmo, H.P. 1976. Grape, p. 294–298. In: N.W. Simmonds (ed.). Evol crop plant. Longman, London.
- Peakall, R., and P.E. Smouse. 2006. GENALEX 6: Genetic analysis in Excel. Population genetic software for teaching and research. Mol. Ecol. Notes 6:288–295. doi: 10.1093/bioinformatics/bts460.
- R Core Team. 2018. R: A language and environment for statistical computing. R Foundation for Statistical Computing, Vienna, Austria. http://www.R-project.org/.
- Ramezani, A., R. Haddad, and M. Dorostkar. 2009. Genetic diversity of grapevine accessions from Iran, Russia and USA using microsatellite markers. Pak. J. Biol. Sci. 12:152–157. doi: 10.3923/pjbs.2009.152.157.
- Regner, F., R. Hack, and J.L. Santiago. 2006. Highly variable Vitis microsatellite loci for the identification of Pinot Noir clones. Vitis 45(2):85–91.
- Riaz, S., G. De Lorenzis, D. Velasco, A. Koehmstedt, D. Maghradze, Z. Bobokashvili, M. Musayev, G. Zdunic, V. Laucou, M.A. Walker, et al. 2018. Genetic diversity analysis of cultivated and wild grapevine (Vitis vinifera L.) accessions around the Mediterranean basin and Central Asia. BMC Plant Biol. 18:137. doi: 10.1186/s12870-018-1351-0.
- Roder, M.S., V. Korzun, K. Wendehake, J. Plaschke, M.H. Tixier, and M.W. Gamal. 1998. A microsatellite map of wheat. Genetics 149:2007–2023.
- Rohlf, F. 2006. NTSYSpc: Numerical taxonomy system (ver. 2.2). Exeter Publishing, Ltd, Setauket.
- Sabir, A., H. Ikten, N. Mutlu, and D. Sari. 2017. Genetic identification and conservation of local Turkish grapevine (Vitis vinifera L.) genotypes on the edge of extinction. Erwerbs-Obstbau 60(1):31–38. doi: 10.1007/s10341-017-0335-9.
- Sefc, K.M., M.S. Lopes, F. Lefort, R. Botta, K.A. Roubelakis-Angelakis, J. Ibáñez, I. Pejic, H.W. Wagner, J. Glössl, and H. Steinkellner. 2000. Microsatellite variability in grapevine cultivars from different European regions and evaluation of assignment testing to assess the geographic origin of cultivars. Theor. Appl. Genet. 100:498–505. doi: 10.1007/s001220050065.
- Sefc, K.M., F. Regner, E. Turetschek, J. Glossl, and H. Steinkellner. 1999. Identification of microsatellite sequences in Vitis riparia and their applicability for genotyping of different Vitis species. Genome 42:367–373. doi: 10.1139/g98-168.
- Silvestroni, O., D.D. Pietro, C. Intrieri, R. Vignani, and M. Crestl. 1997. Detection of genetic diversity among clones of cv. Fortana (Vitis vinifera L.) by microsatellite DNA polymorphism analysis. Vitis 336:147–150.
- This, P., T. Lacombe, and M.R. Thomas. 2006. Historical origins and genetic diversity of wine grapes. Trends Genet. 22(9):511–519. doi: 10.1016/j.tig.2006.07.008.
- Thomas, M.R., P. Cain, and N.S. Scott. 1994. DNA typing of grapevines: A universal methodology and database for describing cultivars and evaluating genetic relatedness. Plant Mol. Biol. 25:939–949. doi: 10.1007/BF00014668.
- Thomas, M.R., and N.S. Scott. 1993. Microsatellite repeats in grapevine reveal DNA polymorphisms when analyzed as sequence tagged sites (STSs). Theor. Appl. Genet. 86:985–990. doi: 10.1007/BF00211051.
- Tibshirani, R., G. Walther, and T. Hastie. 2001. Estimating the number of clusters in a data set via the gap statistic. J. R. Stat. Soc. B. (Stat. Methodol.) 63:411–423. doi: 10.1111/1467-9868.00293.
- Wickham, H., W. Chang, L. Henry, T.L. Pedersen, K. Takahashi, C. Wilke, and K. Woo. 2019. ggplot2: Create elegant data visualisations using the grammar of graphics. R package version 3.1.1. 7 April 2019. https://cran.r-project.org/package=ggplot2.
- Yaghuti, A.A., A. Movahedi, K. Mohammadi, Q. Zhuge, and H. Li. 2018. Genetic diversity among a collection of L. chinense germplasm analyzed with SSR markers. J. Biochem. Microb. Toxicol 1(1):102.