
ABSTRACT
Strawberries are an economically important crop partly because they are very popular with consumers. Strawberry growers and breeders would benefit from knowing which cultivars and fruit traits consumers would prefer. The objectives of this study were to (1) determine consumer preference for the fruit of once-fruiting and repeat-fruiting strawberry cultivars available to grow in the Mid-Atlantic to help growers select the most suitable strawberry cultivars based on their marketability, critical sensory quality attributes, and physicochemical measurements; and (2) identify interrelationships between sensory attributes and physicochemical measurements to determine which approaches might result in breeding strawberries consumers will find most appealing. Strawberries from 10 cultivars were harvested and evaluated by a trained sensory panel and instrumentally. ‘Flavorfest’ fruits were rated highest of all 10 cultivars, and ‘Albion’ fruits were rated highest of the repeat-fruiting cultivars. Overall quality was correlated with sweetness and strawberry flavor and aroma, but not sourness. Separation of cultivar means for sweetness was better using an instrument to measure, rather than the panel evaluation. Overall appearance was correlated with visual freshness and glossiness. Light orange-red strawberries (higher L* and b*) appeared fresher and more appealing to the panels than darker more purple-red strawberries. Evaluations of strawberry fruits for berry size, juiciness, and texture were less straightforward.
Strawberries (Fragaria ×ananassa Duchesne ex Rozier) are an economically important crop in the US. At 2.3 billion US dollars, the 2014 USD strawberry crop was third-most valuable among non-citrus fruits (USDA-NASS, Citation2017). They also are a valuable crop for growers at a national average of 110,051 USD gross per hectare, ranging from 20,626 USD per hectare in Oregon to 119,816 USD in California (USDA-National Agricultural Statistics Service, Citation2017). The high value of strawberries is due in part to their popularity. Strawberries ranked as the fifth most purchased fresh-market fruit in the US (USDA-ERS, Citation2012), with annual per capita consumption increasing steadily from 2.1 to 3.6 kg from 2002 to 2013 (USDA-ERS, Citation2016, Citation2012; NASS, Citation2017). Although most US production is on the West Coast, strawberries are grown in winter in Florida, and in nearly every state for local direct sale.
Strawberry production in the Mid-Atlantic is almost exclusively for direct market to consumers. They are important as an early crop to start drawing customers to these growers’ farms and farm markets. Growers in the Mid-Atlantic use mostly once-fruiting cultivars referred to in the nursery industry as “June-bearing” or “short-day” cultivars. Typical production lasts three to four weeks, yet consumers purchase fresh strawberries all year long (USDA-National Agricultural Statistics Service, Citation2017). Mid-Atlantic growers using low tunnels can expand their production season by up to nine months (Lewers et al., Citation2017b) using cultivars that produce fruit repeatedly from spring through fall, and which are referred to in the nursery industry as “dayneutral” cultivars.
Research on the eating quality of strawberries from both once-fruiting and repeat-fruiting cultivars grown in the Mid-Atlantic could help growers select cultivars their customers will like. Preference testing of strawberry cultivars is more informative when conducted using both sensory (trained consumer panels) and physicochemical analyses. The objectives of this study were to (1) determine consumer preference of once-fruiting and repeat-fruiting strawberry cultivars available to grow in the Mid-Atlantic to help growers select the most suitable strawberry cultivars based on their marketability, critical sensory quality attributes, and physicochemical measurements; and (2) identify interrelationships between sensory attributes and physicochemical measurements to determine which approaches might result in breeding strawberries consumers will find most appealing.
Materials and Methods
Cultivars
Fruits from 10 strawberry cultivars were evaluated for fruit quality. Five were day-neutral cultivars: Albion (USPP16228P3), Monterey (USPP19767P2), Portola (USPP20552P3), San Andreas (USPP19975P2), and Seascape (USPP7614P). Five were short-day cultivars: Allstar (Galletta and Draper, Citation1981), Chandler (US PP05262), Earliglow (Scott and Draper, Citation1975), Flavorfest (Lewers et al., Citation2017a), and NJ99-204-1 (Rutgers Scarlet™; USPP 27,587). The dayneutral cultivars plus ‘Chandler’ were developed by the University of California strawberry breeding program. Rutgers Scarlet™ was developed by Rutgers University in New Jersey. The remaining three cultivars were developed by the USDA strawberry breeding program at Beltsville, Maryland.
Fruit Production, Harvesting, Transport, and Storage
The day-neutral cultivars were grown near Beltsville, MD, on raised beds with two trickle-irrigation lines and covered with white-on-black plastic mulch and low tunnels (Condori et al., Citation2017; Lewers et al., Citation2017b). Dormant bare-root plants (Lassen Canyon Nursery, Redding, CA) of each cultivar were planted in Apr. 2017, in 12 six-plant plots distributed across six beds, with two complete blocks of all five cultivars, randomly assigned to six-plant plots, planted in each bed. Soil pH before making the beds was 6.8. Plants were fertilized weekly with 5.6 kg·ha–1 nitrogen for the first month then 3.4 kg·ha–1 when plants were actively growing. No fungicides were used. Fruit were harvested from June through Dec. 2017. Then, tunnel sides were raised and irrigation stopped to allow plants to become dormant through winter. Tunnel sides were lowered again early Mar. 2018, with irrigation and fertigation. Harvest resumed twice weekly starting early May. Undamaged fruits harvested on 17 May and 21 May were bulked by cultivar and transported in air conditioning 5 min to where they were stored at 1°C for one to two days before use.
The short-day cultivars were grown near Queenstown, MD, on raised beds with a single trickle-irrigation line and covered with black plastic mulch. Prior to making the beds, 16-8-8 fertilizer, at 448 kg·ha–1, was broadcast applied and disk incorporated into soil of 6.4 pH. Strawberry plug plants (KubePak, Allentown, NJ) were planted in Sept. 2017, and all cultivar plots (10 plants per plot) were planted in a randomized complete block design. An over-wintering row cover (Dupont Typar T-518, 40.7 g·m−2, Newark, DE) was deployed in Nov. 2017 and removed just prior to first bloom on 3 Apr. 2018. Spring fertilizer applied through the trickle-irrigation line included; 16.8 kg·ha–1 nitrogen as urea, 129 kg·ha–1 potassium nitrate, and 129 kg·ha–1 calcium nitrate. Between 11 May and 19 May, it rained every day for over 18 cm of rain. To control fruit rots, fungicides were applied. Before the final harvest, five applications of Captan 4 L (Loveland Products Greenley, CO) were made, and one application each was made of Elevate 50 WDG (Arysta LifeScience Cary, NC), Pristine (BASF, Research Triangle, NC), and Switch 62.5 WG (Syngenta Greensboro, NC). Fruit were harvested twice weekly, and fruit harvested on 16 May and 21 May were sorted to include only fruits that were fully ripe (by color) and did not exhibit visible water damage. These were placed in cardboard flats two to three berries deep, removed to a shaded structure to cool then transported in air conditioning 40 min to Beltsville, where they were stored at 1°C for one to two days before use.
Sample Preparation
For each harvest date, strawberries from each cultivar were selected to be undamaged and evenly ripe (color). Fruits from each cultivar were stored in Pactiv® Deli plastic containers with lids (Lake Forest, IL, USA) for one day at 5°C under aerobic conditions. Two hours prior to each sensory-panel evaluation, the strawberries were processed at room temperature (approximately 22°C). During this period, strawberries destined for sensory evaluation were rinsed in tap water and air-dried on paper towels. Some of the strawberries were left whole for evaluation. Some were cut longitudinally with each half having half the calyx. Whole fruit and halved fruits were sorted for evaluation. Ten whole fruits and ten halved fruits, per cultivar, per session, were used in sensory evaluations by the ten trained panelists, one whole and one half fruit per panelist per cultivar. Ten additional halved fruits plus 20 whole fruits per cultivar per session were measured instrumentally for color and texture. These same halved and whole fruits were then measured individually for soluble solids content (SSC). These fruits were then combined each session to measure titratable acidity (TA) for 1 puree per cultivar per session.
Sensory Evaluation
Four sensory sessions with a 10-member trained panel were conducted in early May 2018 to evaluate the 10 strawberry cultivars from the USDA-ARS Beltsville and UMD-WREC growing locations. Four sensory sessions were held, and each session had the same 10 participants.
Descriptive Analysis Training
Panel members (four females, six males) were recruited from USDA research employees with prior training and knowledge of descriptive analysis techniques for fresh produce. Participants were volunteers between 18 and 50 years of age and generally liked strawberries before the training. Prior to the sensory sessions, additional trainings were provided to explain the descriptive and scaling features that were unique to this study. Specifically, basic taste and aroma trainings were provided to panelists to clearly define differences in the intensity of color, texture, flavor, and mouth-feel factors. Various types of foods were used as references to identify and define appropriate descriptors of various strawberry attributes during three sessions. Produce used included apple (‘Granny Smith’), avocado, banana, blackberry, carrot, cucumber, grape, honeydew melon, kiwi, lemon, mushroom, orange, raspberry, strawberry (green, ripe, and over-ripe), and watermelon. Juices used included “Dole 100% Orange Peach Mango Juice,” “Dole 100% Orange Strawberry Banana Juice” (Dole Packaged Foods LLC, Thousand Oaks, CA), “Mistic Kiwi Strawberry” (Keurig Dr Pepper, Burlington, MA), “100% Grapefruit Juice” (Ocean Spray, Middleborough, MA), “Hawaiian Punch Fruit Juicy Red Drink Mix” (Keurig Dr Pepper, Burlington, MA), and “100% Grape Juice” (Welches, Concord, MA). Other foods used were “Yoplait Original Yogurt, Strawberry” (General Mills, Minneapolis, MN), “Strawberry Newtons” (Nabisco, East Hanover, New Jersey), and “Smucker’s Strawberry Jam” (J. M. Smucker Co, Orrville, OH).
Five types of training, two 1-h sessions each, were provided (Meilgaard et al., Citation1999). First, panelists were trained in image and scaling then practiced rating color, shape, and size with purchased strawberries using a line scale with references, and a point system. Panelists were taught strawberry fruit anatomy. Strawberry color training used a color chart created for this study. The “red” colors chosen as references were obtained from the website, https://commons.wikimedia.org/wiki/File:Color_icon_red.svg, and printed on paper. Next, panelists were trained to understand texture terminology, then practiced rating texture with purchased strawberry samples (). Then, panelists were trained to evaluate flavor and aroma, and practiced with purchased strawberries (). Panelists also were trained in descriptive analyses using a quality score system (do Nascimento Nunes, Citation2015). Finally, in accordance with previous studies (Bett-Garber et al., Citation2003; Gunness et al., Citation2009; Harker et al., Citation1997; Lester and Saftner, Citation2008; Park et al., Citation2018; Saftner et al., Citation2006; Schwieterman et al., Citation2014; Threlfall et al., Citation2016; Vallone et al., Citation2013), using skills developed in the four previous types of training, panelists helped develop a ballot for the evaluation by selecting 25 attributes they determined were key to their understanding of all quality traits. Then, they selected bi-polar descriptors for those attributes. lists the 25 attributes and bi-polar descriptors for this study.
Table 1. Strawberry sensory attributes, descriptions, and reference standards developed by trained panelists through descriptive analysis
Trained Sensory-Panel Evaluation
During each formal sensory evaluation session, 10 trained panelists evaluated samples using the ballots developed in training. Each cultivar was evaluated by each panelist in each of four sessions for a total of four evaluations per cultivar per panelist. Evaluations were conducted in individual booths at room temperature with moderate incandescent lighting. Each panelist received one whole berry and one halved berry presented in a small weigh boat labeled with three-digit random number codes. There was 1-min break between sample analysis, where panelists were asked to sip water, and eat plain crackers with a low sodium content as a palate cleansing to prevent retroactive interference of flavor. All attributes were rated on unstructured 15-cm line scales with the bipolar descriptors developed in training. The distance was then converted to intensity scores from 0 to 100 using the Compusense Five® Software program (Version 5.6, Compusense Inc., Guelph, Ontario, Canada).
Instrumental Attribute Evaluations
Size Estimation
For two of the evaluation sessions, fruit size was evaluated. Before the panel evaluation, a picture was taken (Nikon, D 800 digital, Nikon Inc., Melville, NY) of each numbered weigh boat next to a ruler. The picture was later evaluated to estimate fruit length and width, using Pro Plus version 9.3b (Media Cybernetics Inc., Rockville, MD).
Color Measurements
Physicochemical analyses were performed on the same day as the sensory evaluation. Methods for the analysis of the color, firmness, SSC, and TA were adapted from Lester and Saftner (Citation2008) and Saftner and Lester (Citation2009). Color measurement was performed on the strawberry exterior skin using a calibrated Chroma-meter (CR-400, Konica Minolta Inc., Tokyo, Japan) with a CIE D65 standard illuminant. Calibration was conducted using a manufacturer-supplied white calibration plate (L*: 96.03, a*: 0.20, b*: 2.10). The external (skin) color of 10 whole strawberries (two sides of each berry) and 10 halved strawberries per cultivar was determined in CIE L*a*b* color space by measuring the lightness or L* (+100 = white, −100 = black), a*(+60 = red, −60 = green), and b*(+60 = yellow, −60 = blue). The a* and b* values were converted to chroma (C* = color intensity) and hue angle (0° = red, 90° = yellow, 180° = green, 270° = blue) by SpectraMagic NX software in the Chroma-meter. Chroma and hue angle were calculated by C* = [(a*)2 + (b*)2]1/2, and hº = tan−1[(b*)/(a*)], respectively, according to Lester and Saftner (Citation2008) and Saftner and Lester (Citation2009).
Texture Measurements
After the color measurements were completed, texture analysis was conducted on the same whole and halved strawberries. Firmness measurements were performed using a texture analyzer (Model TA. XT Plus, Stable Microsystems, Surrey, England) with a 5-kg load cell. A 10-mm diameter cylindrical probe was used to puncture the flat surface of the strawberry samples at a speed of 1.0 mm s−1 to a deformation of 6 mm. When a whole berry was measured, both sides of the berry were sampled. When a halved berry was measured, it was measured with the cut surface facing down, and the probe penetrated the exterior from the up-facing side. Textural parameters were calculated from the deformation curves using the manufacturer’s software; maximum force, total area (energy) under the curve, and gradient (slope) were determined for the initial portion of the curve between 0.5 and 1.0 s (Gunness et al., Citation2009; Harker et al., Citation1997; Hietaranta and Linna, Citation1999; Lester and Saftner, Citation2008; Saftner and Lester, Citation2009).
Physicochemical Measurements
These same halved and whole fruits were then measured individually for SSC. SSC was determined with an LCD digital refractometer (Model PR-101; Atago Co., Tokyo, Japan). Then, these fruits were then combined each session to measure TA for 1 puree per cultivar per session. Strawberries were cut, blended, juiced, and filtered through a cheesecloth. The TA was measured by titration with 0.1 M KOH (≥85% pellets; Sigma Aldrich, St. Louis, MO, USA) (Gunness et al., Citation2009; Mitcham and Kader, Citation1996; Simandjuntak et al., Citation1996), calculated as both percent malic acid and percent citric acid. The ratios of SSC/TA(citric) and SSC/TA(malic) were calculated. The solution pH was measured using a pH meter (Thermo Orion 550A; Thermo Electron Corp., Beverly, MA, USA) at 21°C.
Statistical Analysis
An analysis of variance (ANOVA) was performed using the PROC GLM procedure in SAS (version 9.4, SAS Institute, Cary, NC, USA). Tukey’s HSD significant difference test (α = 0.05) was conducted for multiple comparisons of sensory attributes and instrumental measurements among strawberry cultivars with cultivar as the main fixed effect. For sensory attributes, the random effects were panel sessions (4) and panelists (10). Component analyses using the correlation procedure, PROC CORR, were performed to identify relationships among the 43 sensory and instrumental variables or the 25 sensory variables alone. A correlation of means was conducted using Microsoft Excel (2016) when the goal was to understand the relationship between a rating by the panel, as a whole, and an instrumental measure.
Results
Strawberry Appearance
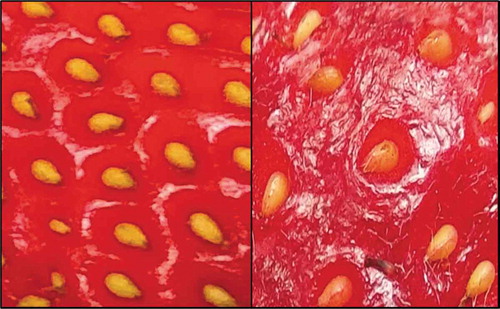
The panels evaluated whole strawberries for appearance before tasting. They reported no differences between cultivars for visual freshness, glossiness, and color uniformity (), indicating the strawberries from all the cultivars were perceived to be equally fresh, thus making them especially suitable for further evaluation. The panel assessment of overall appearance was strongly correlated with their assessment of visual freshness (r2 = 0.83, P < .0001) and glossiness (r2 = 0.82, P < .0001), and loosely associated with size acceptability (r2 = 0.48, P = .0019). Visual freshness of the strawberry was not as strongly correlated with freshness of the calyx (r2 = 0.40, P = .01), though there were significant differences between cultivars for calyx freshness (). Visual freshness and glossiness were strongly correlated (r2 = 0.84, P < .0001), perhaps because glossiness decreases as strawberries dehydrate and wrinkle, as shown in . The means separations, or lack of, combined with the relative strength of correlations, indicates that the panel perceived glossiness as the better indicator of the freshness and overall appearance of the strawberry.
Table 2. Sensory intensity scores and acceptability scores of appearance attributes before tasting fresh strawberries from 10 cultivars grown in Maryland
Figure 1. Skin of a fresh strawberry compared with the skin of a strawberry that has dehydrated in storage, becomes wrinkled, and lost glossiness
Color
Panel perception of glossiness (r2 = 0.4663, P = .0024) and visual freshness (r2 = −0.379, P = .0159) were negatively correlated with color intensity. Using a correlation of means, color intensity was negatively correlated primarily with the instrumental measure of L* (r2 = −0.76), and also with a* (r2 = −0.52), b* (r2 = −0.66), and C (r2 = 0.58). Although still negative, Pearson’s correlation coefficients were not significant for these associations. Instrument ratings of color detected significant differences between cultivars for all color parameters. The panels rated ‘Portola’ and ‘Allstar’ as having the lowest color intensity scores (), and they had the highest L* and b* values indicating these strawberries were lighter and more orange in color (). The panel rated ‘Earliglow’ as having the greatest color intensity (). ‘Earliglow’ was among the lowest for the color parameters, L* and b*, indicating it was among the darkest and most blue (). The chroma (C), calculated as C = (a*2 + b*2)1/2 also was among the lowest (), indicating a more dull than bright appearance, compared with the other cultivars. Therefore, light orange-red berries had a lower color intensity and appeared fresher. Panel perception of color intensity was positively correlated with their color-uniformity ratings (r2 = 0.70, P < .0001), though the panels detected differences between cultivars in color intensity, not color uniformity (). Hue ranged from 29 to 34, and, although there were significant differences among cultivar hues, all were between 0° (red) and 90° (yellow) (), and, so, hue was positively correlated with b* values (r2 = 0.90, P < .0001).
Table 3. Instrumental exterior color values for 10 strawberry cultivars grown in Maryland
Strawberry Size
The panel detected significant cultivar differences for strawberry size acceptability (). The panel’s perception of size acceptability generally agreed with objective measurements of visual images. ‘Flavorfest,’ ‘Allstar,’ and ‘Albion’ were rated significantly more acceptable in size (large enough) than ‘Seascape’ and ‘Earliglow’ (too small). Physical measurements showed ‘Flavorfest’ was significantly longer and wider than ‘Earliglow.’ Using the correlation of means, the panel’s perception of size acceptability was most closely associated with physical measurements of strawberry width (r2 = 0.93), followed by length (r2 = 0.77), then the ratio (r2 = 0.45). However, using Pearson’s correlations, panelist evaluations of size acceptability were not significantly correlated with any physical measurements. The ratio of measured length and width (l/w) ranged from 1.1 to 1.3 and was not closely associated with the panel’s perception of size acceptability (r2 = 0.45). An analysis of variance of physical measurements of length and width showed significant differences between cultivars, between replications, and a significant genotype-by-replication interaction (). A significant interaction effect would be expected, especially among the once-fruiting cultivars, as fruit size decreases in later harvests, but at different rates for different cultivars. The analysis of variance for the length-to-width ratio showed significant differences between cultivars, but not replications, and showed no interaction effect () making it of some value in making breeding selections.
Table 4. Size measurements from image analyses (n = 20), compared with sensory-panel acceptability scores of the berry size of 10 strawberry cultivars grown in Maryland
Table 5. Analyses of variance for size measurements from image analyses (n = 20) of berries from 10 strawberry cultivars grown in Maryland
Seeds
The panel’s perception of strawberry size acceptability was positively correlated with their perception of seed size (r2 = 0.75, P < .0001) but not seed density, and seed size had no relation to seed density. The panel detected significant cultivar differences for seed density and seed size ().
Aroma before Tasting
In tasting the strawberries, the panel detected no difference in greenness aroma (). All strawberries prepared for the panel were selected to be uniform in ripeness, but perceived differences in greenness aroma could have been interpreted as differences in ripeness and could have affected other perceptions. The panel detected significant differences between cultivars in aroma before chewing, fruity aroma, and strawberry aroma (). All three were correlated with each other. The strongest association was between the panel perception of aroma overall and strawberry aroma (r2 = 0.90, P < .0001), which was stronger than the association between overall aroma and fruity aroma (r2 = 0.73, P < .0001). The next strongest association was between strawberry aroma and fruity aroma (r2 = 0.86, P < .0001).
Table 6. Sensory intensity scores of the attributes for flavor for berries from 10 strawberry cultivars grown in Maryland
Sweetness
The panel detected significant differences between cultivars for sweetness (), and the instrumental measure of soluble solids content also detected significant differences between cultivars (). The cultivar-means separations were superior for percentage soluble solids compared with the panel’s evaluation for sweetness. The cultivar means for the two measures were positively correlated using a correlation of means (r2 = 0.69), but were not significantly correlated using Pearson’s correlations. Sweetness was strongly associated with the panel rating for overall flavor (r2 = 0.84, P < .0001) and overall quality (r2 = 0.87, P < .0001).
Table 7. Soluble solids contents (SSC), initial pH, and titratable acidity (TA) values for each of 10 strawberry cultivars grown in Maryland. Sensory intensity scores of the attributes for flavor (sweetness, sourness)
Sourness
The panel evaluations of sweetness and sourness were not correlated, though the panel found significant cultivar differences for sourness (). Significant differences between cultivars also were detected using pH, titratable acidity (malic acid), and titratable acidity (citric acid) (). The maximum means separations between cultivars were obtained by measuring TA with either method, followed by panel evaluation, followed by pH (). The panel evaluation of sourness did not correlate with pH, using Pearson’s correlations, but did weakly correlate with titratable acidity using malic acid (r2 = 0.34, P < .0001) and with titratable acidity using citric acid (r2 = 0.34, P < .0001). As expected, the correlation between measuring titratable acidity with malic acid or citric acid was 100% (r2 = 1.00, P < .0001), and the correlation between pH and TA was negative (r2 = −0.30, P < .0001). The panel evaluation of sweetness was positively correlated with SSC/TA(malic) (r2 = 0.63), but not with SSC/TA(citric), using a correlation of means, and not correlated significantly with any measure of SSC/TA when using Pearson’s correlations. It is interesting that panel perception of overall quality and overall flavor were not correlated with panel estimate of sourness, just sweetness.
Aroma and Tasting
The panel detected significant cultivar differences for strawberry flavor, fermented flavor, and aftertaste (). Strawberry flavor was correlated with the panel’s perception of sweetness (r2 = 0.91, P < .0001), fruity aroma (r2 = 0.84, P < .0001), strawberry aroma (r2 = 0.81, P < .0001), and overall aroma before tasting (r2 = 0.67, P < .0001). Aftertaste was most strongly correlated with calyx freshness and negatively (r2 = −0.66, P < .0001), so that a fresh calyx was associated with little or no fermented taste. Fermented aroma during tasting was not strongly correlated with any other trait the panel evaluated.
Texture
The panel estimate of juiciness was significantly correlated with overall quality (r2 = 0.59, P < .0001). The panels found some cultivars to be significantly juicier than others (), and the texture analyzer also discerned differences between cultivars for juiciness as measured by the area under the curve (). The two measures of juiciness were not correlated, and the panel assessment of juiciness was uncorrelated with all measurements by the texture analyzer. All the measures generated using the texture analyzer determined significant differences between cultivars () and were strongly and positively correlated from r2 = 0.79 (P < .0001) to r2 = 1.00 (P < .0001). The panel was unable to discern between cultivars for firmness. Using Pearson’s correlation coefficients, the panel assessment of firmness was not correlated with any of the instrumental measures of firmness. However, a correlation of cultivar means found some positive correlations. The panel’s firmness assessment was associated with the texture analyzer’s assessment of skin toughness, as derived from the slope of the first part of the curve (r2 = 0.83), with maximum firmness, as derived from the apex of the curve (r2 = 0.69), the average firmness, as derived from a horizontal slice through the area of the curve that divides the area into half (r2 = 0.70), and with juiciness, as derived from the total area under the curve (r2 = 0.71). The panel was unable to detect differences between cultivars for crunchiness and fibrousness but positively correlated (r2 = 0.58, P < .0001) these two traits. Overall, the panel assessments for fibrousness, crunchiness, and firmness were difficult to relate to the texture analyzer’s measures. Interestingly, panel ratings for fibrousness, crunchiness, and firmness were not correlated with the overall quality. In contrast, Schwieterman et al. (Citation2014) found firmer textures are preferred. Colquhoun et al. (Citation2012) found people disliked fruit that was described as “so soft it didn’t need to be chewed” and responded positively to the concept of fruit that would “melt in your mouth.” Findings from the current study, that quality and texture were not associated, likely are due to the fruit from all 10 cultivars having acceptable firmness and texture.
Table 8. Instrumental estimates of berry texture using a texture analyzer (Model TA. XT Plus, Stable Microsystems, Surrey, England), compared with sensory-panel intensity scores of the attributes for texture for berries of 10 strawberry cultivars grown in Maryland
Overall Acceptability
The panel rated all the cultivars similarly for overall appearance, but found differences between cultivars for overall flavor, texture, and quality (). Overall quality was most strongly associated with the panel rating for sweetness (r2 = 0.87, P < .0001), strawberry flavor (r2 = 0.87, P < .0001), and overall flavor (r2 = 0.86, P < .0001). This agrees with the findings of others (Bhat et al., Citation2015; Colquhoun et al., Citation2012; Jouquand et al., Citation2008) who found consumers focused on sweetness and complex flavors in their preferences for strawberries. Overall quality also was positively correlated with fruity aroma (r2 = 0.84, P < .0001), strawberry aroma (r2 = 0.78, P < .0001), and overall aroma (r2 = 0.62, P < .0001). Overall quality and overall texture also were strongly correlated (r2 = 0.72, P < .0001). The current study found no correlation between overall quality and firmness, fibrousness, or crunchiness, though there was a significant positive correlation between overall quality and juiciness (r2 = 0.59, P < .0001). There were moderate positive correlations between overall quality and the overall appearance (r2 = 0.49, P = .0014), fruit size acceptability (r2 = 0.50, P = .0010), and size of the seeds (r2 = 0.47, P = .0021).
Table 9. Means of sensory acceptability scores for the attributes for overall appearance, texture, flavor, quality, and aroma of fresh strawberries from 10 cultivars grown in Maryland
Discussion
The first objective of this study was to determine consumer preference of once-fruiting and repeat-fruiting strawberry cultivars adapted to the Mid-Atlantic, to help growers select the most suitable strawberry cultivars based on their marketability, critical sensory quality attributes, and physicochemical measurements. Of all 10 cultivars, the one rated highest for overall quality, overall flavor, overall texture, and overall aroma before tasting was ‘Flavorfest,’ a short-day, mid-season cultivar (). ‘Flavorfest’ was rated the highest for sweetness, and had the highest percentage soluble solids (). The panel determined the sweetness was balanced with a moderate rating for sourness, and it had a moderate pH. Yet, instrumentally, the titratable acidity (malic or citric) was among the highest, with moderate SSC/malic, and somewhat low SSC/citric ratios (). The panel rated ‘Flavorfest as the juiciest, and rated it highest for fruity aroma, strawberry aroma, and strawberry flavor, and among the highest for a strong aftertaste, with a moderate fermented taste (). The texture analyzer provided mostly moderate to soft levels for all firmness ratings (). The panel rated ‘Flavorfest’ as the largest berry, and this was confirmed by the measurements of images for length and width (). The panel gave ‘Flavorfest’ a moderate calyx freshness rating, though it was not significantly different from the cultivar with the highest calyx freshness rating, ‘Portola’ (). The panel rated the seeds as larger than those of any other cultivar, and the seed density was not significantly different from the cultivars with either the greatest or the lowest seed density ().
Based on the superior ratings ‘Flavorfest’ strawberries received in several key categories, it should be a good mid-season choice for growers in the Mid-Atlantic. Acceptable to excellent performance has been reported from USDA Hardiness Zone Map Zone 8a through Zone 4b and indicates tolerance to a wide range of environmental conditions and production systems (Lewers et al., Citation2017a). ‘Flavorfest’ showed good resistance to three isolates of Colletotrichum acutatum species complex, and the total and non-rotted fruit yields were among the highest when grown in Maryland without soil fumigants or fungicides from 1999 through 2016 (Lewers et al., Citation2017a).
Growers considering only short-day cultivars, yet looking to extend their production season, should consider ‘Earliglow’ (early season), and ‘Allstar’ (mid-late-season) (Galletta and Draper, Citation1981; Scott and Draper, Citation1975) which flank the ‘Flavorfest’ production season (Lewers et al., Citation2017a). In the current study, ‘Earliglow’ rated among the highest in overall quality, overall texture, and overall flavor (). ‘Earliglow’ fruity and strawberry aroma was rated among the highest (). Although ‘Earliglow’ soluble solids percentage was as high as that of ‘Flavorfest,’ the panel rated ‘Earliglow’ lower than ‘Flavorfest’ for sweetness (), and among the most sour, but not significantly more sour than ‘Flavorfest.’ ‘Earliglow’ strawberries were rated the smallest and had the lowest length and width measurements (). Growers will need to balance the early season and excellent flavor of ‘Earliglow’ against its small size and lower yield (Lewers et al., Citation2017a). ‘Allstar’ also was rated among the best for overall quality () and should be considered for its later production season, high yield (Lewers et al., Citation2017a), and large size (). Growers should consider that the panel did not rate it as highly for flavor as they did ‘Flavorfest’ and ‘Earliglow’ (, ). The color of ‘Allstar’ fruit is significantly different from the fruit of the other cultivars, in that it is brighter (chroma), redder (a* value) and more yellow (b* value), in addition to being among the lightest (), although the sensory panel did not find the different coloration to negatively affect overall appearance ().
The Mid-Atlantic grower can extend the strawberry production season with day-neutral cultivars, and up to nine months with the use of low tunnels (Lewers et al., Citation2017b). Of the five day-neutral cultivars evaluated in the current study, ‘Albion’ received the highest rating for overall quality and ranked with the top cultivars of the 10 in this study for overall quality, flavor, aroma, texture (), and size (). ‘Albion’s high ranking by the panel for overall flavor () was due to high ranking for overall aroma, fruity aroma, and strawberry aroma (), as it ranked moderately for strawberry flavor (), with unremarkable sweetness and acidity, by all measures (). The superior quality of fruit from ‘Albion’ helps compensate for its modest yield (Lewers et al., Citation2017b). ‘Monterey’ had better yield (Lewers et al., Citation2017b), and overall quality in the current study was second to ‘Albion’ (), though for individual instrumental measures and panel ratings were somewhat unremarkable (,,,,,). ‘Albion’ and ‘Monterey’ performed well when rated well by panelists and measured instrumentally when grown under low tunnels in Brazil, but so was ‘San Andreas,’ which was not rated well in the current study (Antunes et al., Citation2014). ‘Portola’ yield was highest (Lewers et al., Citation2017b), but was rated poorly for flavor in the current study (, ), was among the lowest for SSC and panel rating for sweetness ().
The second objective of this study was to identify interrelationships between sensory attributes and physicochemical measurements to determine which approaches might result in breeding strawberries that consumers will find most appealing. Overall appearance was strongly correlated with visual freshness and glossiness. Since glossiness can be lost when strawberries lose moisture in storage, even for the short period of this study, preventing moisture loss should be emphasized in research on strawberry breeding, cultural practices, and postharvest storage methods. A hand-held portable instrument to measure glossiness, or a numeric rating for glossiness, especially in postharvest storage, may prove useful.
Panel ratings for visual freshness were negatively correlated with their ratings for color intensity, which was negatively correlated with L* and b* values. Light orange-red strawberries appeared fresher and more appealing than darker more purple-red strawberries. Determining differences in visual freshness between genotypes at harvest may prove impossible, as all berries should be at peak freshness. But measuring L* and b* with a handheld device at harvest and after storage may help identify genotypes that stay fresh-looking after harvest.
Panel ratings for size were not related to instrumental measurements of size. For both length and width, there were significant differences between cultivars and replications, with a significant genotype-by-replication interaction, emphasizing the value of measuring berry size at multiple harvests through the season. The current study used panel ratings and visual images, while most strawberry breeding projects weigh and count berries at multiple harvests to estimate average berry weight (Lewers et al., Citation2017a) and associate that with size, regardless of any differences in berry density between genotypes or over time. An association between weight, density, width, and length may be of further value in determining the most appropriate approach to breeding for size.
The most important considerations for overall berry quality were sweetness and strawberry flavor and aroma in this and other studies (Bhat et al., Citation2015; Colquhoun et al., Citation2012; Jouquand et al., Citation2008). The instrumental measure of SSC enabled superior means separations compared with panel evaluations for sweetness. A hand-held device is more time-efficient for breeding. Most require only around 100 µl of juice, though destruction of the strawberry is required. A device that could estimate SSC nondestructively would be especially valuable for estimating sweetness in storage.
Because strawberry flavor and aroma were important factors in overall quality and flavor, it would have been of value to attempt to measure aroma instrumentally. Taste panels may be the most objective way to evaluate strawberry aroma and flavor. At the early stages of selection, a genotype is usually evaluated for strawberry aroma and flavor by an individual breeder.
Sourness was not an important factor in overall quality or flavor. Means separations for sourness were modest when using pH as a measure of sourness, compared with panel evaluation or TA. Measuring pH requires less than 100 µl of berry juice and may be the most efficient approach in strawberry breeding. As with SSC, a device that could estimate pH nondestructively would be valuable for estimating sourness in storage.
The panel assessment of juiciness was associated with their assessment of overall quality, but not with the texture analyzer measure of juiciness. A different measure, such as an estimate of percentage dry matter, may be useful if it could be estimated efficiently. However, measuring dry matter is tedious and time-consuming in a laboratory, let alone a twice-a-week measure from replicated plots of dozens of genotypes. It would be desirable to develop an efficient assay, using a portable hand-held instrument, based on correlation with dry matter and juiciness.
The panel assessments for fibrousness, crunchiness, and firmness were correlated with the texture analyzer’s measures only with a correlation of means. The panels could not discern between cultivars for fibrousness, crunchiness, and firmness, but all the texture analyzer’s measurements determined significant differences between cultivars. To identify firmer strawberry genotypes, an instrumental assessment was more effective than the panel assessment. Most breeders evaluate strawberry firmness with a hand squeeze or hand-held texture analyzer as opposed to evaluating texture while eating (Lewers et al., Citation2017a). It would have been valuable for this study to have included the hand-squeezing approach and a hand-held texture analyzer for comparison with the panel assessments and the texture analyzer used in this study.
Summary
Strawberries from 10 cultivars were harvested and evaluated by a trained sensory panel and instrumentally. The objectives of this study were to (1) determine consumer preference for the fruit of once-fruiting and repeat-fruiting strawberry cultivars available to grow in the Mid-Atlantic to help growers select the most suitable strawberry cultivars based on their marketability, critical sensory quality attributes, and physicochemical measurements; and (2) identify interrelationships between sensory attributes and physicochemical measurements to determine which approaches might result in breeding strawberries consumers will find most appealing.
Overall strawberry fruit quality was correlated in panel evaluations with sweetness and strawberry flavor and aroma, while sourness was not a factor in their estimation of overall quality. Separation of cultivar means for strawberry fruit sweetness was better when sweetness was evaluated by using an instrument to measure, rather than by using a trained panel evaluation.
Overall appearance of fresh strawberry fruit was correlated in panel evaluations with visual freshness and glossiness of the fruit skin. Light orange-red strawberries (higher L* and b*) appeared fresher and more appealing than darker more purple-red strawberries.
Fruits of ‘Flavorfest’ strawberry were rated highest of all 10 cultivars grown in MD, based on both panel evaluations and instrumental measures. ‘Albion’ fruits were rated highest of the repeat-fruiting cultivars, cultivars that fruit repeatedly through the summer instead of just a few weeks.
Acknowledgments
This project was funded by USDA-ARS Projects 8042-21220-257-00-D and 8042-43440-005-00-D. Evaluations at the UMD-WREC were funded by the Maryland Agricultural Experiment Station – University of Maryland. The authors wish to thank the volunteer panelists for participating in training and evaluations, Samantha Bolten for assisting with fruit pre-evaluation sorting, Ellen Bornhorst and Vaidehi Bhagat for fruit image analyses, John Enns, Phil Edmonds, and the USDA-ARS Beltsville Research Support Services for field and greenhouse support. Mention of trade names or commercial products in this publication is solely for the purpose of providing specific information and does not imply recommendation or endorsement by the U.S. Department of Agriculture or any of the other coauthors’ institutions.
Literature cited
- Antunes, M.C., F.L. Cuquel, M.A.C. Zawadneak, Á.F. Mogor, and J.T.V. Resende. 2014. Postharvest quality of strawberry produced during two consecutive seasons. Hortic. Bras. 32:168–173.
- Bett-Garber, K.L., J.C. Beaulieu, and D.A. Ingram. 2003. Effect of storage on sensory properties of fresh-cut cantaloupe varieties. J. Food Qual. 26:323–335. doi: 10.1111/j.1745-4557.2003.tb00248.x.
- Bhat, R., J. Geppert, E. Funken, and R. Stamminger. 2015. Consumers perceptions and preference for strawberries - A case study from Germany. Int. J. Fruit Sci. 15:1–20. doi: 10.1080/15538362.2015.1021408.
- Colquhoun, T.A., L.A. Levin, H.R. Moskowitz, V.M. Whitaker, D.G. Clark, and K.M. Folta. 2012. Framing the perfect strawberry: An exercise in consumer-assisted selection of fruit crops. J. Berry Res. 2:45–61. doi: 10.3233/JBR-2011-027.
- Condori, B., D.H. Fleisher, and K.S. Lewers. 2017. Relationship of strawberry yield factors with microclimate under open and covered raised-bed production. Trans. ASABE 60:511–1525. doi: 10.13031/trans.12371.
- do Nascimento Nunes, M.C. 2015. Correlations between subjective quality and physicochemical attributes of fresh fruits and vegetables. Postharvest Biol. Technol. 107:43–54. doi: 10.1016/j.postharvbio.2015.05.001.
- Galletta, G.J., and A.D. Draper. 1981. ‘Allstar’ strawberry. HortScience 16:792–794.
- Gunness, P., O. Kravchuk, S.M. Nottingham, B.R. D’Arcy, and M.J. Gidley. 2009. Sensory analysis of individual strawberry fruit and comparison with instrumental analysis. Postharvest Biol. Technol. 52:164–172. doi: 10.1016/j.postharvbio.2008.11.006.
- Harker, F.R., M.G.H. Stec, I.C. Hallett, and C.L. Bennett. 1997. Texture of parenchymatous plant tissue: A comparison between tensile and other instrumental and sensory measurements of tissue strength and juiciness. Postharvest Biol. Technol. 11:63–72. doi: 10.1016/S0925-5214(97)00018-5.
- Hietaranta, T., and M.M. Linna. 1999. Penetromic measurement of strawberry fruit firmness: Device testing. HortTechnology 9:103–105. doi: 10.21273/HORTTECH.9.1.103.
- Jouquand, C., C.K. Chandler, A. Plotto, and K. Goodner. 2008. A sensory and chemical analysis of fresh strawberries over harvest dates and seasons reveals factors that affect eating quality. J. Amer. Soc. Hort. Sci. 133:859–867. doi: 10.21273/JASHS.133.6.859.
- Lester, G.E., and R.A. Saftner. 2008. Marketable quality and phytonutrient concentrations of a novel hybrid muskmelon intended for the fresh-cut industry and its parental lines: Whole-fruit comparisons at harvest and following long-term storage at 1 or 5 °C. Postharvest Biol. Technol. 48:248–253. doi: 10.1016/j.postharvbio.2007.10.009.
- Lewers, K.S., P.R. Castro, J.M. Enns, D.T. Handley, A.R. Jamieson, M.J. Newell, J.B. Samtani, R.D. Flanagan, B.J. Smith, J.C. Snyder, et al. 2017a. ‘Flavorfest’ strawberry. HortScience 52:1627–1632. doi: 10.21273/HORTSCI11893-17.
- Lewers, K.S., D.H. Fleisher, and C.S.T. Daughtry. 2017b. Low tunnels as a strawberry breeding tool and season-extending production system. Int. J. Fruit Sci. 17:233–258. doi: 10.1080/15538362.2017.1305941.
- Meilgaard, M., G.V. Civille, and B.T. Carr. 1999. Sensory evaluation techniques, 3rd edition. CRC Press LLC, Boca Raton, FL.
- Mitcham, B., and A. Kader. 1996. Methods for determining quality of fresh commodities. Univ. Cal. Perishables Handling. Newsl. 85:1-5.
- Park, E., Y. Luo, S.C. Marine, K.L. Everts, S.A. Micallef, S. Bolten, and J. Stommel. 2018. Consumer preference and physicochemical evaluation of organically grown melons. Postharvest Biol. Technol. 141:77–85. doi: 10.1016/j.postharvbio.2018.03.001.
- Saftner, R., J.A. Abbott, G.E. Lester, and B. Vinyard. 2006. Sensory and analytical comparison of orange-fleshed honeydew to cantaloupe and green-fleshed honeydew for fresh-cut chunks. Postharvest Biol. Technol. 42:150–160. doi: 10.1016/j.postharvbio.2006.02.011.
- Saftner, R., and G.E. Lester. 2009. Sensory and analytical characteristics of a novel hybrid muskmelon fruit intended for the fresh-cut industry. Postharvest Biol. Technol. 51:327–333. doi: 10.1016/j.postharvbio.2008.09.008.
- Schwieterman, M.L., T.A. Colquhoun, E.A. Jaworski, L.M. Bartoshuk, J.L. Gilbert, D.M. Tieman, A.Z. Odabasi, H.R. Moskowitz, K.M. Folta, H.J. Klee, et al. 2014. Strawberry flavor: Diverse chemical compositions, a seasonal influence, and effects on sensory perception. PLoS ONE 9:e88446. doi: 10.1371/journal.pone.0088446.
- Scott, D.H., and A.D. Draper. 1975. ‘Earliglow’, a new early ripening strawberry. Fruit Var. J. 29:67–69.
- Simandjuntak, V., D.M. Barrett, and R.E. Wrolstad. 1996. Cultivar and maturity effects on muskmelon (Cucumis melo) color, texture and cell wall polysaccharide composition. J. Sci. Food. Agric 71:282–290. doi: 10.1002/(SICI)1097-0010(199607)71:3<282::AID-JSFA576>3.0.CO;2-5.
- Threlfall, R.T., O.S. Hines, J.R. Clark, L.R. Howard, C.R. Brownmiller, D.M. Seantini, and L.J.R. Lawless. 2016. Physiochemical and sensory attributes of fresh blackberries grown in the Southeastern United States. HortScience 51:1351–1362. doi: 10.21273/HORTSCI10678-16.
- USDA-Economic Research Service, 2012. Food availability (per capita) data system, August 2012.
- USDA-Economic Research Service, 2016. Fruit and tree nuts outlook FTS-361, March 31, 2016.
- USDA-National Agricultural Statistics Service, 2017. Noncitrus fruits and nuts 2016 Summary, June.
- Vallone, S., H. Sivertsen, G.E. Anthon, D.M. Barrett, E.J. Mitcham, S.E. Ebeler, and F. Zakharov. 2013. An integrated approach for flavour quality evaluation in muskmelon (Cucumis melo L. reticulatus group) during ripening. Food Chem. 139:171–183. doi: 10.1016/j.foodchem.2012.12.042.