
ABSTRACT
Coffea canephora Pierre ex Frohener is popularly known as robusta coffee contributes to about 39% of the total world coffee production. Coffea canephora a native to West Africa was introduced to India as early as 1900 AD. However adequate information regarding the diversity and genetic structure of C. canephora germplasm available in India is not yet available. In the present study, sequence related amplified polymorphism (SRAP) and start codon targeted (SCoT) molecular markers were employed to access the genetic diversity and relationships of 58 C. canephora germplasm accessions available in the Indian gene bank. Forty-nine SRAP and thirty-one SCoT primers amplified 632 and 331 fragments respectively, of which 507 (80.22%) and 225 (67.97%) were polymorphic. The average polymorphism information content (SRAP, 0.48; SCoT, 0.37) and resolving power (SRAP, 15.60; SCoT,14.84) revealed high genetic diversity among the accessions The SRAP markers were found more informative with regards to the amount of diversity detected which is evident from effective multiplex ratio (SRAP = 8.59, SCoT = 5.61) and marker index (SRAP = 4.60, SCoT = 2.58). The neighbor-joining clustering revealed that 58 accessions were grouped into four major clusters which were also supported by Principal coordinate analysis. An admixture model-based clustering method in STRUCTURE grouped all the accessions in four subpopulations (K = 4) as similar to NJ clustering. Our study demonstrated the suitability of SRAP and SCoT markers for coffee genetic diversity and discovered thirty-one diverse genotypes in the germplasm that could be integrated into the C. canephora genetic improvement program.
Introduction
Coffee is one of the most widely consumed beverages in the world and is the major source of income for many developing countries in Asia, Africa and Latin America (Mishra and Slater, Citation2012). Coffee belongs to the genus Coffea of the family Rubiaceae. The genus Coffea consists of more than 124 species (Davis et al., Citation2019) of which only 2 species C. arabica (arabica coffee) and C. canephora (robusta coffee) are cultivated for commercial coffee production. In 2017, about 159.66 million bags (60 kg capacity) of coffee were produced globally of which arabica accounts for 97.43 million bags (61%) and robusta 62.23 million bags (39%) respectively (International Coffee Organization (ICO) Report, Citation2017). Among 124 coffee species known so far, only C. arabica is the natural allotetraploid (2 n = 4x = 44) and autogamous whereas the other species are generally diploid (2 n = 2x = 22) and allogamous in nature. Although C. arabica is susceptible to many pests and diseases, it produces high-quality coffee compared to C. canephora whose products are considered to be inferior quality. However, C. canephora plants are hardy and tolerant to major pests and diseases.
Coffea canephora is originated from the lowland tropical forest of Africa and extends to a large area stretching from West African Cameroon through the Central African Republic to the Democratic Republic of Congo and further passes through Uganda, and northern Tanzania up to northern Angola (Cubry et al., Citation2013). In India, Robusta coffee is reported to have introduced from Java during 1903–06 AD (Anonymous, Citation2014). However, the commercial cultivation of robusta in India has picked up after 1925, following the establishment of Coffee Research Station at Chikmagalur. During the 1950 s, 27% of the total area under coffee cultivation in India was occupied by Robusta coffee and the rest 73% area was under arabica coffee cultivation. But, since then, there is a paradigm shift in the coffee cultivation patterns in India. During 2018–19, about 50% of the total area under coffee cultivation in India is occupied by robusta coffee. Further, the production of Robusta coffee which was only 3382 MT (18%) during the year 1950 jumped to 244500 MT (70.3%) during 2018–19. This has demonstrated the importance of Robusta coffee cultivation in India.
Coffea canephora is cultivated at low to medium altitude and requires less care to grow because of its hardy nature. However, there were two major disadvantages of C. canephora firstly inability to endure long drought conditions and secondly produce small bean size lacking good flavor in the beverage. Thus, the major C. canephora breeding programs directed toward evolving widely adaptable and high yielding, cultivars with improved bean size and organoleptic characteristics. However, the success of any breeding program depends essentially on the availability of diverse genetic resources within the base population. In India, during 1930–40, systematic surveys were undertaken and C. canephora plants representing the initial introductions were collected from different plantations and established as initial gene pool at Central Coffee Research Institute. Subsequently, some exotic robusta accessions were introduced to the gene bank from various countries such as Indonesia, Madagascar, Costa Rica, Ivory Coast, Guatemala, Uganda, Vietnam from 1950–1970 and constituted the later introductions (Ram et al., Citation1994).
Genetic improvement of C. canephora using conventional breeding is often neglected because of the priority focus on arabica coffee improvement due to premium produce of the variety, self-incompatibility, extremely slow breeding process hindering varietal improvement as well as lack of sufficient information on available genetic diversity for parental material selection and crossing. Because of this, characterization and evaluation of the C. canephora gene pool are necessary for effective crop improvement programs as well as better management and conservation strategies. During the last 25 years, molecular markers have leapfrogged other conventional markers in germplasm assessment in a variety of crop plants (Garrido-Cardenas et al., Citation2018; Kesawat and Kumar., Citation2009). The information generated by using molecular markers helps to gain insight into the genetic structure of individual germplasm accessions and eventually facilitates the accurate selection of superior diverse accessions for maximizing selection gains (Sousa et al., Citation2017). The genetic diversity of C. canephora accessions has been analyzed using different markers such as Restriction fragment length polymorphism (RFLP) (Gomez et al., Citation2009), Amplified fragment length polymorphism (AFLP) (Prakash et al., Citation2005), Random amplified Polymorphic DNA (RAPD) and Inter simple sequence Repeats (ISSR) (Tshilenge et al., Citation2009), Simple sequence repeats (SSR) (Leroy et al., Citation2014; Ogutu et al., Citation2016) and Single nucleotide polymorphism (SNP) (Anagbogu et al., Citation2019). Interestingly, during the last three years, there was a renewed interest in the molecular- based genetic diversity analysis of C. canephora population in many coffee growing countries which include Brazil (Bikila et al., Citation2017), Vietnam and Mexico (Garavito et al., Citation2016), Kenya (Ogutu et al., Citation2016), Ecuador (Solorzano et al., Citation2017)and Nigeria (Anagbogu et al., Citation2019). In past, the genetic diversity analysis of Indian robusta gene pool was analyzed using limited number of SSR and AFLP markers (Prakash et al., Citation2005). However, comprehensive information on the genetic diversity and population structure of Indian C. canephora accessions is lacking and therefore need to be resolved.
Compared to several other molecular markers, two novel marker systems such as Sequence- related amplified polymorphism (SRAP) markers developed by Li and Quiros. (Citation2001) and Start Codon Targeted polymorphism (SCoT) marker developed by Collard and Mackill. (Citation2009) have emerged as the markers of choice due to less expensive, small amount of sample DNA requirement, clear and un-ambiguous banding pattern and higher reproducibility (Jingade et al., Citation2019; Shangguo et al., Citation2018). The SRAP markers have been effectively used in the genetic diversity and population structure analysis in number of plants such as Brassica juncea (Singh et al., Citation2013), Toona ciliata (Li et al., Citation2015), Melia taxa (Liao et al., Citation2016) and Coffea arabica (Jingade et al., Citation2019; Mishra et al., Citation2014). SCoT marker system targets the short conserved region of the plant genes surrounding the ATG initiation codon. When compared to RAPDs, ISSRs and SSRs marker systems, the SCoT markers focus on genic regions which usually have low recombination levels between marker alleles and the gene or trait and therefore this marker system is considered more advantageous than the later ones. SCoT markers have been successfully used to evaluate genetic diversity and population structure in many plant species such as Saccharum spontaneum L (Que et al., Citation2014), Dactylis glomerata (Jiang et al., Citation2014), Camellia sinensis (Zhang et al., Citation2018), Mangifera indica (Luo et al., Citation2011) and Podocarpus macrophyllus (Wei et al., Citation2012). The primary objective of the present research was to identify the genetic diversity and population structure of. C. canephora accessions available in Indian gene bank for appropriate germplasm management as well as evaluating the breeding value of the coffee gene pool. To the best of our knowledge, this is the first report of employing both SRAP and SCoT markers to estimate the genetic diversity of C. canephora and the first comparative analysis between SCoT and SRAP markers.
Materials and Methods
All the 58 germplasm accessions of C. canephora used in the present study were maintained ex-situ at Regional Coffee Research Station, Chundale, Wayanad District, Kerala, India (). The Research station is situated at about 840 meters above sea level; latitude 13.22° N and longitude 75.28° E. The station receives an average annual rainfall of 300 cm predominantly between the months of June to October as a result of southwest monsoon. The average minimum and maximum temperature of the station ranges from 19 to 27.3°C with average humidity of 88.9%. The soil is generally lateritic varying from sandy to clayey loams with soil pH varying from 5.2 to 6.3.
Table 1. Details of C. canephora germplasm collections used in the study
DNA Isolation
Young leaf samples from healthy field-grown plants of 58 accessions () were collected and genomic DNA was isolated using Cetyl Trimethyl Ammonium Bromide (CTAB) method as per the protocol described by Mishra et al. (Citation2011a). The DNA was quantified using UV spectrophotometer (Beckman) at 260 nm and 280 nm and the quality was assessed by separating it on 0.8% agarose gel stained with ethidium bromide (0.5 µg/ml). Further, the DNA samples were diluted to a working concentration of 10ng/μl and stored at −20°C for SRAP and SCoT marker amplification.
SRAP and SCoT Marker Analysis
Eighty SRAP primer combinations involving fourteen forward primers (ME1-Me14) and sixteen reverse primers (EM1-EM-16) described by Li and Quiros. (Citation2001) and 50 SCoT primers developed by Collard and Mackill. (Citation2009) were used to screen 58 C. canephora accessions. Forty- nine out of 80 SRAP primer combinations and 31 out of 50 SCoT primers screened gave consistent and unambiguous banding patterns (Table S1 and S2). Hence these primers were selected for further genetic analysis. PCR amplification was performed in a 20 μl total reaction volume using Bio-Rad Thermal cycler S1000. The PCR reaction mixtures contained 3.0 µl of template DNA (10ng/μl), 3.0 μl of 3 μM primer/s, 2.0 μl of 2 mM dNTPs, 2.0 µl of 10X Taq polymerase buffer, 2.0 µl of 25 mM MgCl2 (all from Thermo Fisher Scientific, Waltham, USA), 1 µl of 3units/μl Taq DNA polymerase enzyme (GeNei, Bangalore, India) and the reaction volume was made up to 20 μl using sterile nuclease-free water. SRAP-PCR analysis was carried out according to the procedure described by Li and Quiros. (Citation2001) with minor modifications as reported earlier by Mishra et al. (Citation2011b). The PCR cycling profile involved 4 minutes initial denaturation at 96ºC, 5 cycles comprising denaturation at 94ºC for 1 minute, primer annealing at 35ºC for 1.15 minute and extension at 72ºC for 2 minute followed by 30 cycles consisting of denaturation at 94ºC for 1 minute, primer annealing at 50ºC for 1.15 minutes and primer extension at 72ºC for 2 minutes. A final extension of 15 minutes at 72ºC was followed. The PCR amplification conditions for SCoT marker analysis comprised an initial denaturation step of 5 minutes at 94°C, followed by 30 cycles of 94°C for 0.5 minute, primer annealing at 48°C for 2 minutes, primer extension at 72°C for 2 minutes and final extension of 15 minutes at 72°C. The PCR amplified products were resolved on 1.5% agarose gel (SeaKem, Rockland USA) containing 0.5 µg ethidium bromide/ml in 1x TBE (Tris-HCl, Boric acid, EDTA) buffer. After electrophoresis, the gels were visualized and banding pattern images were captured using Gel Doc System (BioRad) with a Multi Analyst software program.
Scoring and Statistical Analysis
The gel pictures representing the PCR banding patterns of SRAP and SCoT markers were analyzed separately. The absence of band was scored as ”0” and the presence of the band was scored as “1” and a binary matrix of presence (1)/absence (0) was generated for each marker. The size of each band was estimated by comparing it with the standard DNA ladder (1Kb plus Ladder, Thermo Fisher Scientific, Waltham, USA). Total number of bands, number of polymorphic bands, the average number of bands per primer and the frequency distribution of bands across the germplasm accessions and the accession specific bands were calculated. The discriminatory ability of each primer was evaluated using three indices such as polymorphic information content (PIC) (Botstein et al., Citation1980; Milbourne et al., Citation1997), resolving power (Rp) (Prevost and Wilkinson., Citation1999) and marker index (MI). PIC was calculated as PIC = (1-pi2)/n, where n is the number of band positions analyzed in all the accessions, pi is the frequency of the banding pattern. The resolving power of each primer is estimated as Rp = Ib, where Ib (band informativeness) takes the value of 1- [2 × (0.5-p)] and p is the ratio of samples sharing the band (Prevost and Wilkinson., Citation1999). Effective multiplex ratio (EMR) was determined as follows: EMR = np × β, where np is the total number of polymorphic bands and β is the ratio of polymorphic bands to total bands (Powell et al. Citation1996). Marker index (MI) was calculated using the formula MI = PIC × EMR (Zitouna et al., Citation2015). The SRAP primer index (PI) was determined by summing up the PIC values of all loci amplified by the same SRAP primer combination, PI = PIC × Total bands (Anderson et al., Citation1993; Ghislain et al., Citation1999; Rajwade et al., Citation2010).
Genetic similarity between various germplasm accessions was evaluated by using the Jaccard similarity coefficient method (Jaccard, Citation1908). Cluster analysis of the accessions was performed using NTSYS-PC 2.10e software (Rohlf, Citation1995) based on the unweighted pair group method using arithmetic averages (UPGMA), with a bootstrap value of 1000. The genetic variations among the 58 robusta accessions were also determined by principal coordinate analysis (PCoA) using GenAIEX 6.5 software (Peakall et al. Citation2012). Further, the Bayesian model was used to delineate the clusters of genetically similar accessions and the Bayesian bar plots were constructed using the STRUCTURE program ver.2.2, (Pritchard et al., Citation2000). The number of clusters (K) was determined following 10 independent runs for each value of K ranging from 1 to 10. The admixture model with 104 Markov Chain Monte Carlo (MCMC) repetitions and 105 burn-in periods were applied. The convenient K was determined using the ad-hoc parameter (ΔK) of Evanno et al. (Citation2005) using STRUCTURE HARVESTER web server v0.6.94 (Earl and Vonholdt., Citation2012).
Results
SRAP Analysis
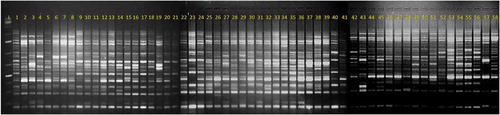
A total of 632 distinct scorable fragments were generated across 58 C. canephora accessions using 49 SRAP primer combinations (). The number of amplified fragments per primer combinations ranged from 4 (Me12-Em6 & Me12-Em9) to 24 (Me11-Em13) with an average number of 12.89 fragments amplified per primer combination (). Among the 632 amplified fragments, 507 (80.22%) were polymorphic, with an average of 10.35 polymorphic fragments per primer combination. The percent polymorphic fragments across the primer combinations ranged from 20% (Me3-Em11) to a maximum of 100% with an average of 80.22% polymorphism. Among 49 SRAP primer combinations screened, 5 primer combinations (Me1-Em2, Me3-Em6, Me6-Em4, Me6-Em5 and Me9-Em4) showed 100% polymorphism. The size of the amplified fragments by different primer combinations ranged from 90bp to 3500bp among the accessions. The informative and discriminatory capacity of each primer combination was determined by calculating the PIC, RP, PI, EMR and MI and indicated in . The Rp value ranged from 4.38 (Me6-Em11) to 34.38 (Me11-Em13) with an average of 15.60. Similarly, the PIC ranged from 0.11 (Me12-Em6) to 0.77 (Me3-Em14) with an average of 0.48 (). Further, 23 out of 49 polymorphic SRAP primer combinations recorded PIC value of 0.50 or more. MI was calculated for each primer combination and ranged from 0.03 (Me3-Em11) to 13.30 (Me6-Em4) with an average of 4.60. The EMR value varied from 0.20 to 19.00 with a mean value of 8.59. The SRAP primer combination index varies from 0.80 to 13.30 with a mean value of 6.55.
Table 2. Details of data generated by screening C. canephora germplasm using SRAP primer pairs
Figure 1. The DNA amplification pattern of 58 Coffea canephora germplasm accession screened using SRAP (ME11+ EM13) primer Lane L: 1Kb+ DNA Ladder, Lanes 1 to 58: Confirms to R1 to R58 canephora accessions
The fragments generated by SRAP primer combination primers across the 58 robusta germplasm accessions were computed to understand the frequency occurrence of each amplified fragment. It was observed that 35% of the total amplified fragments were more common and amplified in 90–100% frequency whereas only 7% of total fragments were of rare occurrence being amplified in 0.1 to 4.99% frequency across the germplasm accession (Table S3). Forty nine SRAP primers generated 29 unique fragments in 17 robusta accessions (Table S4). The maximum number of unique bands was generated in Wayanad C-2 (5) and one unique band was generated in each of the ten robusta accessions (DR-3, DR-4, Wayanad C-5, Wayanad C-21, Wayanad C-23, Wayanad C-24, S.3399, S.1979, S.1977 and Nana Robusta). However, 13 robusta accessions (DR-2, DR-5 M.P, DR-9, DR-19, DR-20, Wayanad C-2, Wayanad C-4, Wayanad C-21, Wayanad C-24, CxR, S.1979, S.3656 and Warriot C-2) showed the absence of a single specific band that was present in all other germplasm lines. Interestingly, the absence of the maximum number of the unique band was observed in Wayanad C-2(9) (Table S4).
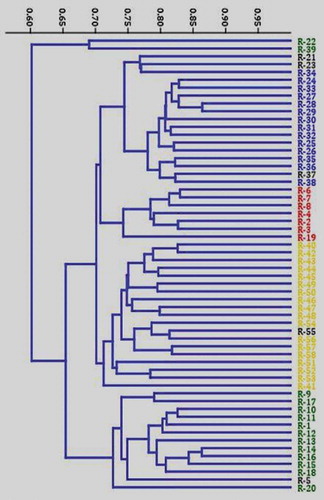
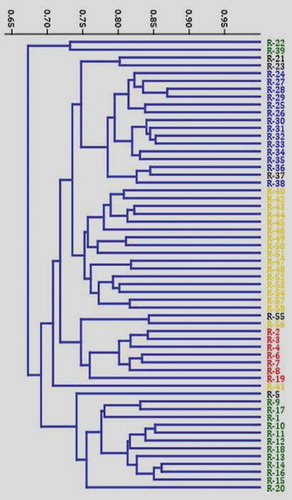
Based on the matrix analysis of SRAP data, the Jaccard’s similarity coefficient between the accessions showed a range of 0.495 to 0.864 with an average similarity value of 0.709. The Similarity was highest between R-28 and R-29 and least between R-22 and R-55. The dendrogram constructed using the hierarchical UPGMA analysis of the Jaccard’s similarity matrix grouped the 58 C. canephora accessions into two major clusters (). The first major cluster comprises of only two (R22 and R39) accessions. The second major cluster dived in to two minor clusters. The first minor cluster comprises of four distinct sub-minor clusters. Interestingly majority of the Wayanad accessions were grouped in sub-minor cluster 2 and the exotic canephora germplasm accessions were grouped in sub-minor cluster 4. The second minor cluster comprises of two sub-minor clusters and included the drought tolerant robusta collections ().
Figure 2. Jaccard’s similarity index based dendrogram generated using SRAP assay depicting the relationships among the 58 Coffea canephora germplasm accessions
PCoA Analysis
The principal coordinate analysis (PCoA) and multidimensional scaling distributed the 58 canephora accessions across all the coordinates which revealed the existence of a substantial level of genetic diversity among them (Fig. S1). The PCoA mapped a maximum of 25 C. canephora accessions comprising of almost all exotic collections to coordinate 1. The majority of Wayanad robusta collections are distributed in coordinate 2 and few are scattered in coordinate 3. Similarly, half of the drought-tolerant C. canephora accessions were scattered in coordinate 4. And rest were randomly distributed in coordinate 1 and 3 (Fig. S1). The PCoA analysis confirms the distribution pattern of the accessions in the dendrogram.
SCoT Analysis
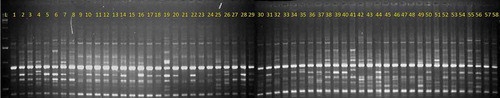
SCoT primers were employed to assess the genetic variability in 58 C. canephora germplasm accessions. The 31 SCoT primer generated a total of 331 distinct fragments among these 225 were polymorphic. The size of the amplified product varies from 290bp to 4000bp among different accessions (). The number of amplified fragments ranged from 4 (SCoT-10) to 18 (SCoT-2, SCoT-52 and SCoT-78) with an average of 10.67 fragments per primer (). Similarly, the number of polymorphic fragments amplified by polymorphic SCoT primers ranged from 1 (SCoT,1,SCoT 10, SCoT 23, SCoT 28, SCoT 73 and SCoT 74) to 17 (SCoT 2) with an average of 7.26 fragments per locus. The percent polymorphism ranged from 10% to a maximum of 100% with an average of 67.98% polymorphism across all the accessions. Among 31 primers screened, primer (SCoT-62) showed 100% polymorphism. The Rp value ranged from 6.03 (SCoT-10) to 26.69 (SCoT-52) with an average of 14.84 among 31 SCoT primers. Similarly, the PIC values ranged from 0.10 (SCoT-74) to 0.76 (SCoT-46) with an average of 0.37 (). Further, eight out of 31 SCoT primers recorded a PIC value of more than 0.50. MI was calculated for each SCoT primer and ranged from 0.01(SCoT 23 and SCOT 74) to 8.03 (SCoT −2) with an average of 2.58. The EMR value varied from 0.1 (SCoT 74) to 16.02 (SCoT-2) with a mean value of 5.61. The primer index of 31 SCoT primers varied from 0.88 (SCoT 23, SCoT 24) to 9.90 (SCoT 78) with a mean value of 4.22 ().
Table 3. Details of data generated by screening C. canephora germplasm using SCoT primers
Figure 3. The DNA amplification pattern of 58 Coffea canephora germplasm accession screened using SCoT 29 primer Lane L: 1Kb+ DNA Ladder, Lanes 1 to 58: Confirms to R1 to R58 canephora accessions
The fragments generated by SCoT primers across the 58 robusta germplasm accessions were computed to understand the frequency occurrence of each amplified fragment. The fragments generated by SCoT primers across the 58 robusta germplasm accessions were computed to understand the frequency occurrence of each amplified fragment. It was observed that 47% of the total amplified fragments were more common and amplified in 90–100% frequency whereas only 7% of total fragments were of rare occurrence being amplified in 0.1 to 4.99% frequency across the germplasm accession (Table S5). Thirty-one SCoT primers generated 13 unique fragments in five C. canephora accessions (Table S4). The maximum number of unique fragments was produced in DR-19 (7) whereas only one unique band was generated in each of the three robusta accessions (Wayanad C-4, S.880 and S.3656) of which two accessions belong to exotic variety. Further, four C. canephora accessions (DR-6, DR-7 CxR and S.3656) did not produce a specific band that was amplified in all other germplasm accessions (Table S4).
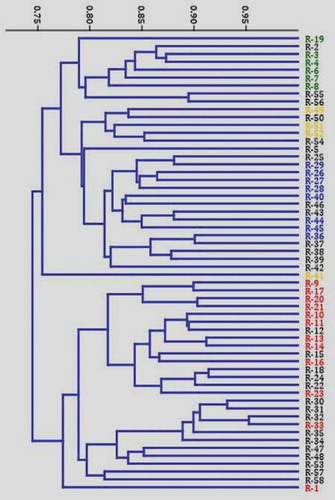
The dendrogram generated using UPGMA analysis based on Jaccard’s similarity coefficient of SCoT markers of 58 C. canephora accessions is presented (). The genetic similarities varied from 0.604 to 0.953 with an average similarity value of 0.778. The Similarity was highest between R-32 and R-58 and least between R-1 and R-2. The dendrogram generated with hierarchical UPGMA analysis of the Jaccard’s similarity matrix grouped the 58 C. canephora accessions in to two distinct major clusters (). The first major cluster divided into two minor clusters. The first minor cluster comprises three sub-minor clusters. The first sub-minor cluster mainly includes seven drought tolerant accessions (R2, R3, R4, R19, R6, R7, and R8). The second sub-minor cluster consists of four exotic C. canephora accessions from Costa Rica and Ivory Coast along with the Indian cultivar (S.274). The third sub-minor cluster comprises six exotic C. canephora accessions such as R40 (Java), R42 (Uganda), R43 (Costa Rica), R44 (Saigon), R45 (Uganda) and R46 (Ivory Coast), along with other Wayanad C. canephora accessions (). The second minor cluster is represented by a single accession that is R-41 (Madagascar). The second major cluster dived into two minor clusters. The first minor cluster has two sub-minor clusters. The first sub-minor cluster contains eleven drought tolerant canephora accessions along with few Wayanad collections whereas the second sub-minor cluster mainly contains Wayanad collections along with few Wayanad accessions. The second minor cluster is represented by single robusta (R-1) accession ()
Figure 4. Jaccard’s similarity index based dendrogram generated using SCoT assay depicting the relationships among the 58 Coffea canephora germplasm accessions
PCoA Analysis
The principal coordinate analysis (PCoA) and multidimensional scaling based on the SCoT markers data delineated the 58 C. canephora accessions across all the coordinates, which revealed the existence of a substantial level of genetic diversity among them (Fig. S2). The PCoA mapped a maximum of 16 C. canephora accessions to coordinate 1 consisting of nine exotic collections and few Wayanad and Warriott accessions. The drought-tolerant accessions are equally distributed in coordinates 2 and 3 along with some Wayanad collections. Interestingly, the Wayanad C. canephora accessions were scattered in all the coordinates (Fig. S2). Few exotic and Warriot collections got scattered in coordinate 4. The PCoA analysis confirms the pattern of distribution of the accessions in the dendrogram obtained using SCoT marker analysis (Fig. S2).
Combined SRAP and SCoT Data
In order to obtain more accurate genetic estimates between C. canephora germplasm accessions, a combined analysis was carried out by pooling SRAP and SCoT data together. Jaccard’s genetic similarity ranged from 0.573 (R-19 and R-22) to 0.869 (R-28 and R-29). The Jaccard’s genetic similarity matrix based on combined data obtained by SRAP and SCoT molecular markers was used and a dendrogram was constructed showing the genetic affinities among the accessions (). The dendrogram obtained by combined data analysis is similar to the dendrogram generated by the SRAP marker having two main clusters. Like the SRAP dendrogram, the first major cluster comprises only two (R22 and R39) accessions (). Except for minor changes in the placement of the accessions in the minor and sub-minor clusters, the structure of the combined dendrogram is similar to the SRAP dendrogram. The results of the principal coordinate analysis (PCoA) and multidimensional scaling based on SRAP and SCoT markers combined data delineated the 58 C. canephora accessions across all the coordinates indicating a substantial level of diversity among them (Fig. S3).The PCoA mapped a maximum of 25 C. canephora accessions in coordinate 1 consisting of almost all exotic collections and some C. canephora accessions from Wayanad region. Similarly, almost all the drought-tolerant accessions are distributed in coordinate 2 and 3 and consisting of nine exotic collections and some Wayanad collections. Almost all drought-tolerant accessions except R9 are distributed in coordinate 2 and 3 whereas coordinate 4 mainly comprises of germplasm accessions from Wayanad along with few exotic collections (Fig. S3).
Figure 5. Dendrogram showing the relationships among the 58 Coffea canephora germplasm accession analyzed using combined SRAP and SCoT data based on Jaccard’s similarity index
Population Structure Assessment
The data obtained by analyzing 58 C. canephora accessions employing 49 SRAP and 31 SCoT primers were subjected to admixture model-based simulations analysis by varying K from 2 to 9. The result demonstrated that for both SRAP and SCoT marker analysis, the maximum delta K value obtained was K = 4 as depicted by a sharp peak (Fig. S4 and S5). The Bayesian bar plots were constructed using the Bayesian method with the admixture model. Further based on the inferred ancestry of individuals, considering the membership fractions, the accessions with the probability of >70% for a particular subgroup were assigned to the corresponding subgroups and those accessions with the probability value of <70% for any subgroup were categorized as the admixtures.
Population Structure Analysis Using Data Generated by SRAP
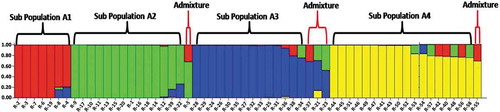
The Bayesian bar plot analysis using data generated by 49 SRAP primer combinations grouped the 58 Robusta accessions into 4 subpopulations designated as A1 (Red vertical bars), A2 (Green vertical bars), A3 (Blue vertical bars) and A4 (Yellow vertical bars) (). Among 58 accessions, 7 (12.0%) were assigned to subpopulation A1, 14 (24.1%) were assigned to subpopulation A2, 14 (24.1%) were assigned to subpopulation A3, 18 (31.0%) were assigned to subpopulation A4 and the rest 5 (8.6%) accessions appeared to have ancestry from more than one subpopulation, (Q values of less than 70% for all the four subpopulations). Further, the subpopulations A1 and A2 accommodated 19 out of 20 DR accessions along with 2 other accessions Wayanad C-2 and CxR. The A3 subpopulation accommodated 14 out of 18 Wayanad C. Canephora accessions, whereas the A4 subpopulation consists of accessions from Ivory Coast, Uganda, Costa Rica, Madagascar, Saigon, Java, Guatemala and Warriot collections. Further, the admixture population included one accession each from DR, Warriot and three Wayanad accessions ().
Figure 6. Population structure of 58 Coffea canephora germplasm accession based on SRAP assay at K = 4. Each color represent one subpopulation (A1 = Red bars, A2 = Green bars, A3 = Blue bars and A4 = Yellow bars)
Population Structure Analysis Using Data Generated by SCoT
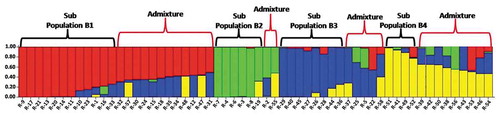
The Bayesian bar plot analysis using data generated by 31 SCoT primers grouped the 58 Robusta accessions into 4 subpopulations B1 (Red vertical bars), B2 (Green vertical bars), B3 (Blue vertical bars) and B4 (Yellow vertical bars) (). Among 58 accessions, 12 (20.6%) were assigned to subpopulation B1, 6 (10.3%) were assigned to subpopulation B2, 8 (13.8%) were assigned to subpopulation A3, 4 (6.8%) were assigned to subpopulation A4 and the remaining 28 (48.3%) accessions appeared to have ancestry from more than one subpopulation, (Q values of less than 70% for all the four subpopulations). Among the 20 DR accessions, 15 were grouped in B1 (9) and B2 (6) subpopulations and 5 were grouped as admixtures. Further among the 18 Wayanad robusta accessions, 3 were placed in B1 subpopulation, 5 were placed in B3 subpopulation and the remaining 10 were grouped as admixtures. The B4 subpopulation composed of 2 accessions from Ivory Coast and one each from Madagascar and Costa Rica ().
Figure 7. Population structure of 58 Coffea canephora germplasm accession based on SCoT assay at K = 4. Each color represent one subpopulation (B1 = Red bars, B2 = Green bars, B3 = Blue bars and B4 = Yellow bars)
Discussion
Assessment of the crop genetic diversity and understanding of the genetic relationship among the germplasm collections is essential for the success of breeding programs and the conservation of genetic resources. In a perennial plant like C. canephora, genetic improvement through conventional breeding is slow and therefore finding the agronomic useful traits including the abiotic stress tolerance could hasten the robusta improvement program. In the present study, two different marker systems, SRAP and SCoT were applied for the first time to analyze the extent and pattern of genetic diversity among 58 C. canephora germplasm accessions available in the Indian gene bank. Both SRAP and SCoT markers were selected because both the markers are simple techniques based on PCR approaches, high reproducibility, cost-effective and target the conserved DNA regions in the genome (Li and Quiros., Citation2001; Collard and Mackill., Citation2009; Bhawna et al., Citation2017). Therefore it is expected that the amplification products generated by SRAP and SCoT markers may be correlated to functional genes and their corresponding traits (Luo et al., Citation2011, Bhawna et al., Citation2017, Wang et al. Citation2016).
In the present study, both SRAP and SCoT markers were proved to be very effective and revealed a high level of polymorphism among the analyzed samples. The percent of polymorphism detected by SRAP (80.22) is considerably higher than the SCoT (67.98) marker. In a previous study, Ferrao et al. (Citation2013) compared the efficiency of three marker systems RAPD, AFLP and SSR in characterizing C. canephora germplasm accessions from Brazil and observed 79.26%, 79.48% and 100% polymorphism respectively using these markers. Therefore, the polymorphism obtained by SRAP in the present study is comparable to the level of polymorphism obtained by RAPD and AFLP markers but lower than the SSR marker. Further, the mean values of PIC, RP, PI, EMR and MI were higher for SRAP than SCoT markers (). The polymorphism information content (PIC) and resolving power (RP) determines the effectiveness and abilities of the marker system in DNA fingerprinting analysis (Etminan et al., Citation2018). In the present study, the PIC values obtained for SRAP and ScoT primers are 0.48 and 0.37 respectively ( and ). Previously, Ferrao et al. (Citation2013) analyzed the genetic diversity of C. canephora accessions and obtained PIC value of 0.19, 0.18 and 0.39 using RAPD, AFLP and SSR markers. The PIC values obtained in the present study using both SRAP and SCoT marker assay is higher as compared to other markers observed by Ferrao et al. (Citation2013). In another study, Ogutu et al. (Citation2016) obtained a PIC value of 0.54 by analyzing 96 coffee accessions including wild coffee species and cultivars from Kenya using SSR markers. Similarly, Gomez et al. (Citation2009) analyzed the genetic diversity of wild C. canephora from the Guineo-Congolean distribution zone using 16 SSR and 8 RFLP markers and obtained a PIC value of 0.58 and 0.56 respectively. In another study, Mishra et al. (Citation2014) obtained higher mean PIC values of 0.648 among wild Ethiopian arabica germplasm using SRAP markers and suggested that maximum genetic diversity is observed among the germplasm at the center of origin. Since the Guineo-Congolean region is considered as one of the centers of origin of C. canephora, it is expected to display a higher mean PIC value because of the higher proportion of genetic variation. However the higher PIC value obtained by SRAP markers clearly attributed to the high genetic diversity among the C. canephora accessions which represent only a part of Indian robusta collections as well as supports the earlier contention of Mishra et al. (Citation2012) that compared to other PCR-based marker systems, SRAP markers are more suitable in genetic fingerprinting of coffee germplasm. Further, the higher RP value of SRAP primers compared to other markers also signifies the better discriminatory potential of these primers. Since there are no earlier reports regarding the effectiveness of SCoT marker in coffee, the average PIC value (0.37) obtained in the present study using SCoT markers was compared with PIC values obtained in other tree species like Cocos nucifera (0.33; Rajesh et al., Citation2015), Jatropha curcas (0.04 to 0.50; Mulpuri et al., Citation2013) and Tinospora cordifolia (0.33; Paliwal et al., Citation2013), and found to be more or less similar. However, PIC values obtained with SCoT markers in some other tree species like Dendrobium nobile (0.78; Bhattacharyya et al., Citation2013), Camellia sinensis (0.79; Zhang et al., Citation2011) and Rose germplasm. (0.78; Agarwal et al., Citation2018) were found to be higher than C. canephora.
Both marker index (MI) and effective multiplex ratio have been used by many workers to evaluate the discriminatory capabilities of different marker systems in various plant species such as apricot (Kumar et al., Citation2009), jatropha (Tatikonda et al., Citation2010) and pongamia (Thudi et al., Citation2010). According to Powell et al. (Citation1996) both PIC and MI provide a global metric for marker efficiency. Therefore the MI and EMR of SRAP and SCoT markers employed in the present study were compared with the RAPD, AFLP and SSR markers (Ferrao et al., Citation2013) for their usefulness in detecting genetic variations of C. canephora accessions. Thus SRAP markers were found more informative and reliable with respect to the quantum of genetic variability detected which is evident from effective multiplex ratio (RAPD = 3.8, AFLP = 23.10, SSR = 1.0, SRAP = 8.59, SCoT = 5.61) and marker index (RAPD = 0.6, AFLP = 4.15, SSR = 0.39, SRAP = 4.60, SCoT = 2.58). In the current study, 7% rare alleles with less than 5% of the frequency of occurrence were amplified by both SRAP and SCoT markers across the 58 C. canephora germplasm accessions. SRAP and SCoT markers amplified 46 and 23 rare alleles of which 29 and 11 were unique fragments respectively (Table S3 and S5). Further, several germplasm lines have failed to amplify specific fragments that are amplified in all germplasm lines except one. The occurrence, as well as the conspicuous absence of unique amplified fragments, appears to be important since these amplified fragments after validation could be used as molecular tags for identification of a particular germplasm line as well as can be used in marker- assisted selection for crop improvement.
The genetic similarity coefficient obtained in our study varied from 0.495 to 0.864 with an average value of 0.709 in the case of SRAP and 0.604 to 0.953 with an average of 0.778 in the case of SCoT markers. Further, the analysis of pooled data (SRAP + SCoT) revealed a similarity coefficient ranging from 0.573 to 0.869 with an average of 0.735. The genetic similarity values obtained in the present study are slightly lower than the values obtained in arabica germplasm analysis using SRAP markers (Jingade et al., Citation2019; Mishra et al., Citation2014). The neighbor-joining (NJ) dendrogram constructed by SRAP, SCoT and combined data (SRAP + SCoT) separated the 58 C. canephora accessions into four main groups (, and ). Although some of the accessions were constantly assembled together in all three different cluster analyses, the dendrogram generated based on SRAP markers data displayed perspicuous clustering. Further, the clustering pattern obtained using the pooled SRAP and SCoT binary data closely resembled with the dendrogram generated using SRAP data alone. The impact of SRAP data may be attributed due to a higher number of markers involved in the genetic analysis as compared to that of the SCoT. The manifested incongruity between dendrograms generated by two different molecular marker systems was reported earlier (Arif et al., Citation2009; Sonia and Gopalakrishna., Citation2007). Discordance between dendrograms obtained using different marker techniques could be explained by the fact that different marker systems target different regions of the genome and thereby creating variability in the level of polymorphism as well as the number of loci and their coverage of the overall genome (Souframanien and Gopalakrishna., Citation2004). In fact, better resolution of crop genotypes and their phylogeny can be achieved by using a large number of highly polymorphic markers.
The model-based Bayesian analysis of population structure divided the 58 C. canephora accessions into four ancestral groups using SRAP (A1, A2, A3 and A4) and SCoT (B1, B2, B3 and B4) marker analysis ( and ). This approach primarily relied on the rate of change in the log probability of data between successive K values (Evanno et al., Citation2005). The Bayesian clustering approach assists in the identification of population structure and allocation of individual or part of genetic information to several clusters based on multilocus genotypes (Chen et al., Citation2007). This result of STRUCTURE analysis aligned with assessment using the Neighbor-Joining method. PCoA analysis from SRAP, SCoT, SRAP and SCoT combined data showed a similar result to those obtained using STRUCTURE and cluster analysis. For example, the drought tolerant canephora accessions (R1-R20) which were collected from local coffee plantations of Waynad provinces during severe drought season made two distinct groups irrespective of the molecular marker data analysis and this is reflected in the dendrogram, PCoA and STRUCTURE analysis. The Bayesian analysis at K = 4 using SRAP analysis has identified five (8.62%) admixture accessions of which three accessions belong to Wayanad robusta population and one each from drought-tolerant and Warriot collections. However, the Bayesian analysis at K = 4 using the SCoT analysis provided interesting insights to the population structure and identified 31 (53.44%) admixture accessions of which 9 each belong to drought-tolerant and Wayanad collections, six accessions belong to exotic collections and five belong to Warriot collections. Interestingly, the identification of different groups within the drought tolerant, Waynad and Warriot collections based on Baysian analysis appears to be significant since all the collected samples are in close proximity (within the same province) and the differential genetic architecture of these samples signifies the presence of massive genetic diversity among robusta germplasm in India. Further, both the Indian commercial cultivars (S. 274 and CxR) were also identified as admixture accessions by SCoT analysis. This has clearly demonstrated that STRUCTURE analysis using the SCoT marker has a higher discriminating power to resolve the accessions based on the genome sharing in the population. The presence of high admixtures in C. canephora accessions clearly suggested the possibility of genomic exchanges between the accessions or parental lineages belonging to different gene pools (Linos et al., Citation2014; Tamaki et al. Citation2014).
Conclusion
Our findings revealed the presence of large genetic diversity among the representative C. canephora germplasm accessions from India. Based on SRAP and SCoT analysis the study has identified 31 C. canephora accessions which were more diverse and therefore need to be meticulously conserved for enriching the genetic diversity and could be further utilized in coffee improvement program to address emerging challenges such as adaptation to climate change and resistance to new pests and diseases, while also increasing yield and cup quality.
Author’s contribution statement
MKM developed the study concept and experimental design. BMS and AKH participated in material collections. PJ and AKH carried out the SRAP and SCoT analysis. BMS, PJ and AKH carried out the data analysis and MKM provided the data interpretation. MKM prepared the manuscript and all authors approved the final version of the manuscript for submission.
Compliance with Ethical Standards
All experiments are carried out by using good laboratory practices prescribed by Government of India
Supplemental Material
Download MS Word (785.3 KB)Acknowledgments
The authors thank Mr. K.S. Sreeharsha for help during sample collection and Director of Research Central Coffee Research Institute for providing laboratory facilities. The financial support received from Coffee Board, Govt. of India is gratefully acknowledged.
Supplementary material
Supplemental data for this article can be accessed on the publisher’s website.
Additional information
Funding
References
- Agarwal, A., V. Gupta., S.U. Haq., P.K. Jatav., S.L. Kothari., and S. Kachhwaha. 2018. Assessment of genetic diversity in 29 rose germplasms using SCoT marker. J. King Saud. Univ. Sci. doi: 10.1016/j.jksus.2018.04.022.
- Anagbogu, C.F., R. Bhattacharjee., C. Ilori., P. Tongyoo., K.E. Dada., A.A. Muyiwa., P. Gepts., and D.M. Beckles. 2019. Genetic diversity and re-classification of coffee (Coffea canephora Pierre ex A. Froehner) from South Western Nigeria through genotyping-by-sequencing-single nucleotide polymorphism analysis. Genet. Resour. Crop Evol 66(3):685–696. doi:10.1007/s10722-019-00744-2.
- Anderson, J.A., G.A. Churchill., J.E. Sutrique., S.D. Tanksley, and M.E. Sorrells. 1993. Optimizing parental selection for genetic linkage maps. Genome 36(1):181–186. doi: 10.1139/g93-024.
- Anonymous. 2014. Coffee Guide: A manual of coffee cultivation. Published by Central Coffee Research Institute, Karnataka, India.
- Arif, M., N.W. Zaidi., Y.P. Singh., Q. Haq., and U.S. Singh. 2009. A comparative analysis of ISSR and RAPD markers for study of genetic diversity in Shisham (Dalbergia sissoo). Plant Mol. Biol. Rep. 27(4):488–495. doi: 10.1007/s11105-009-0097-0.
- Bhattacharyya, P., S. Kumaria., S. Kumar., and P. Tandon. 2013. Start codon targeted (SCoT) marker reveals genetic diversity of Dendrobium nobile Lindl, an endangered medicinal orchid species. Gene 529:21–26. doi: 10.1016/j.gene.2013.07.096.
- Bhawna, M.Z., L. Arya., and M. Verma. 2017. Use of SCoT markers to assess the gene flow and population structure among two different population of bottle gourd. Plant Gene 9:80–86. doi: 10.1016/j.plgene.2016.09.001.
- Bikila, A.B., N.S. Sakiyama., and E.T. Caixeta. 2017. SNPs based molecular diversity of Coffea canephora. J. Microbiol. Exp 5. doi: 10.15406/jmen.2017.05.00136.
- Botstein, D., R.L. White, M.H. Skolnick., and R.M. Davies. 1980. Construction of a genetic map in man using restricted length polymorphism. Am. J. Hum. Genet. 32(3):314–331.
- Chen, C., E. Durand., F. Forbes., and O. Francois. 2007. Bayesian clustering algorithms ascertaining spatial population structure: A new computer program and a comparison study. Mol. Ecol. Notes. 7(5):747–756. doi: 10.1111/j.1471-8286.2007.01769.x.
- Collard, B.C.Y., and D.J. Mackill. 2009. Start codon targeted (SCoT) polymorphism: A simple, novel DNA marker technique for generating gene-targeted markers in plants. Plant Mol. Biol. Rep 27(1):86–93. doi: 10.1007/s11105-008-0060-5.
- Cubry, P., D.F. Bellis., D. Pot., P. Musoli., and T. Leroy. 2013. Global analysis of Coffea canephora Pierre ex Froehner (Rubiaceae) from the Guineo-Congolese region reveals impacts from climatic refuges and migration effects. Genet. Resour. Crop Evol. 60(2):483–501. doi: 10.1007/s10722-012-9851-5.
- Davis, A.P., H. Chadburn, J. Moat., R. O’Sullivan, S. Hargreaves, and E.N. Lughadha. 2019. High extinction risk for wild coffee species and implications for coffee sector sustainability. Sci. Adv. 5(1):eaav3473. doi: 10.1126/sciadv.aav3473.
- Earl, D.A., and B.M. Vonholdt. 2012. STRUCTURE Harvester: A website and program for visualizing structure output and implementing the evanno method. Conserv. Genet. Resour. 4(2):359–361. doi: 10.1007/s12686-011-9548-7.
- Etminan, A., A.P. Aboughadareh., A. Noori., A.A. Rad., L. Shooshtari., Z. Mahdavian., and M.Y. Khanian. 2018. Genetic relationships and diversity among wild Salvia accessions revealed by ISSR and SCoT markers. Biotechnol. Biotec. Eqp 32(3):610–617. doi: 10.1080/13102818.2018.1447397
- Evanno, G., S. Regnaut., and J. Goudet. 2005. Detecting the number of clusters of individuals using the software structure: a simulation study. Mol. Ecol. 14(8):2611–2620. doi: 10.1111/mec.2005.14.issue-8.
- Ferrao, L.F.V., E.T. Caixeta., F.F. Souza., and E.M. Zambolin. 2013. Comparative study of different molecular markers for classifying and establishing genetic relationships in Coffea canephora Plant Syst. Evol 299:225–238. doi: 10.1007/s00606-012-0717-2.
- Garavito, A., M. Christophe., R. Guyot, and B. Bertrand. 2016. Identification by the DArTseq method of the genetic origin of the Coffea canephora cultivated in Vietnam and Mexico. BMC Plant Biol. 16(1):242. doi: 10.1186/s12870-016-0933-y.
- Garrido-Cardenas, J.A., C. Mesa-Valle., and F. Manzano-Agugliaro. 2018. Trends in plant research using molecular markers. Planta 247(3):543–557. doi: 10.1007/s00425-017-2829-y.
- Ghislain, M., D. Zhang., D. Fajardo., Z. Huaman., and R. Hijmans. 1999. Marker-assisted sampling of the cultivated andean potato Solanum Phureja collection using RAPD markers. Genet. Resour. Crop Evo. 46(6):547–555. doi: 10.1023/A:1008724007888.
- Gomez, C., S. Dussert., P. Hamon., S. Hamon., A. de Kochko., and V. Poncet. 2009. Current genetic differentiation of Coffea canephora Pierre ex A. Froehn in the Guineo-Congolian African zone: Cumulative impact of ancient climatic changes and recent human activities. BMC Plant Biol. 9:167. doi: 10.1186/1471-2148-9-167.
- International Coffee Organization (ICO) Report. 2017. Coffee market ends 2017/18 in surplus. https://icocoffeeorg.tumblr.com/post/178884744500/coffee-market-ends-201718-in-surplus.
- Jaccard, P. 1908. Nouvelles recherches sur la distribution florale. Bull. Société vaudoise Sci. Nat. 44:223–270. doi: 10.5169/seals-268384.
- Jiang, L.F., X. Qi., X.Q. Zhang., L.K. Huang., X. Ma., and W.G. Xie. 2014. Analysis of diversity and relationships among orchardgrass (Dactylis glomerata L.) accessions using start codon-targeted markers. Genet. Mol. Res. 13(2):4406–4418. doi: 10.4238/2014.June.11.4.
- Jingade, P., A.K. Huded., B. Kosaraju., and M.K. Mishra. 2019. Diversity genotyping of Indian coffee (Coffea arabica L.) germplasm accessions by using SRAP markers. J. Crop Improv 33(3):327–345. doi: 10.1080/15427528.2019.1592050.
- Kesawat, M.S., and B.D. Kumar. 2009. Molecular Markers: It’s Application in Crop Improvement. J. Crop Sci. Biotechnol. 12(4):169–181. doi: 10.1007/s12892-009-0124-6.
- Kumar, M., G.P. Mishra., R. Singh., P.K. Naik., S. Dwivedi., Z. Ahmad., and S.B. Singh. 2009. Genetic variability studies among apricot populations from cold arid desert of Ladakh using DNA markers. Indian J. Hort. 66(2):147–153.
- Leroy, T., D.F. Bellis., H. Legnate., P. Musoli., A. Kalonji., R.G.L. Solorzano., and P. Cubry. 2014. Developing core collections to optimize the management and the exploitation of diversity of the coffee Coffea canephora. Genetica 142(3):185–199. doi: 10.1007/s10709-014-9766-5.
- Li, G., and C.F. Quiros. 2001. Sequence-related amplified polymorphism (SRAP), a new marker system based on a simple PCR reaction: its application to mapping and gene tagging in brassica. Theor. Appl. Genet. 103(2–3):455–461. doi: 10.1007/s001220100570.
- Li, P., X. Zhan., Q. Que., W. Qu., M. Liu., K. Ouyang., J. Li., X. Deng., Z. Junjie., B. Liao., et al. 2015. genetic diversity and population structure of Toona Ciliata Roem. Based on sequence-related amplified polymorphism (SRAP) markers. Forests 6(12):1094–1106. doi: 10.3390/f6041094.
- Liao, B., F. Wang., L. Chen., P. Li., K. Ouyang., R. Pian., M. Liu., Q. Que., X. Zhou., W. Xi., et al. 2016. Population structure and genetic relationships of Melia Taxa in China assayed with sequence- related amplified polymorphism (SRAP) markers. Forests 7(12):81. doi: 10.3390/f7040081.
- Linos, A., N. Nikoloudakis., A. Katsiotis., and M. Hagidimitriou. 2014. Genetic structure of the greek olive germplasm revealed by RAPD, ISSR and SSR Markers. Sci. Hort 175(C):33–43. doi: 10.1016/j.scienta.2014.05.034.
- Luo, C., X He., and H Chen., S, J, Ou., M, P, Gao., J, S, Brown., C, T, Tondo., R, J. Schnell., 2011. Genetic diversity of mango cultivars estimated using SCoT and ISSR markers, Biochemical Systematics and Ecology, 39 (4–6),676-684, https://doi.org/10.1016/j.bse.2011.05.023
- Milbourne, D., R. Meyer., J.E. Bradshaw., E. Baird., N. Bonar., J. Provan., W. Powell., and R. Waugh. 1997. Comparison of PCR based marker systems for the analysis of genetic relationships in cultivated potato. Mol. Breeding 3(2):127–136. doi: 10.1023/A:1009633005390.
- Mishra, M.K., and A. Slater. 2012. Recent Advances in the Genetic Transformation of Coffee. Hindawi Publishing Corporation. Biotechnol Res Int 2012:1–17. doi: 10.1155/2012/580857.
- Mishra, M.K., P. Tornincasa, B. de-Nardi, E. Asquini., R. Dreos, L.D. Terra, R. Rathinavelu., P. Rovelli, A. Pallavicini., and G. Graziosi. 2011a. Genome organization in coffee as revealed by EST PCR-RFLP, SNPs and SSR Analysis. J. Crop Sci. Biotechnol 14(1):25–37. doi: 10.1007/s12892-010-0035-6.
- Mishra, M.K., S. Nishani., and Jayarama. 2011b. Genetic relationship among indigenous coffee species from India Using RAPD, ISSR, and SRAP marker analysis. Biharean Biol 5(1):17–24. doi: 10.2298/ABS1103667M.
- Mishra, M.K., S. Nishani., M. Gowda., D. Padmajyothi., N. Suresh., H.L. Sreenath., and Y. Raghuramulu. 2014. Genetic diversity among Ethiopian Coffee (Coffea arabica L.) collections available in Indian gene bank using sequence related amplified polymorphism markers. Plant Breed. Seed Sci 70(1):29–40. doi: 10.1515/plass-2015-0011.
- Mulpuri, S., T. Muddanuru., and G. Francis. 2013. Start codon targeted (SCoT) polymorphism in toxic and non-toxic accessions of Jatropha curcas L. and development of a codominant SCAR marker. Plant Sci. 207:117–127. doi: 10.1016/j.plantsci.2013.02.013.
- Ogutu, C., T. Fang., L. Yan, L. Wang., W. Lu., L. Huang., X. Wang., B. Ma., X. Deng., A. Owiti., et al. 2016. Characterization and utilization of microsatellites in the Coffea canephora genome to assess genetic association between wild species in Kenya and cultivated coffee. Tree Genet. Genomes 12(3):54. doi: 10.1007/s11295-016-1014-y.
- Paliwal, R., R. Singh., A. Singh., S. Kumar., A. Kumar., and R.S. Majumdar. 2013. Molecular Characterization of Giloe (Tinospora cordifolia Willd. Miers ex Hook. F. and Thoms.) accessions using Start Codon Targeted (SCoT) markers. Int. J. Med. Arom. Plants 3:413–422.
- Peakall, R., and P.E. Smouse. 2012. GenAlEx 6.5: Genetic Analysis in Excel. Population genetic software for teaching and research-an update. J. Bioinform. 28(19):2537–2539. doi: 10.1093/bioinformatics/bts460.
- Powell, W, M Morgante, C Andre, M Hanafey, J Vogel, S Tingey, and A Rafalski. 1996. The comparison of rflp, rapd, aflp and ssr (microsatellite) markers for germplasm analysis. Molecular Breeding 2:225-238. doi:10.1007/BF00564200.
- Prakash, N.S., M.C. Combes., S. Dussert., S. Naveen., and P. Lashermes. 2005. Analysis of genetic diversity in Indian robusta coffee genepool (Coffea canephora) in comparison with a representative core collection using SSRs and AFLPs. Genet. Resour. Crop Evol. 52(3):333–343. doi: 10.1007/s10722-003-2125-5.
- Prevost, A., and M.J. Wilkinson. 1999. A new system of comparing PCR primers applied to ISSR finger printing of potato cultivars. Theor. Appl. Genet. 98(1):107–112. doi: 10.1007/s001220051046.
- Pritchard, J.K., P. Stephens., and P. Donnelly. 2000. Inference of population structure using multi locus genotype data. Genetics 155(2):945–959.
- Que, Y., Y. Pan., Y. Lu., C. Yang., Y. Yang., N. Huang., and L. Xu. 2014. Genetic analysis of diversity within a Chinese local sugarcane germplasm based on start codon targeted polymorphism. BioMed Res. Int. 2014:1–10. doi: 10.1155/2014/468375.
- Rajesh, M.K., A.A. Sabana., K.E. Rachana., S. Rahman., B.A. Jerard., and A. Karun. 2015. Genetic relationship and diversity among coconut (Cocos nucifera L.) accessions revealed through SCoT analysis. 3 Biotech 5(6):999–1006. doi: 10.1007/s13205-015-0304-7.
- Rajwade, A.E., R.S. Arora., N.Y. Kadoo., A.M. Harsulkar., P.B. Ghorpade., and V.S. Gupta. 2010. Relatedness of Indian Flax Genotypes (Linum usitatissimum L.): an inter-simple sequence repeat (ISSR) primer assay. Mol. Biotechnol 45(2):161–170. doi: 10.1007/s12033-010-9256-7.
- Ram, A.S., M.S. Sreenivasan., and R. Naidu. 1994. Exploitation of coffee germplasm in India – II. Diploid species. J. Coffee Res. 24:107–114.
- Rohlf, F.J. 1995. NTSYS-pc numerical taxonomy and multivariate analysis system version 2.02. Exterior software, Setauket, New York.
- Shangguo, F., Y. Zhu., Y. Chenliang., K. Jiao., M. Jiang., J. Lu., C. Shen., Q. Ying., and H. Wang. 2018. Development of species-specific SCAR markers, based on a SCoT analysis, to authenticate physalis (Solanaceae) Species. Front. Genet 9:192. https://www.frontiersin.org/article/10.3389/fgene.2018.00192.
- Singh, A., R. Avtar., D. Singh., O. Sangwan., and P. Balyan. 2013. Genetic variability, character association and path analysis for seed yield and component traits under two environments in indian mustard. J. Oilseed Brassica 4(1):43–48.
- Solorzano, R.G.L., D.F. Bellis., T. Leroy., L. Plaza., H. Guerrero., C. Subia., D. Calderon., F. Fernandez., I. Garzon., D. Lopez., et al. 2017. Revealing the diversity of introduced coffea canephora Germplasm in Ecuador: towards a national strategy to improve robusta. Sci. World J. 2017:1–12. doi: 10.1155/2017/1248954.
- Sonia, C., and T. Gopalakrishna. 2007. Comparative assessment of REMAP and ISSR marker assays for genetic polymorphism studies in Magnaporthe grisea. Curr. Sci 93:688–692. https://www.jstor.org/stable/24099392.
- Souframanien, J., and T. Gopalakrishna. 2004. A comparative analysis of genetic diversity in blackgram genotypes using RAPD and ISSR markers. Theor. Appl. Genet 109(8):1687–1693. doi: 10.1007/s00122-004-1797-3.
- Sousa, T.V., E.T. Caixeta, E.R. Alkimim., A.C.B. de Oliveira., A.A. Pereira., N.S. Sakiyama., M.F.J. de Resende., and L. Zambolim. 2017. Population structure and genetic diversity of coffee progenies derived from Catuaí and Híbrido de Timor revealed by genome-wide SNP marker. Tree Genet. Genomes 13(6):124. doi: 10.1007/s11295-017-1208-y.
- Tamaki, I., and M. Okada. 2014. Genetic admixing of two evergreen oaks, Quercus acuta and Q. sessilifolia (Subgenus Cyclobalanopsis), Is the result of interspecific introgressive hybridization. Tree Genet. Genomes 10(4):989–999. doi: 10.1007/s11295-014-0737-x.
- Tatikonda, L., S.P. Wani., S. Kannan., N. Beerelli., K. Sreedevi., D.A. Hoisington., P. Devi., and R.K. Varshney. 2010. AFLP-based molecular characterization of an elite germplasm collection of Jatropha curcas L, a biofuel plant. Plant Sci. 176(4):505–513. doi: 10.1016/j.plantsci.2009.01.006.
- Thudi, M., R. Manthena., S.P. Wani., L. Tatikonda., D.A. Hoisington., and R.V. Varshney. 2010. Analysis of Genetic Diversity in Pongamia [Pongamia pinnata (L) Pierrre] using AFLP Markers. J. Plant Biochem. Biot 19(2):209–216. doi: 10.1007/BF03263342.
- Tshilenge, P., K.K. Nkongolo., M. Mehes., and A. Kalonji. 2009. Genetic variation in Coffea canephora L. (Var. Robusta) accessions from the founder gene pool evaluated with ISSR and RAPD. Afr. J. Biotechnol 8(3):380–390. http://www.academicjournals.org/AJB.
- Wang, Y., S Li., X Zhang., Y Wang., and C Zhang. 2016. Isolation and analysis of differentially expressed genes during ovule abortion in the seedless grape, scientia horticulturae. 211(376–383):. https://doi.org/10.1016/j.scienta.2016.09.014.
- Wei, Y.L., X. He., C. Luo., and H. Chen. 2012. Genetic diversity of Podocarpus by SCoT markers. Guangxi Zhiwu/Guihaia 32(1):90–93.
- Zhang, J.Y., D.L. Guo., Y. Gong., C.H. Liu., M. Li., and G.H. Zhang. 2011. Optimization of start codon targeted polymorphism PCR (SCoT-PCR) system in Vitis vinifera. J. Fruit Sci. 28:209–214.
- Zhang, Y., X. Zhang., X. Chen., W. Sun., and L. Jiao. 2018. Genetic diversity and structure of tea plant in Qinba area in China by three types of molecular markers. Hereditas 22:155. doi: 10.1186/s41065-018-0058-4.
- Zitouna, N., M. Gharbi., H. Chennaoui., A. Touati., I. Fadhlaoui., N. Trifi-Farah., and S. Marghali. 2015. Characterization of Sulla Species via SRAP Markers: Polymorphism and Systematic Analyses. Merit Res. J. Agri. Sci. Soil Sci 3(6):089–097. http://meritresearchjournals.org/asss/index.htm.