
ABSTRACT
The aim of this work was to fill the gap in California pest management by evaluating coverage and spatial uniformity of spray rig designs used in California strawberry production. Coverage can be improved up to 30% if the important design parameters are identified, which would reduce pests. Field evaluations were conducted in beds with 4 canopy lines in Santa Maria, CA on 162 cm beds and in Oxnard, CA on 172 cm beds as well as in beds with 2 canopy lines in Watsonville, CA on 122 cm beds and 132 cm beds. Water-sensitive paper cards placed adaxial and abaxial, both horizontally and vertically on plant canopies located near the middle and edge of the bed were used as the evaluation criteria. Data were analyzed by regression. Results from spray evaluations (n = 21) included recording the nozzle used, manifold height, number of nozzles per bed, volume sprayed, nozzle pressure, and tractor speed, as well as determining the percent coverage from 1,568 water-sensitive spray cards. Increasing nozzle pressure can potentially increase coverage by 9.18%. Positioning the nozzle closer to the canopy level can also significantly increase coverage.
Introduction
California strawberries are the sixth most valuable crop in the state with an estimated 35,800 acres harvested in 2018 (NASS-USDA, Citation2019). Nearly 280,000 pounds of pesticides were used in 2016 in California strawberries (NASS-USDA, Citation2016). Ensuring a thorough and uniform placement of the applied materials is paramount for reducing excessive pesticide use that could lead to resistance and environmental health issues (Shi et al., Citation2013). Evaluation of currently used spray rigs on strawberry canopies in field conditions could improve current pest management strategies in strawberries as they did in other crops (Nansen and Ridsdill-Smith, Citation2013). Evaluation identifies current coverage of the spray rig. The spray coverage is affected by parameters such as nozzle used, manifold height above canopy, number of nozzles per bed, volume sprayed, nozzle pressure, and tractor speed. By evaluating spray rigs, the parameters which have a significant effect on coverage can be identified, and by identifying these parameters, making impactful changes to them can improve coverage.
California strawberry growers primarily utilize spray rigs with hollow cone or flat fan nozzles, which differ in coverage patterns. These rigs are often unique to each grower. To maximize coverage, spray rigs are designed with several considerations such as particle size, drift, and spray volume. Smaller droplets can produce better leaf canopy coverage (Bache and Johnstone, Citation1992). However, they are more susceptible to drift (Wolf, Citation1997, Citation2005). Increasing spray volume does not correlate to better spray coverage in a study where greater spray volumes show wide variations of coverage (Nansen et al., Citation2018). Increased spray volumes can lead to increased pesticide drift, which has environmental consequences, contaminated water supplies, and increased cost to growers due to wasted product (Garcerá et al., Citation2017; Mazlan et al., Citation2016).
The main objective of this paper is to evaluate coverage and spatial uniformity of spray rig designs utilized in California strawberry production. The following rig design parameters were recorded: nozzle manufacturer, quantity, height above canopy, spacing, atomizing pressure, and application rate. Water-sensitive paper was used as the evaluation criteria.
Materials and Methods
Evaluating a Spray Rig
Spray rigs used for California strawberry production were evaluated to determine spray coverage and spatial uniformity by spraying water and quantified with water-sensitive spray cards (20301–1 N, TeeJet Technologies, Springfield, IL, USA) that turn from yellow to blue when wet. The spray rigs were chosen due with respect to grower discretion. Spatial uniformity is defined as the standard deviation for each rig. The spray card evaluations followed a similar protocol that was used by Nansen’s card evaluations (Nansen et al., Citation2018). The cards were oriented horizontally facing downwards toward the bed and vertically facing away from the driving direction of the rig. They were placed on canopies located in the middle of the bed and on the edge of the bed as shown in as well as in the mid-tier of the canopy with leaves above and below; i.e. adaxially and abaxially. The cards were labeled on the nonsensitive side with MH for middle horizontal, MV for middle vertical, EH for edge horizontal, and EV for edge vertical before field placement, consistent with the placement in the canopy. Each replication consisted of 80 cards: 4 reps in 5 locations in the bed and 4 cards per location with the locations distributed according to the evaluation map shown in . The rig design was recorded prior to the evaluation. The parameters consisted of pressure (kPa), volume (l/ha), number of nozzles, nozzle type, manifold height (cm), and tractor speed. The time and weather were recorded when the spray rig passed over the cards placed in the canopy. Weather conditions were recorded from a local weather station (https://www.wunderground.com/weather/us/ca). A miniature weather flow device (WFANO-01B, WeatherFlow, Scotts Valley, CA, USA) was used to measure wind speed. After the evaluation, cards were allowed to dry, then collected in paper bags and affixed on A4 paper. Spray cards were digitized with a scanner of 300 dpi. Spray coverage was determined by the percent of measurable blue (wetted) area over the original yellow (dry) area of the cards.
Figure 1. Water-sensitive paper cards are placed in vertical and horizontal positions at the top and mid-tier of the canopy, respectively. The active side of card is oriented away from the sprayer or downward toward the bed (i.e. hard-to-reach areas of the canopy).
Figure 2. Evaluation trial map. Four water-sensitive paper cards are placed at five locations along each bed. In the depicted scenario, a spray rig would travel up bed 1, then down bed 9 and again for bed 17 and 25. Each bed is considered a replication.
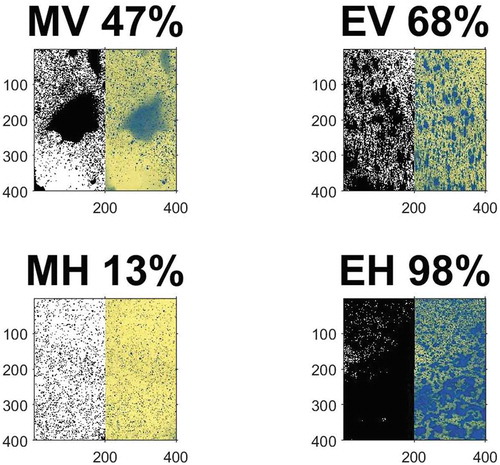
Spray cards were analyzed using MATLAB image processing toolbox (Mathworks, Citation2017). The program extracted the spray cards from each A4 paper and then viewed the green channel of the RGB space of each card. The borders of the card were cropped leaving an image pixel width of 200 and height of 400. This removed artifacts from the binder clip impression of the card to the leaf and water pooling at the card’s edges. A static threshold of 75% intensity was set to identify blue vs. yellow pigmentation. This threshold was chosen based on the recommendations of three pest control advisors that serve the California strawberry industry. The pigment blue was then marked as 1, and yellow was marked as 0 to form a binary image. The program then looped through each card and identified the percent coverage of the card according to the threshold as seen in . After all card percentage coverages were determined, the average was taken of all cards; this was the percentage coverage for the rig.
Figure 3. Sample image of four water-sensitive paper cards (right) and their respective binary image (left) side by side. Boarders of card images have been cropped to minimize artifacts. Images are labeled MV, EV, MH, and EH to indicate their plant row location and card orientation: middle, edge, horizontal, and vertical. Program calculated coverage is shown above each image.
Spray card evaluations were conducted from March 2019 through July 2019 at different locations and with different varieties. All evaluations had plants at a growth stage where each canopy overlapped with neighboring plant canopies. A total of 1600 cards were measured over the 20 evaluations.
Results
Evaluating a Spray Rig
The comparison of the spray rig working conditions for each evaluation can be seen in . Of the 21 evaluations, locations varied between Santa Maria, CA, Oxnard, CA, and Watsonville, CA. Dates varied throughout evaluations, with some evaluations occurring on the same day. Varieties included Monterey, Marquis, Fonteras, Proprietary Plant Science, Proprietary Driscolls, and Cabrillo. Bed width was either 162 cm or 173 cm for 4 plant row beds and either 132 cm or 122 cm for 2 plant row beds. Nozzles varied from disc core hollow cone to flat fans from differing manufacturers. Manifold heights ranged from below canopy to at canopy and above canopy up to 30.5 cm. The number of nozzles per bed ranged from 10 to 20. The volume rate applied ranged from 1066 to 1871 l/ha. Pressures ranged from 586 to 3447 kPa. The tractor speed ranged from 2.1 km/h to 7.2 km/h.
Table 1. Spray rigs used in the study classified by their working conditions. It should be noted that plant rows of 4 and 2 per bed indicate a bed width of 162, 172 cm, 120 cm, and 132 cm, respectively. a denotes Santa Maria, b denotes Oxnard, and c denotes Watsonville.
The 21 rig evaluations show coverage ranges from 40% to 97%% shown in . Of the 21 rigs, 8 of them had coverage over 70%, while 7 of them had coverage below 50%.
Figure 4. Evaluation percent coverages of rigs 1 through 21. The error bars indicate 1 standard deviation. Wind speeds were within 10 km/h of each other for each evaluation. All plant canopies were at a similar growth stage.
Discussion
The findings of this study suggest that manifold height above canopy, spray volume atomization pressure have a significant effect on spray coverage but not on spatial uniformity. With regression analysis, it was determined that manifold height, spray volume, and atomization pressure had the most effect on spray coverage, with standardized coefficients of 3.19, 4.46, and 9.18, respectivelyy. The rigs that sprayed with a manifold at or below canopy achieved greater coverage than rigs that sprayed at a distance above the canopy. Humidity did not have a significant effect on coverage due to the fact that humidity levels were less than the threshold of the cards. The calculated least significant difference means with their upper and lower bound confidence intervals, shows the groups of rigs that are significantly different with one another as well as rigs that are not. These results were conducted by spraying only water, but with real operating conditions these results will be affected by the product sprayed, which includes adjuvants that may have beneficial affects on the coverage but may have adverse effects on the nozzle tip wear. Further studies are needed to clearly determine a predictive relationship between design parameters and spray coverage.
Table 2. Summary of Means (Fisher’s LSD)* of Spray Rig Coverage. *Means that do not share the same letter are significantly different p ≤ 0.05.
Conclusion
California strawberry spray rigs are a gap in pest management and further studies are needed to thoroughly cover the gap. From the discoveries of the conventional rigs in California strawberries, such technologies as pulse width modulation nozzles to reduce drift and improve coverage might be worth looking into (Butts et al., Citation2018). By focusing on the design parameters of these rigs, the spray coverage can likely be improved.
Declaration Of Interest Statement
All authors declare no conflict of interest.
Acknowledgments
We thank the Cal Poly Strawberry Center, the California Strawberry Commission, and the collaboration of several California strawberry growers. We also would like to thank TeeJet for donating spray rig parts that were used in this study.
Additional information
Funding
References
- Bache, D.H., and D.R. Johnstone. 1992. Microclimate and spray dispersion. Ellis Horwood, Chichester, U.K.
- Butts, T.R., L.E. Butts, J.D. Luck, B.K. Fritz, W.C. Hoffmann, and G.R. Kruger. 2018. Droplet size and nozzle tip pressure from a pulse-width modulation sprayer. Biosyst. Eng. 178:52–69. doi: 10.1016/j.biosystemseng.2018.11.004.
- Garcerá, C., E. Moltó, and P. Chueca. 2017. Spray pesticide applications in Mediterranean citrus orchards: Canopy deposition and off-target losses. Sci. Total Environ. 599–600:1344–1362. doi: 10.1016/j.scitotenv.2017.05.029.
- Mathworks. (2017). Natick, Massachusetts.
- Mazlan, A.Z., H. Hussain, and M.A.M. Zawawi. 2016. Potential dermal exposure assessment of farmers to herbicide imazapic in an agriculture area. Procedia Soc.Behav. Sci. 234:144–153. doi: 10.1016/j.sbspro.2016.10.229.
- Nansen, C., E. de Lange, A. Stewart, M. Edsall, and S.K. Dara. 2018. Evaluating pesticide spray coverage patterns for improved pest control efficacy. ANR Blogs, Davis, Calif. 4 July. https://ucanr.edu/blogs/blogcore/postdetail.cfm?postnum=27648
- Nansen, C., and T.J. Ridsdill-Smith. 2013. The performance of insecticides – A critical review, p. 195–232. In: S. Trdan. (ed.). Insecticides. IntechOpen Limited, London, UK.
- NASS-USDA. 2016. Strawberries-total insecticides used in lbs 2016. NASS-USDA, Washington D.C., USA.
- NASS-USDA. 2019. Strawberries-acres planted, harvested, and production in $ 2018. NASS-USDA, Washington D.C.
- Shi, M., P.J. Collins, T.J. Ridsdill-Smith, R.N. Emery, and M. Renton. 2013. Dosage consistency is the key factor in avoiding evolution of resistance to phosphine and population increase in stored-grain pests. Pest Manag. Sci. 69(9):1049–1060. doi: 10.1002/ps.3457.
- Wolf, R.E. 1997. Equipment to reduce spray drift. Cutting Edge. 97(7):1.
- Wolf, R.E. 2005. Comparing downwind spray droplet deposits of four flat-fan nozzle types measured in a wind tunnel and analyzed using droplets can software. Am. Soc. Agri. Eng. 21(2):173–177.