
 ?Mathematical formulae have been encoded as MathML and are displayed in this HTML version using MathJax in order to improve their display. Uncheck the box to turn MathJax off. This feature requires Javascript. Click on a formula to zoom.
ABSTRACT
This study was carried out to evaluate fruit quality of five sweet cherry cultivars grown in Morocco, namely, Burlat, Van, Cerisette, Napoleon and Coeur de pigeon. Significant differences (p˂0.05) were observed across the five cultivars in fruit weight (5.24–8.72 g), geometric mean diameter (14.22–16.36 mm), pH (3.48–4.12), soluble solid content (17.70–24.50 °Brix), total phenolics (426.44–485.69 mg GAE/100 g fresh weight (fw)), total proanthocyanidins (51.17–131.20 mg CE/100 g fw) and total anthocyanins (194.53–267.67 mg cya-3-glu/100 g fw). The antioxidant activity was evaluated by three assays. The values were 11.96–21.04, 16.48–63.96 and 9.62–15.65 mmol TE/g for DPPH scavenging test, FRAP and ABTS, respectively. Volatile compounds were identified and semi-quantified in sweet cherry fruit using solid-phase microextraction in combination with gas chromatography/mass spectrometry (SPME-GC/MS). Nine volatile compounds (benzaldehyde, nonanal, ethyl hexanoate, ethyl octanoate, γ-terpinene, β-pinene, limonene, linalool and 2-ethyl-1-hexanol) were detected in all sweet cherry cultivars. Aldehydes compounds were the most abundant in sweet cherry aroma, followed by terpenes and esters. Correlation between all parameters showed varying trends.
Introduction
Native to Europe and western Asia, sweet cherries are classified within the genus Prunus, which belong to the Rosaceae family (Iezzoni, Citation2008). This attractive fruit is highly favored by consumers for its excellent quality (Aglar et al., Citation2017; Guler et al., Citation2019). Sweet cherry fruit quality is influenced by morphological and nutritional properties. Fruit size, color and sweetness are the important factors in consumer preferences and acceptance as bigger fruit and are generally considered to be more attractive to the eye. Sweet cherries contain high levels of nutrient and bioactive compounds with significant health benefits. Sweet cherries are well known for their rich nutritional content and a broad range of bioactive compounds. They are rich in anthocyanins as the major phenolics (Díaz-Mula et al., Citation2009; Öztürk et al., Citation2019). Sweet cherries are reported to be rich in cyanidin 3-glucoside, cyanidin 3-sophoroside, cyanidin 3-rutinoside, pelargonidin 3-glucoside, pelargonidin 3-rutinoside, peonidin 3-rutinoside and peonidin 3-glucoside (Chaovanalikit and Wrolstad, Citation2004). Neochlorogenic acid and p-coumaroylquinic acid were reported as the predominant hydroxycinnamate compounds in sweet cherry fruit (Gonçalves et al., Citation2007b). Flavonols and flavan-3-ols were also found in sweet cherries, which included catechin, epicatechin, quercetin 3-glucoside, quercetin 3-rutinoside and kaempferol 3-rutinoside (Gonçalves et al., Citation2007b; Öztürk et al., Citation2019).
There have been a broad range of in vitro and in vivo reports which have linked sweet cherries bioactive components to numerous health benefits. Thus, sweet cherries derived extracts are crucial in free radical scavenging, cell oxidative injury protection (Yoo et al., Citation2010), anti-inflammatory action (Jacob et al., Citation2003; Zhou et al., Citation2012), anti-tumor proliferation (Bobe et al., Citation2006; Kang et al., Citation2003) and alleviation of diabetic complications (Ataie-Jafari et al., Citation2008) among others. However, there is a well established scientific data suggesting that the levels of these bioactive molecules depend on various preharvest and postharvest factors such as cultivar, maturity stage, growing conditions, pre- and postharvest treatments ( Aglar et al., Citation2017; Gonçalves et al., Citation2007b; Usenik et al., Citation2008). The average of bioactive content varied among different cultivars (Ferretti et al., Citation2010; Gao and Mazza, Citation1995; Usenik et al., Citation2015).
In Morocco, sweet cherry cultivars are limited with both the “Burlat” and “Van” being dominant cultivars. Therefore, the present investigation on the morphological, physicochemical and biochemical characteristics of Burlat, Van, Cerisette, Napoleon and Coeur de pigeon sweet cherry cultivars was initiated to provide practical information and guidance for optimal way to valorize them.
Materials and Methods
Material
The study was carried out in 2017 on five sweet cherry cultivars named Burlat, Van, Cerisette, Napoleon and Coeur de pigeon. The cultivars were planted in a complete randomized block in the research experimental station relevant to the Institut National de Recherche Agronomique (INRA) in Meknes (elevation: 500 m; lat. 33:6 N; long. 5:1 W). The region is characterized by a climate ranging from the Mediterranean to continental with cold winters and hot summers. The total annual rainfall varies between 400 and 600 mm. The average annual temperature is 10.8°C with an average maximum of 29°C and a minimum of 9.5°C.
The soil is a sandy clay loam type with an average organic matter of 1% [0–30 cm soil layer], the average soil pH is 7.2. Standard cultural practices such as irrigation, fertilization, disease control were regularly applied during the experimental period. Fruit were harvested during their maturity period of May–July and were considered fully ripened when the entire surface of cherry fruit was light-red colored.
Morphological Parameters
For each cultivar, 150 fruits from three trees (50 fruits per tree) were hand-harvested at full maturity. Morphological parameters such as fruit, stone and stem weight, as well as fruit dimensions (length, width and thickness) were measured.
The geometric mean diameter (Dg) and sphericity (Ø) were calculated using the equations below (Aydin, Citation2003; Saracoglu et al., Citation2017):
where L is the length; W is the width and T is the thickness.
The surface area (S) in cm2 of the fruit can be written as follows (Baryeh, Citation2001):
The volume (V) in cm3 was calculated from the following relationship (Özarslan, Citation2002):
Flesh/stone ratio was calculated using the formula: (fruit weight − stone weight/stone weight) (Demir and Kalyoncu, Citation2003). Peel color measurements were obtained from two spots located on opposite sides of the equatorial region of the fruit using an NH310 colorimeter calibrated to a white calibration plate (Shenzhen 3NH Technology, China). The mean of the two measurements was considered as one replicate. Chromatic analysis was carried out following the CIE (Commission International de l’Eclairage) system of 1976.
Physicochemical Parameters
Initial moisture content of the fruit was determined by drying the fruits in a hot air oven at 105°C for 24 h (AOAC, Citation2007). Initial moisture content was determined for 15 fruits in each replication. For titratable acidity (TA), pH and soluble solid content (SSC) measurements, 60 fruits were selected from each replicate, and fruits were divided into 3 groups each with 20 fruits. Fruit juice was extracted with an electrical fruit juice extractor (Moulinex, type NE 401, France). For the determination of titratable acidity (TA), the juice (10 mL) was diluted in 50 mL distilled water and then titrated with 0.1 N NaOH to an end point of pH 8.1 using an automatic pH titration system (Ph 211, Microprocessor pH meter). The pH was measured with the same pH meter. Titratable acidity was expressed as a percentage of the malic acid because this is the predominant organic acid in cherry. The soluble solid content (SSC) was determined with a refractometer (DR6000, A. Krus Optronic GmbH, Humburg, Germany) and expressed as °Brix. On the basis of the measured data, the SSC/TA ratio was calculated and used as an indicator of taste quality. Ash was determined by igniting a weighed sample in a muffle furnace at 550°C for 3 h. The physicochemical parameters were performed in triplicate.
Biochemical Parameters
Extraction Preparation
For total phenolics, total proanthocyanidins, total anthocyanin and antioxidant activity, 60 pitted fruits were selected from each replicate and homogenized with a food blender. Fruit extracts were prepared by mixing 2 g of cherry pulp with methanol solvent (20 mL) and auto-stirred for 30 min. The mixture was centrifuged at 6000 rpm for 15 min at 4°C, and the resulting slurry was filtered through No.1 whatman paper. Three replicate extractions for each cultivar were performed.
Total Phenolics (TP)
Total phenolic content of the cherry was determined using the Folin-Ciocalteu reagent (Singleton and Rossi, Citation1965). Briefly, a volume of 0.25 mL of methanolic extract was mixed with 0.25 mL Folin-Ciocalteu reagent (2 N) and 2 mL of distilled water and allowed to stir by vortex for 3 min; then, 0.25 mL of sodium carbonate (20% w/v) was added, and after 30 min of incubation in the dark, the absorbance was measured at 750 nm using a spectrophotometer. The results are expressed as mg gallic acid equivalent in 100 g fresh weight (mg GAE/100 g fw), and the TP were determined in triplicate.
Total Proanthocyanidins (TPAC)
TPAC was determined based on acid hydrolysis and color formation (Porter et al., Citation1985). To 2 mL of the extract, 20 mL of ferrous sulfate solution (77 mg of FeSO4 7H2O in 500 mL of HCl: n-butanol 2:3) was added. The mixture was incubated for a maximum of 15 min at 95°C. For a control sample, 2 mL of distilled water was used. After incubation, the sample was cooled and analyzed by measuring absorbance at 540 nm. TPAC was calculated according to the following equation:
where A: absorbance of the extract, MW: molar weight of cyanidin (287 g/mol), DF: dilution factor, ɛ: molar extinction coefficient of cyanidin (34700 L.mol−1.cm−1) and l: pathlength (cm). Total proanthocyanidins were expressed as mg of cyanidin equivalent/100 g fresh weight (mg CE/100 g fw) and were measured in triplicate.
Total Anthocyanins (TAC)
Anthocyanins in cherry extracts were identified by the differential pH method (Ozgen et al., Citation2008) using two buffers: potassium chloride buffer pH 1.0 (25 mM) and sodium acetate buffer pH 4.5 (0.4 M). Briefly, 0.4 mL of methanol extract was taken, and one of them was adjusted to 3.6 mL with potassium chloride KCl (25 mM) buffer, pH = 1.0, and the other with sodium acetate C2H3NaO2 (0.4 M) buffer, pH = 4.5. The TAC was calculated as follows:
where A: absorbance = [(A510 nm-A700 nm)] pH1.0-[(A510 nm-A700 nm)] pH4.5; MW: molecular weight of cyanidin-3-glucoside (449.2 g moL−1); ɛ: molar extinction coefficient of cyanidin-3-glucoside (26.900 L.mol–1.cm–1).
The TAC was determined in triplicate and the results were expressed as mg of cyanidin-3-glucoside equivalent per 100 g fresh weight (mg cya-3-gluc/100 g fw).
Determination of Antioxidant Activities
The antioxidant activity was evaluated using three different assays: (i) the free radical scavenging activity was tested using DPPH and ABTS assays and (ii) the ferric reducing ability (FRAP assay). The antioxidant activity was determined in triplicate and the results were reported as the mean ± standard deviation.
DPPH Assay
Antioxidant radical scavenging activity was performed according to the method of Brand-Williams et al. (Citation1995). The stock solution was prepared by dissolving 0.01 mM DPPH (2,2-diphenyl-1-picrylhydrazyl) with 100 mL methanol. The methanol extract 0.1 mL was added to 3.9 mL of DPPH solution. The decrease in absorbance of the resulting solution was monitored at 515 nm after 1 h of incubation in the dark. The results were expressed as mmol Trolox equivalents per g fresh weight (mmol TE/g fw).
ABTS Assay
ABTS radical scavenging assay was carried out as described by Pellegrini et al. (Citation1999). The ABTS solution was prepared through the reaction of 7 mM of ABTS•+ (2,2ʹ-azinobis(3-ethylbenzothiazoline-6-sulfonic acid)) and 2.45 mM potassium persulfate K2S2O8. After incubation at 23°C in the dark for 12–16 h, the ABTS solution was then diluted with 100 mM phosphate buffer (pH 7.6) to obtain an absorbance of (0.700 ± 0.005) at 734 nm. ABTS solution 3.9 mL was added to 0.1 mL of the extract sample and mixed vigorously. The reaction mixture was allowed to stand at 23°C for 10 min and the absorbance at 734 nm was immediately recorded. The results were expressed as mmol Trolox equivalents per g fresh weight (mmol TE/gfw).
FRAP Assay
Ferric Reducing Antioxidant Power (FRAP) assay was performed following the method described by Benzie and Strain (Citation1996). In brief, 40 µL of methanol extract was mixed thoroughly with 0.2 mL of distilled water and 1.8 mL of FRAP reagent. The FRAP reagent was prepared by mixing acetate buffer (300 µM, pH 3.6), a solution of 10 µM TPTZ (2,4,6-Tri (2-pyridyl)-s-triazine) in 40 µM hydrochloric acid HCl and 20 µM Iron (III) chloride FeCl3 at 10:1:1 (v/v/v). After incubation at 37°C for 10 min, the absorbance of the mixture was measured at 593 nm. The results were expressed as mmol Trolox equivalents per g fresh weight (mmol TE/g fw).
Identification and Quantification of Volatile Compounds by GC-MS
Volatile compounds were extracted from cherry using headspace solid-phase microextraction (HS-SPME) (Cano-Lamadrid et al., Citation2018; Melgarejo et al., Citation2014). Samples of 5 g of lyophilized cherry and 10 mL ultrapure water were placed into 50 mL vials with polypropylene caps and PTFE/silicone septa. A magnetic stirring bar was added, together with sodium chloride NaCl (15%), and the vial was placed in a water bath with controlled temperature and automatic stirring. The vials were equilibrated during 15 min at 40°C in a water bath to simulate the mouth temperature during the chewing process, and after this equilibration time, a 50/30 μm DVB/CAR/PDMS fiber was exposed to the sample headspace for 50 min at 40°C. This type of fiber was chosen for its high capacity of trapping fruit volatile compounds (Calín-Sánchez et al., Citation2011). After sampling, desorption of the volatile compounds from the fiber coating was carried out in the injection port of the GC-MS for 3 min.
The identification of the volatile compounds was performed on a gas chromatography (GC-MS), Shimadzu GC-17A (Shimadzu Corporation, Kyoto, Japan), coupled with a Shimadzu mass spectrometer detector GC-MS QP-5050A. The GC-MS system was equipped with an SLB-5 ms capillary column, 95% dimethylpolysiloxane and 5% diphenylpolysiloxane (Sigma-Aldrich, Spain; 30 m × 0.25 mm i.d., 0.25 μm film thickness). Analyses were carried out using helium as carrier gas at a flow rate of 7 mL min−1 in a split ratio of 10 and a program: (a) initial temperature 80°C; (b) rate of 3.0°C min−1 to 170°C and hold for 1 min; (c) rate of 25°C min−1 from 170°C to 300°C and hold for 3 min. Injector and detector temperatures were held at 170°C and 300°C, respectively.
Compounds were identified by three simultaneous methods: (1) retention indices, (2) GC-MS retention times (authentic chemicals), and (3) mass spectra (authentic chemicals and Wiley spectral library collection). No tentatively identified compounds have been included in this study. The samples were analyzed in triplicate and results were expressed as a percentage of the total area represented by each one of the volatile compounds.
The relative abundance of the volatile compounds (%) was performed on a gas chromatography, Shimadzu 2010, with a flame ionization detector (FID). The column and chromatographic conditions were those previously reported for the GC-MS analysis. The injector temperature was 300°C and nitrogen was used as carrier gas (1 mL min−1). The relative abundance was obtained from electronic integration measurements using flame ionization detection (FID). Benzyl acetate was used as an internal standard and the areas from all compounds were normalized using its area; this compound was chosen after checking that it was not present in the volatile profiles of the samples under study.
Statistical Analyses
Raw data were standardized (µ = 0 and a σ = 1). Data analysis was performed using SPSS 22 software. Analysis of variance was performed to test significant differences among the samples collected. The differences in morphological traits and content levels of biochemical and volatile compounds were estimated with Duncan's new multiple range (DMRT) test. Correlation coefficients and their levels of significance were calculated using Pearson correlation. Principal component analysis was carried out using a correlation matrix.
Results and Discussions
Morphological Parameters
Morphological trait assessment results of the five cultivars are summarized in . The fruit weight was significantly different among cultivars (p < .05). The mean weight varied from 5.24 g “Van” to 8.72 g “Coeur de pigeon.” The stone and stem weight ranged from 0.24 to 0.47 g and 0.04 to 0.09 g, respectively. The stem length of cherry fruit varied from 24.34 to 33.25 mm. The geometric mean diameter of each sweet cherry cultivar varied from 14.22 to 16.36 mm and the sphericity value ranged between 68.99% and 74.26%. Fruit surface area and volume varied from 6.36 to 8.43 cm2 and from 2.17 to 3.39 cm3 respectively. Average flesh/stone ratio varied from 11.08 to 21.59.
Table 1. Morphological parameters of sweet cherry cultivars
Color measurement data are reported in . Data showed that L* values ranged from 8.64 “Burlat” to 19.29 “Napoleon.” All cherry cultivars expect “Napoleon” cultivar were darker (lower L* values) tended to be less red (lower a* values) and less yellow (lower b* values). “Napoleon” cultivar was lighter and yellower than the others (higher L* and b*). Furthermore, this cultivar showed lower values of chroma (C*) and hue angle (h°), which are indicators of a lighter and less intense red color, while “Burlat,” “Van,” “Cerisette” and “Coeur de pigeon” had higher values of C* and h° corresponding to a darker color.
The cultivars grown in Morocco studied had average fruit weights significantly higher than the majority of the cultivars grown in Spain, which recorded average weight between 4.24 and 8.05 g (Pérez-Sánchez et al., Citation2008). Differences in fruit weight depend on crop load (Goncalves et al., Citation2006) and fruit maturity stage (Serrano et al., Citation2009). Sweet cherries with large fruit size and fruit weight are well prized by consumers (Hjalmarsson and Ortiz, Citation2000).
The sphericity ratio of the cultivars studied varied from 68.99% to 72.49%. These results are inferior to those reported in Turkish cultivars by Vursavuş et al. (Citation2006) that presented average sphericity between 85.27% and 90.66%. Naderiboldaji et al. (Citation2008) reported a maximum sphericity of 94% and a minimum of 91% in sweet cherry cultivars grown in Iran.
One of the most important characteristics of sweet cherry fresh fruit is flesh/stone ratio. The average flesh/stone ratio determined in this study varied between 11.08 and 21.59. The flesh/stone ratio for Turkish cultivars varied from 17.70 to 20.73 (Vursavuş et al., Citation2006).
Girard and Kopp., (Citation1998) reported a lower L*, a* and b* values in eight sweet cherry cultivars, of which four cultivars exhibited lighter, redder and yellower colors. This result is in agreement with our findings. These differences in the fruit color can be attributed to the concentration and distribution of the different anthocyanins and colorless phenolics as well as pH (Gao and Mazza, Citation1995).
Morphological traits were statistically different at p < .01 among cultivars. These properties could be beneficial to classify cultivars from a botanical point of view and understand the behavior of the product during the post harvest operations.
Physicochemical Parameters
The results for moisture content, pH, ash, titratable acidity and soluble solid content (SSC) for all cultivars are presented in . Analysis of the physicochemical data pertaining to the five cultivars showed significant variations in all parameters at (p < .05) ().
Table 2. Physicochemical parameters of sweet cherry fruit samples
The moisture content varied from 77.8% “Napoleon” to 86.11% “Van.” The pH values ranged between 3.46 “Van” and 4.12 “Coeur de pigeon.” The highest total soluble solid content was recorded in “Van” (24.50 °Brix) and the lowest value was observed in “Napoleon” (17.70 °Brix). The titratable acidity content, expressed as % malic acid, varied from 0.31 “Coeur de pigeon” to 1.08 “Napoleon.” The ratio SSC/titratable acidity oscillated between 21.38 “Napoleon” and 72.06 “Van.” The ash values were between 0.24 “Van” and 1.12% “Burlat.” Similar results were reported for other cherry cultivars from Iran (Siddiq et al., Citation2011) and Turkey (Vursavuş et al., Citation2006). However, Ballistreri et al. (Citation2013) reported higher pH and titratable acidity values in sweet cherry fruit grown in Italy than those reported in this study. They recorded a range of 3.72–4.81, 0.57–1.35% malic acid for pH and titratable acidity, respectively. These results are higher than the data reported in this study. The reasons for these differences in TA could be due to differences in the geographical growing areas. Also, the effect of genotype for TA in sour cherry fruit was observed in another study (Damar and Ekşi, Citation2012). The possible reasons for this variation can be attributed to cultivar, growing area differences, tree age and the climatic conditions in a specific year (Papp et al., Citation2010). For instance, Bolin and Stafford., (Citation1974) reported that rainfall and percentage of sunshine during the growing season, which can induce an increase in sugars and a decrease in acidity content.
Biochemical Parameters
The content of phenolics, proanthocyanidins and anthocyanins determined in sweet cherry fruit are summarized in . The total phenolics (TP) content in five different cultivars of sweet cherry ranged from 426.44 to 485.69 mg GAE/100 g fw. The highest TP content was observed for the “Burlat” cultivar (485.69 ± 2.28 mg/100 g fw) followed by the “Napoleon” cultivar (478.42 ± 6.71 mg/100 g fw). The phenolic content for Burlat and Van cherries grown in Morocco was higher than those found in the study of Faniadis et al. (Citation2010); Kelebek and Selli., (Citation2011) and Vursavuş et al. (Citation2006).
Table 3. Biochemical parameters of sweet cherry cultivars
Proanthocyanidin content (TPAC) varied from 51.17 “Napoleon” to 131.20 “Coeur de pigeon” mg cyanidin equivalent/100 g fw. The highest value of the total proanthocyanidin was observed in “Coeur de pigeon,” followed by “Van,” “Burlat,” “Cerisette” and “Napoleon” (). The proanthocyanidin content of sweet cherry samples is higher when compared to other related species such as strawberry (15.92 to 23.55 mg/100 g fw) (Oszmiański and Wojdyło, Citation2009), fig (0.072 to 3.40 mg/100 g fw) (Hssaini et al., Citation2020) and lower when compared to blueberry (118 mg/100 g fw) (Hwang et al., Citation2014).
A strong variation in terms of total anthocyanins (TAC) was observed among the cherry cultivars and it ranged from 194.53 “Cerisette” to 267.67 “Napoleon” mg cya-3-gluc/100 g fw. The cultivars can be classified from the highest to the lowest content of anthocyanin as “Napoleon,” “Burlat,” “Van,” “Coeur de pigeon” and “Cerisette” (). Our values of total anthocyanin are higher than those found by Joaquín et al. (Citation2011) and Acero et al. (Citation2019) who found 39.44 ± 2.37 mg cya-3-O-rut/100 g in ‘Ambrunés’ sweet cherry cultivar, and 52.75 mg cya-3- gluc/100 g in two cultivars grown in Spain.
The TP, TPAC and TAC contents in the studied cultivars were higher compared to previous reports. Numerous studies have demonstrated that the levels of biochemical composition are influenced substantially by the cultivar, ripening, climatic conditions and agricultural practices (Cinquanta et al., Citation2002; Saafi et al., Citation2009). Variations in these factors could explain significant variations in the levels of these secondary metabolites.
Antioxidant Activities
To evaluate the potential antioxidant activity of cherry fruit, three in vitro assays, based on the scavenging activity (DPPH), radical scavenging capacity (ABTS) and ferric reducing antioxidant potential (FRAP) were used and the results are reported in .
Figure 1. Histogram of antioxidant activity. Average values ± standard deviation are presented statistically significant differences (p < .05) among cultivars are presented over error bars (a-d)
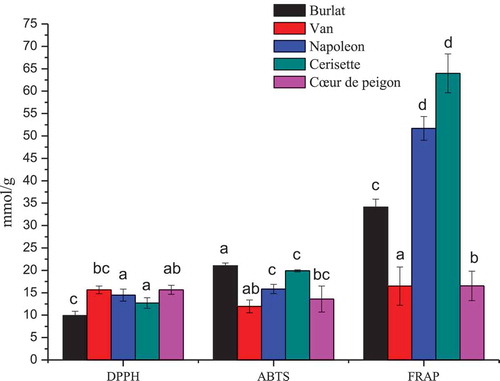
The differences in antioxidant activities among the sweet cherry cultivars were statistically significant. The average antioxidant activity values were 13.68, 16.46 and 36.56 mmol/g as determined by DPPH, ABTS and FRAP assays, respectively. The methanolic extract of cherry samples had a strong antioxidant activity for the FRAP assay. Thus, FRAP assay could be used as a good indicator of antioxidant activity in sweet cherry fruit. In addition, this technique has an advantage in terms of cost and time (Thaipong et al., Citation2006).
The antioxidant activity was determined by FRAP assay ranged from 16.48 to 63.96 mmol/g Fe2+. The ferric reducing power of the cultivars was in the following order: “Cerisette,” “Napoleon,” “Burlat,” “Van” and “Coeur de pigeon.” In nine sweet cherry cultivars, antioxidative capacity (FRAP) ranged from 0.44 to 2.67 mmol/100 g fw (Vangdal and Slimestad, Citation2006), and from 0.62 to 1.42 mmol/100 g fw for six sweet cherry cultivars (Halvorsen et al., Citation2002).
According to the data shown in , the values of ABTS assay ranged from 9.62 to 15.65 mmol/g ABTS+. The order of the fruit in the ABTS capacity assay was “Burlat,” “Cerisette,” “Napoleon,” “Coeur de pigeon” and “Van.” De Souza et al. (Citation2014) investigated the antioxidant activity of different sweet cherry cultivars grown in Turkey and reported similar results.
The DPPH radical scavenging ability values ranged from 11.96 to 21.04 mmol TE/g, the cultivars can be arranged in the following order on the basis of DPPH from high to lower: “Van,” “Coeur de pigeon,” “Napoleon,” “Cerisette” and “Burlat.” DPPH scavenging activity of cherry fruit juice was investigated by Hayaloglu and Demir., (Citation2015), they reported moderate values of scavenging activity similar to our results. This difference was most probably due to the differences in the method of the extraction and the solvent used.
The different antioxidant levels observed in this study may reflect a relative difference in the ability of antioxidant compounds in the extracts to quench aqueous peroxyl radicals and to reduce ABTS, the DPPH-free radical and ferric iron in in vitro systems.
The antioxidant activity of plant extracts is closely linked to their phenolic composition, whose anti-radical properties are known (Jakobek et al., Citation2009). In general, the antioxidant activity of the fruit is proportional to their phenolic content: samples richer in phenolic content (particularly anthocyanins, flavonols and phenolic acids) show bigger antioxidant activity (Kelebek and Selli, Citation2011).
Volatile Compounds
For the first time, the volatile compounds of the five sweet cherry cultivars grown in Morocco are investigated. Nine volatile compounds belonging to four groups were detected (): aldehydes (benzaldehyde and nonanal), esters (ethyl hexanoate and ethyl octanoate), terpenes (β-pinene, γ–terpinene, limonene and linalool) and alcohol (2-ethyl-1-hexanol). Aldehydes compounds were the most abundant in sweet cherry aroma, ranging from 3.51% in the “Cerisette” cultivar to 40.65% in the “Van” cultivar. The most abundant aldehyde compounds were benzaldehyde followed by nonanal. Benzaldehyde ranged from 2.87% for the “Cerisette” cultivar to 37.16% for the “Van” cultivar. Nonanal ranged from 0.64% for the “Cerisette” cultivar to 3.49% for the “Van” cultivar.
Table 4. Volatile compounds of five sweet cherry cultivars
Aldehydes compounds are the most primary aromas of sweet cherry fruit (Zhang et al., Citation2007). Benzaldehyde is a primary contributor to characteristic cherry flavor and originates from enzymatic hydrolysis of the amygdalin in fruit. Legua et al. (Citation2017) reported that benzaldehyde and nonanal presented the highest contents in the cultivars of Spanish sweet cherry cultivars.
Terpenes were the second most abundant groups, ranging from 7.66% for the “Coeur de pigeon” cultivar to 12.01% for the “Cerisette” cultivar. The most abundant terpene was γ-terpinene with 4.32% in the “Van” cultivar and 8.47% in the “Cerisette” cultivar. β-pinene was also identified and varied from 3.12% in the “Napoleon” cultivar to 4.10% in the “Van” cultivar (). Finally, limonene and linalool were found in very small amounts and ranged from 0.03% to 0.05% and from 0.01% to 1.08%, respectively. According to the results of Sun et al. (Citation2010), terpene compounds were high in five cherry fruit from China, and both limonene and linalool were the important aroma components.
Additionally, ester groups were only identified in “Coeur de pigeon” and “Napoleon” cultivars. Ethyl hexanoate and ethyl octanoate were the main ester compounds, and represented 13.51% and 3.71%, respectively. The study on the aroma of Hongdeng sweet cherry indicated that ester compounds were the important aromas and ethyl acetate and hexanoic acid ethyl ester were the characteristic aroma of sweet cherry (Zhanget al., Citation2007).
Other minor compounds such as alcohol were also identified and the content was not more than 1%.
Principal Component Analysis (PCA)
Principal component analysis (PCA) was performed using a correlation matrix to identify patterns of variability among the cultivars studied and to discriminate between variables in the data set (). Prior to this analysis, data were standardized to a comparable scale (µ = 0 and σ = 1). The aim was to define the main factors contributing to a better classification of the cherry cultivars based on their morphological biochemical and volatile attributes. In our study, only a principal component loading of more than 0.6 was considered significant for each factor. It is noteworthy that for each variable only eigenvector presenting significantly higher score was considered as being most correlated. Total variance was explained by four components of which the first three accounted for 88.29% ().
Table 5. Eigenvectors of principal component axes from PCA analysis
The first component consisted of 11 variables which are fruit width, flesh/stone ratio, stem width, chromatic coordinates, moisture, ashes, titratable acidity, maturity index, TPAC, ferric reducing ability and amounts of limonene of which the scores were 0.791, 0.843, 0.964, L* = −0.673, a* = −0.899, b* = −0.816, C* = −0.875, h° = 0.92, 0.623,-0.679, −0.868, 0.946, 0.746, −0.859 and 0.903, respectively. It explained about 35.37% of the total variance observed, which means that these variables had the highest variation between the cultivars and had the highest impact on discrimination between them (). The second component accounted about 29.66% of total variance, which is defined by morphological traits which are fruit thickness, diameter, sphericity, surface area and volume (0.898, 0.784, 0.947, 0.800 and 0.678, respectively) and biochemical attributes that are TP, antioxidant activity (DPPH and ABTS) and the amounts of 2-ethyl-1-hexanol and γ-terpinene (0.804, −0.991, 0.899, 0.878 and 0.631, respectively). This means that the second component referred mainly to the fruit shape and its antioxidant activity. The third component accounted for 23.15% of total inertia and is mainly explained by the volatile compounds, β-pinene, ethyl hexanoate, linalool, nonanal and ethyl octanoate. It is also correlated to fruit weight and width, stone weight, stem length and pH ().
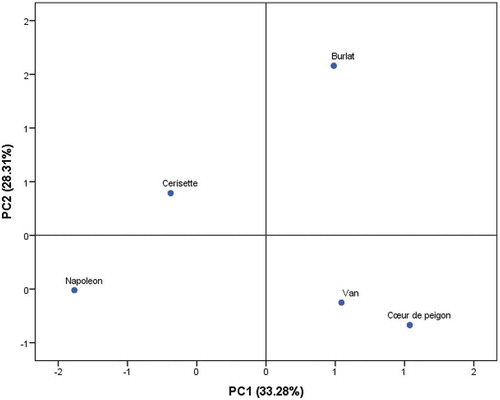
Scatter plot of the principal components was generated, PC1 and PC2, that discriminate between the cultivars according to their morphological and biochemical characteristics (). The scatter plot distribution showed that all cultivars were different except “Van” and “Coeur de pigeon” that had similar peel chromatic coordinates (Darkest peel), fruit and stem width and flesh to stone ratio (highest values). Starting from negative to positive values of PC1, the distribution of cultivars indicated an increase in the most volatile compounds, fruit weight and geometric characteristics with the exception stone weight. However, it showed a decrease in peel lightness, ash, titratable acidity and antioxidant activity (ABTS and ferric reducing ability), whereas starting from negative to positive values of PC2, fruit tend to be darker with an increase in fruit shape, TP, TPAC, ABTS and FRAP.
Figure 2. Scatter plot for the first two principal components (65.04% of total variance) for the studied cherry varieties based on all variables
Conclusion
In this study, morphological, physicochemical, bioactive and volatile compounds of sweet cherry cultivars (Burlat, Van, Cerisette, Napoleon and Coeur de pigeon) were examined. The aldehydes and terpenes were the dominant volatile compounds. The “Burlat” cultivar recorded the highest level of total phenolic content while the cultivar “Van” exhibited the lowest amount. The content of proanthocyanidin and anthocyanin was reported in Coeur de pigeon (131.20 mg cyanidin equivalent/100 g fw) and Napoleon (267.67 mg cya-3-gluc/100 g fw) respectively, while the lowest concentrations were observed in Napoleon (51.17 mg cyanidin equivalent/100 g fw) and in Cerisette (194.53 mg cya-3-gluc/100 g fw) respectively. PCA analysis showed that morphological parameters, chromatic coordinates, biochemical attributes and antioxidant activity were the most discriminative variables in cultivar assessment. These descriptors had a high level of a total variance within cultivars. Sweet cherry cultivars grown in Morocco showed good nutritional characteristics, mainly bioactive compounds and antioxidant activity, which can be of great interest in the pharmaceutical and food industries, as well as for breeding programs targeting the improvement of the domestic sweet cherry germplasm.
Acknowledgments
This work was supported by the MESRSFC and the CNRST of the Kingdom of Morocco in the priority areas of research valorization scientific and technological by innovation of local products: aromatic and medicinal plants in IAA and ICPC (R2BINNOVA) code: PPR-B-R2BINOV-Mahrouz-FS-UCA-Marrakech and by the Mécanisme Compétitif Recherche Développement Vulgarization (MCRDV-Cerisier-2016) under the Ministry of Agriculture, Fisheries, Rural Development, Water and Forests.
References
- Acero, N., A. Gradillas, M. Beltran, A. García, and D. Muñoz Mingarro. 2019. Comparison of phenolic compounds profile and antioxidant properties of different sweet cherry (Prunus avium L.). Varieties. Food Chem. 279:260–271. doi: 10.1016/j.foodchem.2018.12.008.
- Aglar, E., B. Ozturk, S.K. Guler, O. Karakaya, S. Uzun, and O. Saracoglu. 2017. Effect of modified atmosphere packaging and ‘Parka’ treatments on fruit quality characteristics of sweet cherry fruits (Prunus avium L. ‘0900 Ziraat’) during cold storage and shelf life. Sci. Hortic. (Amsterdam). 222:162–168. doi: 10.1016/j.scienta.2017.05.024.
- AOAC. 2007. Official methods of analysis. Association of Official Agricultural Chemists Washington, DC.
- Ataie-Jafari, A., S. Hosseini, F. Karimi, and M. Pajouhi. 2008. Effects of sour cherry juice on blood glucose and some cardiovascular risk factors improvements in diabetic women: A pilot study. Nutr. Food Sci. 38(4):355–360. doi: 10.1108/00346650810891414.
- Aydin, C. 2003. Physical properties of almond nut and kernel. J. Food Eng. 60(3):315–320. doi: 10.1016/S0260-8774(03)00053-0.
- Ballistreri, G., A. Continella, A. Gentile, M. Amenta, S. Fabroni, and P. Rapisarda. 2013. Fruit quality and bioactive compounds relevant to human health of sweet cherry (Prunus avium L.). Cultivars Grown in Italy. Food Chem. 140(4):630–638. doi: 10.1016/j.foodchem.2012.11.024.
- Baryeh, E.A. 2001. Physical properties of bambara groundnuts. J. Food Eng. 47(4):321–326. doi: 10.1016/S0260-8774(00)00136-9.
- Benzie, I.F.F., and J.J. Strain. 1996. The ferric reducing ability of plasma (FRAP) as measure of “antioxidant power”: The FRAP assay. Anal. Chem. 239:70–76.
- Bobe, G., B. Wang, N.P. Seeram, M.G. Nair, and L.D. Bourquin. 2006. Dietary Anthocyanin-Rich Tart Cherry Extract Inhibits Intestinal Tumorigenesis in APC Min Mice Fed Suboptimal Levels of Sulindac. J. Agric. Food Chem. 54(25):9322–9328. doi: 10.1021/jf0612169.
- Bolin, H.R., and A.E. Stafford. 1974. Effect of processing and storage on provitamin A and vitamin C in apricots. J. Food Sci. 39(5):1034–1036. doi: 10.1111/j.1365-2621.1974.tb07305.x.
- Brand-Williams, W., M.E. Cuvelier, and C. Berset. 1995. Use of a free radical method to evaluate antioxidant activity. LWT - Food Sci. Technol. 28(1):25–30. doi: 10.1016/S0023-6438(95)80008-5.
- Calín-Sánchez, Á., J.J. Martínez, L. Vázquez-Araújo, F. Burló, P. Melgarejo, and Á.A. Carbonell-Barrachina. 2011. Volatile composition and sensory quality of Spanish pomegranates (Punica granatum L.). J. Sci. Food Agric. 91(3):586–592. doi: 10.1002/jsfa.4230.
- Cano-Lamadrid, M., L. Lipan, F. Hernández, J.J. Martínez, P. Legua, Á.A. Carbonell-Barrachina, and P. Melgarejo. 2018. Quality parameters, volatile composition, and sensory profiles of highly endangered Spanish citrus fruits. J. Food Qual. 2018:1–13. doi: 10.1155/2018/3475461.
- Chaovanalikit, A., and R.E. Wrolstad. 2004. Total anthocyanins and total phenolics of fresh and processed cherries and their antioxidant properties. J. Food Sci. 69(1):FCT67–FCT72. doi: 10.1111/j.1365-2621.2004.tb17858.x.
- Cinquanta, L., M. Di Matteo, and M. Esti. 2002. Physical pre-treatment of plums (Prunus domestica). Part 2. Effect on the Quality Characteristics of Different Prune Cultivars. Food Chem. 79:233–238. doi: 10.1016/S0308-8146(02)00138-3.
- Damar, İ., and A. Ekşi. 2012. Antioxidant capacity and anthocyanin profile of sour cherry (Prunus cerasus L.) juice. Food Chemistry 135(4):2910–2914. doi: 10.1016/j.foodchem.2012.07.032.
- De Souza, V.R., P.A.P. Pereira, T.L.T. Da Silva, L.C. De Oliveira Lima, R. Pio, and F. Queiroz. 2014. Determination of the bioactive compounds, antioxidant activity and chemical composition of Brazilian blackberry, red raspberry, strawberry, blueberry and sweet cherry fruits. Food Chem. 156:362–368. doi: 10.1016/j.foodchem.2014.01.125.
- Demir, F., and İ.H. Kalyoncu. 2003. Some nutritional, pomological and physical properties of cornelian cherry (Cornus mas L.). J. Food Eng. 60(3):335–341. doi: 10.1016/S0260-8774(03)00056-6.
- Díaz-Mula, H.M., S. Castillo, D. Martínez-Romero, D. Valero, P.J. Zapata, F. Guillén, and M. Serrano. 2009. Sensory, nutritive and functional properties of sweet cherry as affected by cultivar and ripening stage. Food Sci. Technol. Int. 15(6):535–543. doi: 10.1177/1082013209351868.
- Faniadis, D., P.D. Drogoudi, and M. Vasilakakis. 2010. Effects of cultivar, orchard elevation, and storage on fruit quality characters of sweet cherry (Prunus avium L.). Sci. Hortic. (Amsterdam). 125(3):301–304. doi: 10.1016/j.scienta.2010.04.013.
- Ferretti, G., T. Bacchetti, A. Belleggia, and D. Neri. 2010. Cherry antioxidants: From farm to table. Molecules 15(10):6993–7005. doi: 10.3390/molecules15106993.
- Gao, L., and G. Mazza. 1995. Characterization, quantitation, and distribution of anthocyanins and colorless phenolics in sweet cherries. J. Agric. Food Chem. 43(2):343–346. doi: 10.1021/jf00050a015.
- Girard, B., and T.G. Kopp. 1998. Physicochemical characteristics of selected sweet cherry cultivars. J. Agric. Food Chem. 46(2):471–476. doi: 10.1021/jf970646j.
- Gonçalves, B., A.P. Silva, J. Moutinho-Pereira, E. Bacelar, E. Rosa, and A.S. Meyer. 2007b. Effect of ripeness and postharvest storage on the evolution of colour and anthocyanins in cherries (Prunus avium L.). Food Chemistry 103(3):976–984. doi: 10.1016/j.foodchem.2006.08.039.
- Goncalves, B., J. Moutinho-Pereira, A. Santos, A.P. Silva, E. Bacelar, C. Correia, and E. Rosa. 2006. Scion-rootstock interaction affects the physiology and fruit quality of sweet cherry. Tree Physiology 26(1):93–104. doi: 10.1093/treephys/26.1.93.
- Guler, S.K., O. Karakaya, M. Karakaya, B. Ozturk, E. Aglar, T. Yarılgac, and S. Gün. 2019. Combined treatments of modified atmosphere packaging with aminoethoxyvinylglycine maintained fruit quality in sweet cherry throughout cold storage and shelf life. Acta Scientiarum Polonorum Hortorum Cultus 18(5):13–26. doi: 10.24326/asphc.2019.5.2.
- Halvorsen, B.L., K. Holte, M.C.W. Myhrstad, I. Barikmo, E. Hvattum, S.F. Remberg, A.-B. Wold, K. Haffner, H. Baugerød, L.F. Andersen, et al. 2002. A Systematic Screening of Total Antioxidants in Dietary Plants. J. Nutr. 132(3):461–471. doi: 10.1093/jn/132.3.461.
- Hayaloglu, A.A., and N. Demir. 2015. Physicochemical Characteristics, Antioxidant Activity, Organic Acid and Sugar Contents of 12 Sweet Cherry (Prunus Avium L.). Cultivars Grown in Turkey. J. Food Sci. 80:C564–C570. doi: 10.1111/1750-3841.12781.
- Hjalmarsson, I., and R. Ortiz. 2000. In situ and ex situ assessment of morphological and fruit variation in Scandinavian sweet cherry. Sci. Hortic. (Amsterdam). 38(1–2):37–49. doi: 10.1108/00346650810891414.
- Hssaini, L., H. Hanine, R. Razouk, S. Ennahli, A. Mekaoui, I. Guirrou, and J. Charafi. 2020. Diversity Screening of Fig (Ficus Carica L.) Germplasm through Integration of Morpho-agronomic and Biochemical Traits. Int. J. Fruit Sci. 1–20. doi: 10.1080/15538362.2019.1700871.
- Hwang, S.J., W.B. Yoon, O.H. Lee, S.J. Cha, and J.D. Kim. 2014. Radical-scavenging-linked antioxidant activities of extracts from black chokeberry and blueberry cultivated in Korea. Food Chem. 146:71–77. doi: 10.1016/j.foodchem.2013.09.035.
- Iezzoni, A.F. 2008. Cherries, in: Temperate Fruit Crop Breeding: Germplasm to Genomics. Springer, Netherlands, Dordrecht. doi:10.1007/978-1-4020-6907-9-5
- Jacob, R.A., G.M. Spinozzi, V.A. Simon, D.S. Kelley, R.L. Prior, B. Hess-Pierce, and A.A. Kader. 2003. Consumption of cherries lowers plasma urate in healthy women. J. Nutr. 54(6):1826–1829. doi: 10.1021/jf0612169.
- Jakobek, L., M. Šeruga, S. Voća, Z. Šindrak, and N. Dobričević. 2009. Flavonol and phenolic acid composition of sweet cherries (cv. Lapins) produced on six different vegetative rootstocks. Scientia Horticulturae 123(1):23–28. doi: 10.1016/j.scienta.2009.07.012.
- Joaquín, M., M. Lozano, M. Josefa, M. Concepción, M. López-corrales, and D. González-gómez. 2011. LWT - Food Science and Technology Physicochemical and bioactive properties evolution during ripening of ‘Ambrunés’ sweet cherry cultivar. LWT - Food Sci. Technol. 44:199–205. doi: 10.1016/j.lwt.2010.05.036.
- Kang, S.Y., N.P. Seeram, M.G. Nair, and L.D. Bourquin. 2003. Tart cherry anthocyanins inhibit tumor development in ApcMin mice and reduce proliferation of human colon cancer cells. Cancer Lett 194(1):13–19. doi: 10.1016/S0304-3940(02)00583-9.
- Kelebek, H., and S. Selli. 2011. Evaluation of chemical constituents and antioxidant activity of sweet cherry (Prunus avium L.). Cultivars. Int. J. Food Sci. Technol. 46(12):2530–2537. doi: 10.1111/j.1365-2621.2011.02777.x.
- Legua, P., A. Domenech, J.J. Martínez, L. Sánchez-Rodríguez., F. Hernández, A.A. Carbonell-Barrachina, and P. Melgarejo. 2017. Bioactive and volatile compounds in sweet cherry cultivars. J. Food Nutr. Res. 5(11):844–851. doi: 10.12691/jfnr-5-11-8.
- Melgarejo, P., Á. Calín-Sánchez, Á.A. Carbonell-Barrachina, J.J. Martínez-Nicolás, P. Legua, R. Martínez, and F. Hernández. 2014. Antioxidant activity, volatile composition and sensory profile of four new very-early apricots (Prunus armeniaca L.). J. Sci. Food Agric. 94(1):85–94. doi: 10.1002/jsfa.6201.
- Naderiboldaji, M., A. Tabatabaeefar, M.G. Varnamkhasti, and Z. Zamani. 2008. Some physical properties of sweet cherry (Prunus avium L. Fruit. Am. J. Agric. Environ. Sci. 3:513–520.
- Oszmiański, J., and A. Wojdyło. 2009. Comparative study of phenolic content and antioxidant activity of strawberry puree, clear, and cloudy juices. Eur. Food Res. Technol. 228(4):623–631. doi: 10.1007/s00217-008-0971-2.
- Özarslan, C. 2002. PH—Postharvest Technology. Biosyst. Eng. 83(2):169–174. doi: 10.1006/bioe.2002.0105.
- Ozgen, M., C. Durgaç, S. Serçe, and C. Kaya. 2008. Chemical and antioxidant properties of pomegranate cultivars grown in the Mediterranean region of Turkey. Food Chem 111(3):703–706. doi: 10.1016/j.foodchem.2008.04.043.
- Öztürk, B., E. Ağlar, O. Karakaya, O. Saracoğlu, and S. Gün. 2019. Effects of preharvest GA3, CaCl2 and modified atmosphere packaging treatments on specific phenolic compounds of sweet cherry. Turkish J. Food Agric. Sci 2687–3818. doi: 10.14744/turkjfas.2019.009.
- Papp, N., B. Szilvássy, L. Abrankó, T. Szabó, P. Pfeiffer, Z. Szabó, J. Nyéki, S. Ercisli, É. Stefanovits-Bányai, and A. Hegedüs. 2010. Main quality attributes and antioxidants in Hungarian sour cherries: Identification of genotypes with enhanced functional properties. Int. J. Food Sci. Technol. 45(2):395–402. doi: 10.1111/j.1365-2621.2009.02168.x.
- Pellegrini, N., Proteggente, A., Pannala, A., Yang, M., Rice, E. C., Re, R. 1999. Antioxidant activity applying an improved ABTS radical. Free Radical Biology & Medicine. 1999. 1231-1237
- Pérez-Sánchez, R., M.A. Gómez-Sánchez, and R. Morales-Corts. 2008. Agromorphological characterization of traditional Spanish sweet cherry (Prunus avium L.), sour cherry (Prunus cerasus L.) and duke cherry (Prunus ×gondouinii Rehd.) cultivars. Spanish J. Agric. Res 6(1):42–55. doi: 10.5424/sjar/2008061-293.
- Porter, L.J., L.N. Hrstich, and B.G. Chan. 1985. The conversion of procyanidins and prodelphinidins to cyanidin and delphinidin. Phytochemistry 25(1):223–230. doi: 10.1016/S0031-9422(00)94533-3.
- Saafi, E.B., A. El Arem, M. Issaoui, M. Hammami, and L. Achour. 2009. Phenolic content and antioxidant activity of four date palm (Phoenix dactylifera L.) fruit varieties grown in Tunisia fruit varieties grown in Tunisia. Int. J. Food Sci. Technol 44(11):2314–2319. doi: 10.1111/j.1365-2621.2009.02075.x.
- Saracoglu, O., B. Ozturk, K. Yildiz, and E. Kucuker. 2017. Pre-harvest methyl jasmonate treatments delayed ripening and improved quality of sweet cherry fruits. Sci. Hortic. (Amsterdam). 226:19–23. doi: 10.1016/j.scienta.2017.08.024.
- Serrano, M., H.M. D́iaz-Mula, P.J. Zapata, S. Castillo, F. Guillén, D. Martínez-Romero, J.M. Valverde, and D. Valero. 2009. Maturity stage at harvest determines the fruit quality and antioxidant potential after storage of sweet cherry cultivars. J. Agric. Food Chem. 57(8):3240–3246. doi: 10.1021/jf803949k.
- Siddiq, M., A. Iezzoni, A. Khan, P. Breen, A.M. Sebolt, K.D. Dolan, and R. Ravi. 2011. Characterization of New Tart Cherry (Prunus cerasus L.): Selections Based on Fruit Quality, Total Anthocyanins, and Antioxidant Capacity. Int. J. Food Prop. 14(2):471–480. doi: 10.1080/10942910903277697.
- Singleton, V.L., and J.A. Rossi. 1965. Colorimetry of total phenolics with P-molybdic tungstic acid reagents. Am J Enol Vitic 16:144–158.
- Sun, S.Y., W.G. Jiang, and Y.P. Zhao. 2010. Characterization of the aroma-active compounds in five sweet cherry cultivars grown in Yantai (China). Flavour Fragr. J. 25(4):206–213. doi: 10.1002/ffj.1994.
- Thaipong, K., U. Boonprakob, K. Crosby, L. Cisneros-Zevallos, and D. Hawkins Byrne. 2006. Comparison of ABTS, DPPH, FRAP, and ORAC assays for estimating antioxidant activity from guava fruit extracts. J. Food Compos. Anal. 19(6–7):669–675. doi: 10.1016/j.jfca.2006.01.003.
- Usenik, V., F. Stampar, M.M. Petkovsek, and D. Kastelec. 2015. The effect of fruit size and fruit colour on chemical composition in “Kordia” sweet cherry (Prunus avium L.). J. Food Compos. Anal. 38:121–130. doi: 10.1016/j.jfca.2014.10.007.
- Usenik, V., J. Fabčič, and F. Štampar. 2008. Sugars, organic acids, phenolic composition and antioxidant activity of sweet cherry (Prunus avium L.). Food Chemistry 107(1):185–192. doi: 10.1016/j.foodchem.2007.08.004.
- Vangdal, E., and R. Slimestad. 2006. Methods to determine antioxidative capacity in fruit. J. Fruit Ornam. Plant Res. 14:123–131.
- Vursavuş, K., H. Kelebek, and S. Selli. 2006. A study on some chemical and physico-mechanic properties of three sweet cherry varieties (Prunus avium L.). In Turkey. J. Food Eng. 74(4):568–575. doi: 10.1016/j.jfoodeng.2005.03.059.
- Yoo, K.M., M. Al-Farsi, H. Lee, H. Yoon, and C.Y. Lee. 2010. Antiproliferative effects of cherry juice and wine in Chinese hamster lung fibroblast cells and their phenolic constituents and antioxidant activities. Food Chem. 123:734–740. doi: 10.1016/j.foodchem.2010.05.043.
- Zhang, X., Y. Jiang, F. Peng, N. He, Y. Li, and D. Zhao. 2007. Changes of aroma components in Hongdeng sweet cherry during fruit development. Agric. Sci. China 6(11):1376–1382. doi: 10.1016/S1671-2927(07)60186-2.
- Zhou, Z., M.G. Nair, and K.J. Claycombe. 2012. Synergistic inhibition of interleukin-6 production in adipose stem cells by tart cherry anthocyanins and atorvastatin. Phytomedicine 19(10):878–881. doi: 10.1016/j.phymed.2012.05.001.