
 ?Mathematical formulae have been encoded as MathML and are displayed in this HTML version using MathJax in order to improve their display. Uncheck the box to turn MathJax off. This feature requires Javascript. Click on a formula to zoom.
ABSTRACT
Chinese Torreya (Torreya grandis cv Merrillii) is a vital tree crop species in China’s subtropical region. The industrial plantations of this tree have been broadly established across the region. A study on the fruit size and frequency distribution is necessary to the plantation management and the design of machine processing. We measured Chinese Torreya trees and the fruit size at two sites in Zhuji County of Zhejiang Province, the central production area of Chinese Torreya. Our results indicate that the average fruit volume is about 10 cm3, with an average length of 3.0 cm and an average width of 2.0 cm. There is no significant difference in the average fruit size (volume, length, width) among different trees. The pattern of frequency distribution in fruit volume follows a unimodal distribution with the highest frequency around the average volume of 10 cm3. The pattern of the accumulated frequency distribution is in the “S” shape. Taylor’s power laws exist in the fruit volume in most trees with different scaling exponents, which are significantly correlated with the minimum fruit volume on each tree. Multiple domains are found in Taylor’s laws for the fruit lengths and widths. Our study provides necessary background information on fruit size and its frequency distribution for Chinese Torreya. The results may also stimulate further research on the complexity between environmental factors and fruit size and distribution.
Introduction
Chinese Torreya (Torreya grandis cv Merrillii), an important tree crop cultivar, is an endemic evergreen coniferous tree in China’s subtropical region (Chen and Jin, Citation2019a; Li and Dai, Citation2007), including such as Zhejiang, Anhui, Jianxi Provinces and others. The species belongs to the genus Torreya (Taxaceae). This tree was considered to originate a thousand years ago from the grafting of scions of Torreya grandis Fort. ex Lind. with edible nuts on other Torreya trees with inedible nuts. After that, it was propagated by way of grafting and seed planting (Li and Dai, Citation2007). Chinese Torreya is an economic tree for its nuts, which have been used as food for thousands of years in China (Chen and Chen, Citation2019; Cheng et al., Citation2007). It also has certain significant medicinal value (Huang et al., Citation2001; Meng et al., Citation2020). Furthermore, its timber is ranked as high quality for furniture and ornaments. Zhuji County and the surrounding areas in Zhejiang Province of China is the original production area (Chen and Jin, Citation2019ab; Li and Dai, Citation2007). The seeds from one mature tree can provide an income of roughly 5,000 USD each year based on the local forestry agency (Chen and Jin, Citation2019a). Usually, a family in some rural areas of Zhuji County owns 4 or 5 trees (People’s Government of Shaoxing City, Citation2013). Approximately 50,000 local farmers got rich through planting this tree cultivar and producing nuts (People’s Government of Shaoxing City, Citation2013). Since Chinese Torreya is such a critical tree crop to the local economy, many industrial plantations of this tree have been broadly established in the subtropical area of China recently.
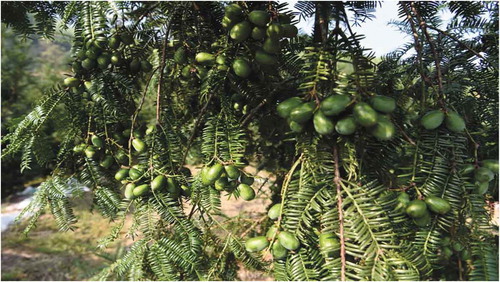
The tree produces “false fruits” with a fleshy aril (or episperm) enclosing a nut, composed of a thick coat and an edible embryo (). The fruit size is essential to seed size and industrial utilization, such as the episperm, which is used as a spice and other biomedical products (Chen and Jin, Citation2019b). Sorting is necessary for post-harvest handling processes with fresh fruits (Li and Thomas, Citation2016). Big and tasty fruit or seeds can get a high price on the market. Also, post-harvesting and processing are currently conducted manually. With the increase in both the local labor cost and fruit production of Chinese Torreya, machines that can automatically perform processing and produce high-quality nuts are under need (Chen and Jin, Citation2019a). Estimating fruit size in tree crops is essential for selective machine processing (Linker, Citation2017; Qureshi et al., Citation2017). All these are related to the algorithm of fruit size and variation. Besides, the optimum income per plantation will be determined by fruit load and fruit size distribution. Also, the choice of cultivar for industrial plantations relies on comparing the fruit size and distribution if their quality is similar. Previous literature indicated that the tree body size is related to the organ size (e.g., fruit or seed) (Moles et al., Citation2005; Rees and Venable, Citation2007; Sinnott, Citation1921). However, so far, there are limited reports on the fruit size and its variation in Chinese Torreya. This study aims to analyze the fruit size, frequency distribution and variation, and test the above result on the relationship between tree size and fruit size from other species. The result of this study can provide necessary information for Chinese Torreya and relevant parameters for possible industrial use.
Figure 1. Fruits of Chinese Torreya
Material and Methods
Study Sites
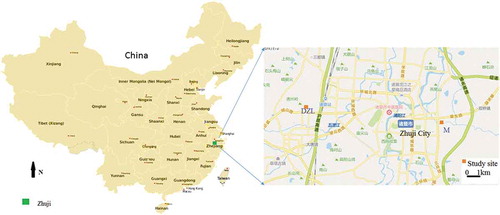
The study was conducted at Zhuji County of Zhejiang Province, where it is the original and major production area of Chinese Torreya (Chen and Jin, Citation2019a, Citation2019b). More than 80% of Chinese Torreya production is from this region. One site is at Dangzouling (short name as DZL), and another is at The Museum of Chinese Torreya (short name as M), near the urban boundary of Zhuji City (). The map distance between these two sites is about 20 km, and the local soil type is red soil. The tree ages varied from about 20 years to 80 years. The regional climate is subtropical monsoon with an annual air temperature of around 16°C and precipitation about 1400 mm (Chen, Citation2020; Chen and Niu, Citation2020).
Figure 2. The study sites (DZL and M) in Zhuji County in Zhejiang Province of China
Methods
Ten Chinese Torreya trees at each site were randomly selected. The tree height (H) was measured by a hypsometer, and the diameter at bottom (DAB) and canopy diameter (CD) were measured by a tape.
Seed Volume
The length (L) and width (W) of one hundred fruits on each tree were measured by a caliper. The fruit is considered as a cylinder. Its volume (V) is estimated by the following formula:
The coefficient of variation (CV) is equal to the standard deviation/average.
Frequency Distribution
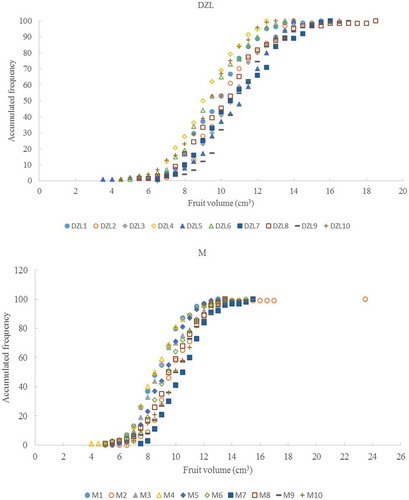
Both separated and accumulated frequency distribution were used in this study. For the separated frequency distribution, the fruit volume was classified into the following groups with an increment of 0.5 cm3: 4.5–5.0, 5.0–5.5, …, and 12.5–13.0 cm3. The fruit quantity in the different groups was counted, and the frequency was estimated. For the accumulated frequency distribution, the accumulated frequency at different volumes was calculated, such as ≤ 5.0, ≤ 5.5, …, and ≤ 13.0 cm3.
Taylor’s Law
Taylor’s law is an empirical law in ecology that links the variance to its mean by a power-law relationship (Taylor, Citation1961). In this study, Taylor’s power law can be expressed in the following equation:
Where variance here stands for the variance of fruit volume (or length or width of fruits) in Chinese Torreya, Mean is the average of fruit volume (or length or width). After logarithm, log (Variance) = log (a)+ r·log (Mean). r is called scaling exponent. After sorting the fruit volumes (or lengths or widths) from the smallest to the largest for each tree, the linear relationship between the log(average) and log(variance) of fruit volume (or the length or width of fruits) was estimated for each tree by correlation with the increase of fruit quantity from 2, 3 to 100. Any deviations may indicate disturbance or regime shift (Chen et al., Citation2017). The same method was also used to study fruit length and width.
Statistics
Pearson correlation was used to determine any correlations in tree size (H, DAB, and CD) and fruit size (V, L, and W). ANOVA test (SAS software, Cary, NC) was used to check the difference between fruit size (V, L, and W) among tree individuals. A Chi-Square test was used to compare the difference in the distribution of fruit size. The statistical analysis was considered significant at p < .05.
Results
The average volume of a Chinese Torreya fruit is about 10.1 ± 1.9 cm3 at DZL and 9.5 ± 1.8 cm3 at M (). The average CV of fruit volume in each tree at both sites is 18.9%. There is no significant difference in the average fruit volume among the individual trees at each site and also between these two sites (p > .05).
Figure 3. The average volume of a Chinese Torreya fruit with standard deviation in ten trees at both study sites
The average length of fruit is 3.1 ± 0.3 cm at DZL and 3.0 ± 0.2 cm at M (). The average CV of fruit lengths in each tree is 8.2% at DZL and 7.2% at M. The average width of fruits is 2.0 ± 0.1 cm at both DZL and M (). The average CV of fruit width in each tree is 7.5% at DZL and 6.7% at M. There is no significant difference in the average fruit length and width among individual trees at each site and between sites (p > .05). The average ratio of fruit length: width is 1.5 ± 0.1 among fruits in each tree at both sites ().
Figure 4. The average length of a Chinese Torreya fruit with standard deviation in ten trees at both study sites
Figure 5. The average width of a Chinese Torreya fruit with standard deviation in ten trees at both study sites
Figure 6. The average ratio of fruit length: width for Chinese Torreya trees at both study sites
There is no significant correlation between the tree size (H, DAB, and CD) and its average fruit size (V, L, and W). No significant correlation exists between the tree size and its maximum or minimum fruit size (V, L, and W) at both locations.
The pattern of frequency distribution in fruit volume is similar among trees at both sites (), although there exists a significant difference among some trees based on the Chi-Square test. The emergent pattern of frequency distribution follows a unimodal distribution, and the highest frequency is around the average volume of 10 cm3. The accumulated frequency distribution is in the “S” shape at both sites (). There are fewer fruits in the smaller or bigger size.
Figure 7. The pattern of frequency distribution in fruit volume in trees at both study sites
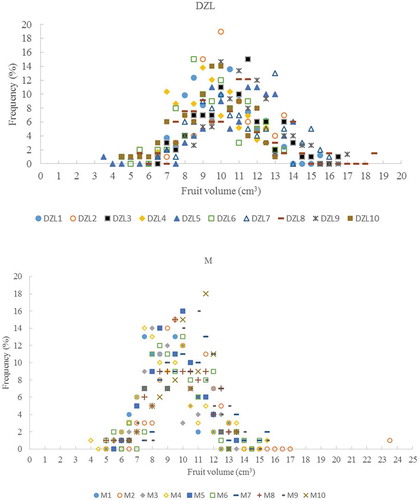
Figure 8. The pattern of accumulated frequency distribution in fruit volume in trees at both study sites
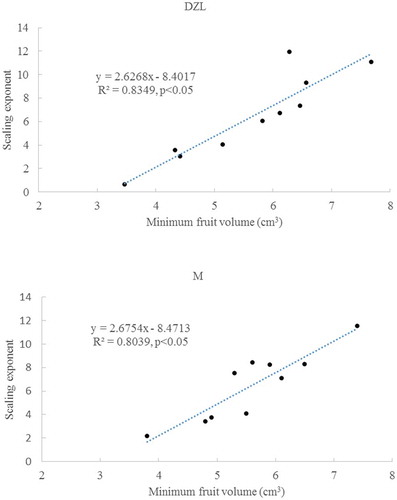
Taylor’s power laws exist in the fruit volume in most trees at DZL and M with different scaling exponents (), but not at the DZL5 and M4 (). There are multiple domains for the relationship between the average volume of fruits and the variance, but it is complicated for DZL5 and M4. The scaling exponents of Taylor’s power laws do not correlate with tree size (height, DAB, and canopy diameter). However, they are significantly correlated with the minimum fruit volume on each tree ().
Table 1. Taylor’s power law in the distribution of fruit volume for each tree at two sites
Figure 9. Taylor’s power laws in the fruit volume for DZL5 and M4
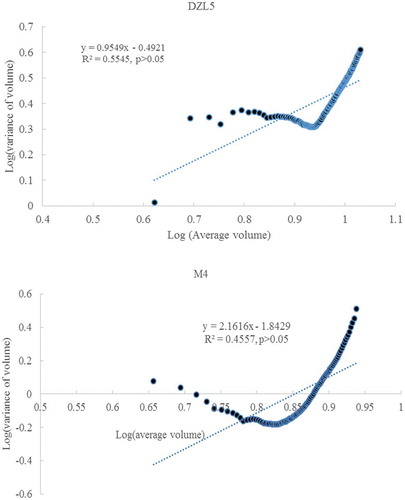
Figure 10. The scaling exponents of Taylor’s power laws are correlated with the minimum fruit volume on each tree at both study sites
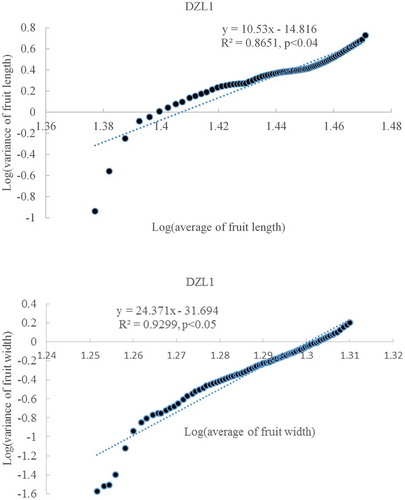
There are multiple domains in Taylor’s power laws for the fruit length and width in all trees at both sites, such as DZL1 ().
Figure 11. Multiple domains in Taylor’s power laws for the fruit length and width in DZL1
Discussion
The fruits of Chinese Torreya from trees at both sites have a consistent average volume of about 10 cm3, although each fruit’s volume may be varied. The average CV of fruit volume for individual trees at both sites is the same (18.9%). This result indicates that the fruit volumes are very consistent between Chinese Torreya trees of different sizes or ages, making the Chinese Torreya tree an excellent industrial tree crop. Furthermore, the average length of fruit is approximately 3.0 cm, and the average width is 2.0 cm at both sites. The average ratio of fruit length: width is 1.5 in each tree at both sites. There is no significant difference in the average fruit length and width among individual trees at each site and between sites. These results don’t support the conclusion from other studies that tree body size is related to the fruit size (Moles et al., Citation2005; Rees and Venable, Citation2007; Sinnott, Citation1921). Our result may indicate that there exists an optimum fruit size for Chinese Torreya, such as Ornstein–Uhlenbeck process (Leslie et al., Citation2017). The result may provide background information that can be used to compare fruit sizes for different Chinese Torreya varieties.
The pattern of frequency distribution in fruit volume on each tree is consistent among trees at both sites. The separated frequency is in a unimodal distribution, and the high frequency is concentrated at the average volume of 10 cm3. The accumulated frequency distribution of fruit volume in each tree follows “S” shape at both sites. A similar pattern in the frequency distribution of fruit volume may be determined by the genetics of the species because the propagation of this cultivar is mainly through grafting (Chen and Jin, Citation2019a; Li and Dai, Citation2007). The difference in the frequency distribution may be caused by nutrient level in trees and the micro-environmental condition, such as sunlight. Light can affects fruit growth through photosynthesis. Due to the canopy structure, light transmission at the lower part of the canopy can be significantly decreased. The largest fruit on “Granny Smith” trees were reported to locate at the upper regions and the smallest at the inner lower part (Warrington et al., Citation1996). Broom et al. (Citation1998) indicated that position in the canopy and shoot type are factors affecting fruit size in the “Braeburn” apple. We did not record the location of fruits and light conditions in this study. However, due to the long branches of Chinese Torreya trees, local farmers usually use ropes to grasp small tree branches together or fasten them with a major stem. It is not known whether this practice would affect fruit size distribution. It seems that spreading these branches to get light may improve fruit size, just like a grape yard. Further research is needed for this.
The fruit volumes in each tree follow Taylor’s power laws with different scaling exponents except for DZL5 and M4. There exist multiple domains in the relationship between the average volume of fruits and the variance for all trees. It is a self-organized process that a tree produces fruits and keeps them grow. The multiple domains in the relationship between the average fruit volume and variance may indicate different driving forces or regime shifting in fruit growth, such as sunlight and soil water. Arruda-Neto et al. (Citation2012) consider that scaling exponents may reflect the difference in living conditions, including all interactions among all elements of a living system. Parasitism or epidemic infection may also alter the scaling exponents (Lagrue et al., Citation2015). The trees of DZL5 and M4 might be related to stress. Fruits grow in length at first and then expand in width (Li and Dai, Citation2007). If there are too much precipitation and limited sunlight during July and August, then width growth may stop or decrease. Since each tree grows under different environmental conditions (e.g., light, water, and disturbance), it is possible to have multiple domains in the relationship between the average fruit volume and variance and varied scaling exponents. Gillaspy et al. (Citation1993) proposed three distinct phases in fruit development, which included (i) the development of the ovary and determining whether fruits are aborted, or development continue; (ii) fruit growth primarily by cell division; and (iii) fruit growth mainly by cell expansion. In this study, the overall regime of fruit growth is determined by the smallest fruits, which may be limited by nutrients, water, and other factors. That’s why there is a significant correlation between the scaling exponents and minimum fruit volume. Higashi et al. (Citation1999) indicated that pericarp cells of Cucumis melo L. reticulatus were in several developmental stages. The final fruit size is determined by the amount of cell proliferation in the early developmental stage. The factor regulating the amount of cell proliferation is affected by air temperature.
Conclusions
Chinese Torreya is an important tree crop cultivar in the subtropical region of China. A large number of industrial plantations are being established to increase fruit or seed production. However, there is limited understanding of its fruit size and frequency distribution, required for machine processing. Our study provides the necessary information on its fruit volume, including length and width, and indicates that fruit volume is independent of tree size. The frequency distribution of fruit volume in different trees follows in a unimodal pattern or an “S” shape for accumulated frequency. The development of fruit size may be affected by several processes, shown by the domain shifting in Taylor’s power laws. This research may stimulate further study on the complicated relationship between environmental factors and fruit size and distribution.
Acknowledgments
The authors are thankful to Ms. Mengtian Shao and Mr. Jiansen Shen for their help in field measurement, and Mr. Zhongqi Wu for accessing permission. This research was partially supported by the USDA Mc-Stennis project (1008643).
Disclosure Statement
No potential conflict of interest was reported by the authors.
Additional information
Funding
References
- Arruda-Neto, J.D.T., M.C. Bittencourt-Oliveira, A.C. Castro, T.E. Rodrigues, J. Harari, J. Mesa, and G.C. Genofre. 2012. Global warming and the power-laws of ecology. Atmos. Climate Sci. 2:8–13. doi: 10.4236/acs.2012.21002.
- Broom, F.D., G.S. Smith, D.B. Miles, and T.G.A. Green. 1998. Within and between tree variability in fruit characteristics associated with bitter pit incidence of `Braeburn’ apple. J. Hort. Sci. Biotech. 73(4):555–561. doi: 10.1080/14620316.1998.11511014.
- Chen, X. 2020. Historical radial growth of Chinese Torreya trees and adaptation to climate change. Atmosphere 11(7):691. doi: 10.3390/atmos11070691.
- Chen, X., and H. Chen. 2019. Dynamics in production of four heritage foods at the mountainous region of Shaoxing City, China. Emir. J. Food Agri. 31:645–653. doi: 10.9755/ejfa.2019.v31.i8.1997.
- Chen, X., Q. Guo, and D.G. Brockway. 2017. Power laws in cone production of longleaf pine across its native range in the United States. Sust. Agri. Res. 4:64–73. doi: 10.5539/sar.v6n4p64.
- Chen, X., and H. Jin. 2019a. Review of cultivation and development of Chinese Torreya in China. Forest Trees Liveli 28(1):68–78. doi: 10.1080/14728028.2018.1553690.
- Chen, X., and H. Jin. 2019b. A case study of enhancing sustainable intensification of Chinese Torreya forest in Zhuji of China. Envir. Nat. Res. Res. 9:53–60. doi: 10.5539/enrr.v9n2p53.
- Chen, X., and J. Niu. 2020. Evaluating the adaptation of Chinese Torreya plantations to climate change. Atmosphere 11(2):176. doi: 10.3390/atmos11020176.
- Cheng, X., Z. Li, W. Yu, W. Dai, and Q. Fu. 2007. Distribution and ecological characteristics of Torreya grandis in China. J. Zhejiang For. College 24:383–388. in Chinese with English abstract.
- Gillaspy, G., H. Ben-David, and W. Gruissm. 1993. Fruits: A developmental perspective. Plant Cell 5(10):1439–1451. doi: 10.1105/tpc.5.10.1439.
- Higashi, K., K. Hosoya, and H. Ezura. 1999. Histological analysis of fruit development between two melon (Cucumis melo L. reticulatus) genotypes setting a different size of fruit. J. Exp. Bot 50(339):1593–1597. doi: 10.1093/jxb/50.339.1593.
- Huang, Y., J. Wang, G. Li, Z. Zheng, and W. Su. 2001. Antitumor and antifungal activities in endophytic fungi isolated from pharmaceutical plants Taxus mairei, Cephalataxus fortunei and Torreya grandis. FEMS Immunol. Med. Microbiol. 31(2):163–167. doi: 10.1111/j.1574-695X.2001.tb00513.x.
- Lagrue, C., R. Poulin, and J.E. Cohen. 2015. Parasitism alters three power laws of scaling in a metazoan community: Taylor’s law, density-mass allometry, and variance-mass allometry. Proc. Natl. Acad. Sci. USA 112(6):1791–1796. doi: 10.1073/pnas.1422475112.
- Leslie, A.B., J.M. Beaulieu, and S. Mathews. 2017. Variation in seed size is structured by dispersal syndrome and cone morphology in conifers and other nonflowering seed plants. New Phytol. 216(2):429–437. doi: 10.1111/nph.14456.
- Li, Z., and C. Thomas. 2016. Multiscale biomechanics of tomato fruits: A review. Crit. Rev. Food Sci. Nutr. 56(7):1222–1230. doi: 10.1080/10408398.2012.759902.
- Li, Z.J., and W.S. Dai. 2007. Chinese Torreya. (in Chinese). Science Press, Beijing, China.
- Linker, R. 2017. A procedure for estimating the number of green mature apples in night-time orchard images using light distribution and its application to yield estimation. Precis. Agric. 18(1):59–75. doi: 10.1007/s11119-016-9467-4.
- Meng, X., D. Xiao, Q. Ye, X. Nie, J. Wu, and L. Song. 2020. Positional distribution of Δ5-olefinic acids in triacylglycerols from Torreya grandis seed oil: Isolation and purification of sciadonic acid. Ind. Crops Prod. 143:111917. doi: 10.1016/j.indcrop.2019.111917.
- Moles, A.T., D.D. Ackerly, C.O. Webb, J.C. Tweddle, J.B. Dickie, A.J. Pitman, and M. Westoby. 2005. Factors that shape seed mass evolution. Proc. Natl. Acad. Sci. USA 102(30):10540–10544. doi: 10.1073/pnas.0501473102.
- People’s Government of Shaoxing City. 2013. Kuanjishan ancient chinese torreya community. Proposal for global important agricultural heritage system initiative. People’s Government of Shaoxing City: Shaoxing, China.
- Qureshi, W.S., A. Payne, K.B. Walsh, R. Linker, O. Cohen, and M.N. Dailey. 2017. Machine vision for counting fruit on mango tree canopies. Precis. Agric. 8(2):224–244. doi: 10.1007/s1119=016-9458-5.
- Rees, M., and D.L. Venable. 2007. Why do big plants make big seeds? J. Ecol 95(5):926–936. doi: 10.1111/j.1365-2745.2007.01277.x.
- Sinnott, E.W. 1921. The relation between body size and organ size in plants. Am. Nat. LV(640):385–403. doi: 10.1086/279823.
- Taylor, L.R. 1961. Aggregation, variance and the mean. Nature 189(4766):732–735. doi: 10.1038/189732a0.
- Warrington, I.J., C.J. Stanley, D.S. Tustin, P.M. Hirst, and W.M. Cashmore. 1996. Light transmission, yield distribution, and fruit quality in six tree canopy forms of `Granny Smith’ apple. J. Tree Fruit Prod. 1(1):27–54. doi: 10.1300/J072v01n01_03.