
ABSTRACT
The aim of this study was to confirm the hypothesis that pretest temperature changes could alter the cold hardiness of the grapevine dormant buds and eventually the result of differential thermal analysis (DTA) test. For this reason, dormant buds of ‘Karaerik’ grape cultivar were collected at different times and tested using different DTA procedures. Dormant buds taken at nine different sampling temperatures (8, 6, 5, 3, −1, −3, −4, −5, and −9°C) were exposed to freezing test according to three DTA test approaches (TestA-A, TestA-4 and Test20-4, to represent ambient storage and ambient test, ambient storage and 4°C test, and 20 ± 2°C storage and 4°C test or standard DTA method, respectively) to verify our hypothesis in 2015–16 and 2016–17. The LTE (low temperature exotherm) temperatures were determined as the indicator of death of primary buds at grapevines’ dormant buds, tested according to TestA-A approach, TestA-4 approach and Test20-4 approach (the standard methodology). It was found that temperature changes such as rapid cooling, warming and thawing in the TestA-4 approach, and warming-cooling and melting-cooling in the Test20-4 approach altered LTE values of dormant buds depending on the test start temperature. It was determined that the LTE values of dormant buds tested according to TestA-4 and Test20-4 approaches were higher than that of the ones tested with TestA-A approach. Compared to TestA-A approach, the LTE values of dormant buds were between 0.00 and 4.00°C in the TestA-4 approach and 0.00 and 2.77°C in the Test20-4 approach based on temperature changes. As a result, to achieve reliable, and consistent LTE results at DTA tests, it was determined that dormant buds should be brought into laboratory by keeping the temperatures at the sampling time, prepared for test at these temperatures and to start DTA test from these temperatures is a right approach.
Introduction
Low temperatures below freezing point is one of the major environmental stresses, limiting the distribution of plants (Grant and Dami, Citation2015; Zhang et al., Citation2012). These temperatures can cause damage in tissues and organs of plants, reducing of both yield and quality of crops or completely cause the death of the plant (Zabadal et al., Citation2007). Understanding the mechanisms of the plant’s ability to survive under low are possible with the use of rapid, reliable, and appropriate measurement techniques (Fennell, Citation2004). There are several studies in order to create a reliable laboratory-based freeze tests that accurately predict the hardiness synergy of cold conditions for plants. Many measurement techniques (differential thermal analysis, magnetic resonance imaging, nuclear magnetic resonance, infrared video thermography, differential scanning calorimeter, low temperature electron microscope, electrical conductivity, tripheny tetrazolium chloride reduction, tissue browning) have been developed to understand the cold hardiness or frost tolerance mechanism of the plants exposed to low temperatures (Andrews et al., Citation1983; Fennell, Citation2004; Kaya and Köse, Citation2017; Mills et al., Citation2006; Quamme, Citation1972; Rende et al., Citation2018; Wample et al., Citation1990). Differential thermal analysis (DTA), one of these measurement techniques, is commonly used in determining cold hardiness of plant organs that avoid freezing by supercooling, such as flower buds of apricot (Kaya and Kose, Citation2019; Kaya et al., Citation2018), apple (Quamme, Citation1972; Salazar-Gutiérrez et al., Citation2016), cherry (Salazar-Gutierrez et al., Citation2014), peach (Durner and Gianfagna, Citation1991; Liu et al., Citation2019), pear (Montano et al., Citation1987), azalea (Graham and Mullin, Citation1976), and buds of grapevine (Andrews et al., Citation1984; Ferguson et al., Citation2014; Londo and Kovaleski, Citation2017; Londo et al., Citation2018; Mills et al., Citation2006; Quamme, Citation1986). Different chamber designs for differential thermal analysis have been described (Andrews et al., Citation1983, Citation1984; Barney et al., Citation1994; Wolf and Pool, Citation1986). However, DTA was originally developed by Wample et al. (Citation1990), and Mills et al. (Citation2006) developed the process to automate it. Thus, this method has now become a standard method to determine the tolerance of plants to low temperatures (Kaya and Kose, Citation2019; Kaya et al., Citation2018). DTA, which enables to obtain measurement and data for determining the cold hardiness of plants, has become a standard method widely used in recent years for deciduous trees and species with supercooling. Some researchers have expressed that when samples were collected, they must place in a polyethylene bag that had been previously cooled to the local air temperature, since it is very important that the samples remain as close as possible to the air temperature (Proebsting and Mills, Citation1971; Salazar-Gutierrez et al., Citation2014). Although there was a concern about that preprocessing may have an influence on DTA results for plants, there has not been published anything on this matter. Additionally, in DTA analysis, test starting temperature, regardless of tissue temperatures at a sampling time, was determined as 4°C. This would lead partial temperature decreases in samples been at higher temperatures than 4°C or partial warming in samples been at lower temperatures than 4°C. In general, when considering the pretest conditions of buds could be effective on the cold hardiness and/or frost tolerance; it seems that a standard method has not been developed by taking the consideration of sampling time temperature, storage temperature, sampling temperature at the time of preparation of samples, and tissue temperatures at pretest.
There are several reports about the stimulation of rapid cooling (fast and sudden decrease of temperature) caused important physiological changes at the tissue and the cellular level, such as; stologic content of Ca+2, cold-dependent gene expression, an increase in free fatty acids, an increase unsaturatedness of fatty acids in membrane, cell turgor loss, membrane content, membrane potential, and phosphorylation of membrane proteins (Ashworth and Wisniewski, Citation1991; Knight et al., Citation1996; Minorsky, Citation1989; Salazar-Gutierrez et al., Citation2014). Additionally, previous investigations indicated that plants lost their frost tolerance and their viability at higher temperatures when frozen again after partially warming during the natural and artificial warming of tissues exposed to freezing temperature as well as rapid cooling (Minorsky, Citation1989; Nordin-Henriksson and Trewavas, Citation2003). Even though, according to some researchers, it is still a controversial situation that temperature of sample before DTA might have an effect on the frost test results (Salazar-Gutierrez et al., Citation2014), there have no findings on this matter so the effects on frost tolerance of rapid cooling and warming are not considered while applying the standard method. In order to this, performing DTA method without considering the partial cooling and warming causes with some concerns about not obtaining reliable results and to bring into standardization of method. Since the cold hardiness of buds can change in response to environmental conditions, the multiple machines were used at the same time in the current study, and DTA results were compared between experiments (in order to compare results according to TestA-A, TestA-4, and Test20-4). In this regard, the objectives of this study are: (i) to assess the effects of the relationship between preprocessing and test starting temperatures on DTA results for grapevine buds; (ii) to make a more realistic and reliable estimates by being prevented the possible effects on frost tolerance of partial cooling and warming; and (iii) to examine the effects of different sampling temperatures and the test starting temperature ignored in standard method on freezing test results.
Materials and Methods
Plant Material
Materials used for DTA were sourced from a 25-year-old planting of own rooted Vitis vinifera cv. Karaerick. The vineyard was planted on a south-facing slope in Erzincan, Turkey to 2.5 m × 2.5 m row x vine spacing. The vines were trained to the ‘Baran’ system, which is a prostrated system and spur-pruned. Cultural practices such as; pruning, fertilization, irrigation, and pest control were uniform across the vineyard. Canes were randomly collected from all the vines and the sample size were ranged from 75 to 80 canes for each sampling time. The samples were evaluated bi-weekly for two dormant season (2015–16 and 2016–17). During 2015–16 dormant season, cane samples were collected from 30 Nov 2015 to 10 Mar 2016. During 2016–17 dormant seasons, cane samples were collected from 19 Nov 2016 to 4 Mar 2017. Sampled canes were selected based on the following criteria: healthy (dark brown periderm cane sections), sun-exposed, medium size (6–8 mm internode diameter), with periderm developed on six or more internodes. In our study, 24 buds were used for each replicate and 72 buds were tested per sampling date (for each test method) in total 216 buds were tested for all three test methods per sampling time. First four buds on the basal positions (one to four) of canes were used for each analysis. The bud temperatures were recorded by the temperature probes, which placed the vine trunk height and measured the air temperature. The temperatures record for the two seasons was collected from the Fieldclimate (METOS-Erzincan) weather system (https://www.fieldclimate.com). The canes were collected from the vineyard an hour before the sunrise, during each sampling time. Then, canes were put into polyethylene bags to prevent drying and water loss (Kovács et al., Citation2002; Mills et al., Citation2006). Since the conditions for bringing the samples to the laboratory are not clearly described in the standard method (Test20-4) and the studies based on this method, the samples separated by three groups then brought into laboratory with two different ways. The first group of samples (Test20-4 approach or standard DTA method-the standard methodology), dormant buds were brought into laboratory under the vehicle conditions (20 ± 2°C) and were prepared to the test under laboratory conditions (20 ± 2°C). In Test20-4 approach, dormant buds were exposed to temperature changes caused by both transportation-preparation stages and the beginning of the test at 4°C. TestA-A approach and TestA-4 approach group samples were placed in a temperature controlled portable coolers (Model, TB51A Indel B) which adjust to atmospheric (ambient) temperature at the time of sampling, and samples that were preserved the temperatures at the time of sampling were brought into the laboratory (Supplementary Figure 1a). In other words, in the TestA-A approach, dormant buds brought into the laboratory by being preserved the temperatures at the time of sampling, and prepared for the test at these temperatures, were tested by starting from the temperature value at sampling time and in this way, they were not exposed to any temperature changes prior to test. In TestA-4 approach, after dormant buds kept at the temperatures at the time of sampling were brought into the laboratory and prepared the test, they were subjected to the temperature changes caused as the test was started at 4°C. Samples brought to the laboratory were prepared for analysis as soon as possible. TestA-A and TestA-4 group samples were prepared and placed in the TEM modules under the temperature controlled cabinet designed by our own, in which the temperature can be maintained at the sampling time temperature by the sensitive heater and cooler sensors (Supplementary Figure 1a). The TestA-4 approach was designed to determine the effects of changes in test initial temperatures over cold hardiness. The Test20-4 approach represents the standard method. In the TestA-A approach, the dormant buds were not exposed to any temperature change before the test. The dormant buds tested according to the TestA-4 approach and Test20-4 approach exposed to different temperature changes depending on the sampling temperature. In this context, samples were collected in 12 different sampling times (including acclimation-hardening-deacclimation phases) and in nine different outdoor sampling temperatures (−9, −3, 3, 5, 6, and 8 for first year; −5, −4, −3, −1, 5, and 5 for second year). These sampling temperatures were important because different test approaches were compared with each other. During sampling, test preparation and test start times, the outdoor temperatures were maintained or temperatures changed based on the test approaches. e.g. in TestA-A, sampling temperature was maintained and the lab test was started at that temperature, whereas, at Test20-4, samples were taken at each outdoor temperature, carried in ambient vehicle condition and tests started at 4°C. Additionally, TestA-4 samples were taken at each outdoor temperature and this was maintained during sample transportation and test preparation and then, test started at 4°C. Therefore, different outdoor temperatures were important here to compare the test approaches. Thus, depending on the different sampling temperatures examined, the dormant buds were subjected to heat changes during sample handling, such as samples taken at 8°C and carried to laboratory at this temperature and test stated at 4°C; therefore, this sample exposed a sudden temperature drop at the beginning of the test in TestA-4. Based on the test methods and sampling temperature, samples were either exposed to a sudden temperature decrease or increase sampling, transportation, preparation, and test start temperatures.
Preparation of DTA Test Samples and DTA Test
In our study, time spent between sampling and test starting taking around 3 hours during each sampling time. DTA test samples for each group were prepared from the first four dormant buds, which were considered fruitful for the Karaerik grape cultivar. An equal number of buds were taken from the first, second, third, and fourth nodes (Supplementary Figure 2a). Tissue underlying bud (1–2 mm of intact cane woody-tissue) was sampled as described in the Andrews et al. (Citation1984) (Supplementary Figure 2b). The TestA-A and TestA-4 group samples were prepared in the temperature-controlled cabinet by being preserved the temperatures during time of sampling and the Test20-4 approach was prepared at room temperature (20 ± 2°C). The prepared test specimens were placed on a tray consisting of nine thermo-electric modules (TEMs) and also four buds were placed in each TEM (Supplementary Figure 2c). Two trays were used for each test approach (TestA-A, TestA-4 and Test20-4) and sampling time in DTA tests, i.e. a total of 18 TEMs and 72 dormant buds were used for each sampling time (see 2-c in the supplementary material).
After placing DTA test samples in the TEMs, foam insulation pads were placed over the samples in order to increase the heat transfer, then then the lids of trays were closed. Immediately, samples were removed from the temperature-controlled cabinet and placed into the programmable test cabinet. The Test20-4 approach was prepared at room temperature (20 ± 2°C) (Supplementary Figure 2d) and samples for the TestA-4 approach were prepared in the temperature-controlled cabinet (sample temperature 8, 6, 5, 3, −1, −3, −4, −5, and −9°C) (Supplementary Figs. 1b and 3a, b), however, tests were started at 4°C for both the Test 20–4 and Test A-4. Therefore, the Test20-4 and the TestA-4 approaches were placed together in a programmable test cabinet. The samples of the TestA-4 approach were tested under the same conditions of Test20-4 samples, and the TestA-4 and Test20-4 samples were held at 4°C for 1 h prior to starting the temperature drop program, then similarly drop to −40°C in 11 h (a cooling rate of 4°C h−1) (Supplementary Figure 2e). Shortly, while we changed the preparation temperature of Test20-4 and TestA-4 of the samples, we did not alter the actual program temperature start and hold. There was approximately 1 hour of freezing and thawing for TestA-4 and Test20-4 approaches, since we had a 4°C 1 hr hold prior to the temperature ramping. In the TestA-A approach, on the other hand, dormant buds brought into the laboratory by being preserved the temperatures at the time of sampling, and prepared for the test at these temperatures (in the sample temperature 8, 6, 5, 3, −1, −3, −4, −5, and −9°C) in the temperature-controlled cabinet (Supplementary Figs. 1b and 3a, b). The sampling temperature of TestA-A approach was not changed, that is, it was stored at sampling temperature, prepared for testing at sampling temperature, and tested at sampling temperature. For example, Test-A samples were taken in −9°C from vineyard, stored at −9°C, prepared for testing at −9°C, then the temperature controlled cabin was set to −9°C. Then, the temperature of controlled cabin was dropped to −9°C by running the temperature drop program and samples immediately were placed in the temperature controlled cabin. Finally, the temperature controlled cabin temperature was dropped to −40°C in a cooling rate of 4°C h−1. While TestA-A approach was performed in different programmable test cabinet, TestA-4 and Test20-4 approaches were performed in the same programmable test cabinet at the same time (Supplementary Figure 2f). This process from preparation to into DTA machine was often less than 2 minutes for the buds of the TestA-A approach, so there was insufficient time for freezing or excess warming. In general, the preparation period for DTA test approaches (TestA-A, TestA-4, and Test20-4 approaches) of all samples lasted for 10 minutes. For each DTA test, TEM the electrical voltage output in mV was momentarily recorded on the computer and recorded mV peaks and associated temperatures, and then calculated the temperatures at which 25%, 50%, mean, or 75% of the dormant buds are killed, LTE25, LTE50, mLTE, and LTE75, respectively, can be determined (Kaya et al., Citation2020, Citation2018) (Supplementary Figure 2g).
Statistical Analysis and Comparison of Data
This work was conducted according to the full randomized research plan and a histogram was used to test whether LTE values were normally distributed. Firstly, using a Q-Q plot (quantile-quantile plot) determined whether the data set with LTE values are normally distributed. Additionally, detection of LTE values was checked by using Box-and-Whiskers plot analysis. These LTE values used were derived from the dormant buds across all replicates collectively. The 1% spread was calculated based on the number of dormant buds’ death between the 1th and 100th percentiles of the box and whisker plot. Within an experiment, 100% spread was also assessed separately for test approaches that were present for 2 years together, for each individual year and the mean of different sampling temperatures of LTE values. All LTE values are presented as the mean ± standard error (SE) of three replicates. The data were analyzed using two-way ANOVA followed by Duncan’s multiple range test. p < .01 was considered significant. All statistical analyzes were conducted using SAS (SAS Institute, Cary, NC, USA, Citation2002).
Results and Discussion
In the study, the HTE and LTE values, indicators for freezing of apoplastic and intracellular water, respectively, were clearly determined in the dormant buds, according to different sampling time (Supplementary Figure 2g). In order to determine whether there is a difference in mLTE values of the three test approaches according to all exotherm values obtained from samples taken from nine different sampling temperatures (8, 6, 5, 3, −1, −3, −4, −5, and −9°C), it was first evaluated together for 2 years. When two consecutive years were evaluated, there were differences (p ≤ 0.01) between LTE values of the 1994 buds analyzed by TestA-A (n = 665 LTE values), TestA-4 (n = 665 LTE values), and Test20-4 (n = 664 LTE values) approaches (). A box-and-whisker graph or box plot was used by comparing groups of LTE values that are belonging to three test approaches (). From , it was evident that while TestA-A approach had low LTE values (LTE25, 50, 75), TestA-4, and Test20-4 approaches provided high LTE values (LTE25, 50, 75). Cold hardiness of buds analyzed according to the TestA-A approach appeared to be significantly better than TestA-4 and Test20-4 approaches. When the mLTE values of buds analyzed by Test-A are compared with mLTE values of TestA-A and Test20-4 approaches, it is seen that they are not exposed to any temperature decrease or increase at all stages of the tests. In addition, since the sample temperatures in the buds tested with the Test-A approach are kept constant, the buds are not subjected to instantaneous temperature drops or rises during the preparation phase for the analyzes. Therefore, we think that the mLTE values of the buds analyzed by Test-A may have occurred at lower temperatures compared to the mLTE values of other test approaches. It has been reported by many researchers that significant physiological changes occur in plant tissues and their cellular levels with the stimulation of sudden temperature drops and rises (Ashworth and Wisniewski, Citation1991; Knight et al., Citation1996; Minorsky, Citation1989). On the other hand, years were evaluated both separately and together to determine whether there are significant differences between the mLTE values obtained from the buds analyzed according to test approaches. Our main goal here was to compare the test approaches by taking advantage of the high number of samples (mLTE values). When years were evaluated separately, LTE values of 332 buds were used, and when years were evaluated together, LTE values of 665 buds were used and the reliability of the test approaches were tried to be verified. When the years individually are evaluated, there was a different response for each of the test approaches, as shown for 2015–16 and 2016–17. Differences in cold hardiness among the three test approaches within the mLTE values (p ≤ 0.01) were detected for all sampling dates during both years ( and ). There was an overall difference when combining data from all sampling dates. mLTE of dormant buds for TestA-A approach was observed at an air temperature of −17.85°C, for TestA-4 at an air temperature of −17.00°C (mLTE) and for Test20-4 approach an air temperature of −16.64°C (mLTE) in 2015–16 (). In 2016–17, these threshold temperatures were −17.92°C (mLTE) for TestA-A, −15.94°C (mLTE) for TestA-4 approach, −16.44°C (mLTE) for Test20-4 ().
Figure 1. Box and whisker plots showing the distribution of LTE values for dormant buds when the sampling years are evaluated together. The green line shows the median value for each microstructure class. The green box bounds the 25th and 75th percentiles (middle 50%) while the green bars indicate the maximum and minimum observed values. TestA-A (n = 665, LTE values), TestA-4 (n = 665, LTE values) and Test20-4 (n = 664, LTE values) approaches
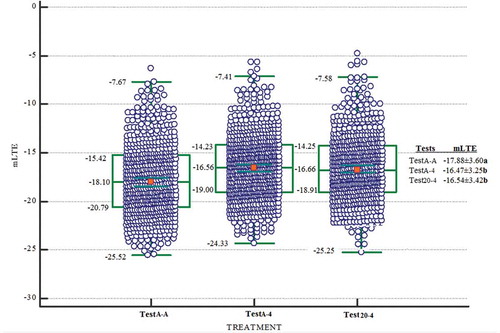
Figure 2. Box and whisker plots showing the distribution of LTE values for dormant buds when the sampling times are evaluated together during 2015–16. The green line shows the median value for each microstructure class. The green box bounds the 25th and 75th percentiles (middle 50%) while the green bars indicate the maximum and minimum observed values. TestA-A (n = 333, LTE values), TestA-4 (n = 633, LTE values), and Test20-4 (n = 332, LTE values) approaches
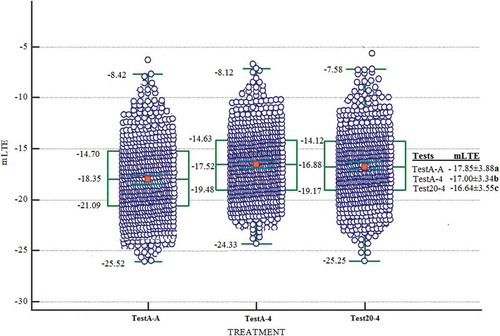
Figure 3. Box and whisker plots showing the distribution of LTE values for dormant buds when the sampling times are evaluated together during during 2016–17. The green line shows the median value for each microstructure class. The green box bounds the 25th and 75th percentiles (middle 50%) while the green bars indicate the maximum and minimum observed values. TestA-A (n = 332, LTE values), TestA-4 (n = 632, LTE values), and Test20-4 (n = 332, LTE values) approaches
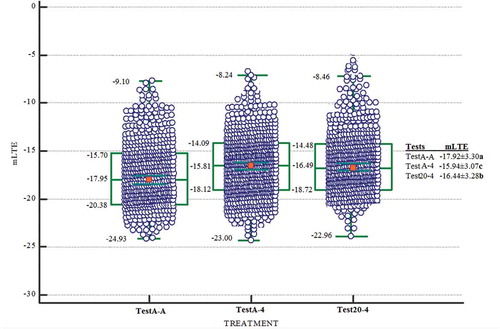
The dormant buds tested by the TestA-A approach were more tolerant to low temperatures when compared with the dormant buds tested using the Test20-4 and TestA-4 approaches. Indeed, compared to TestA-A approach, the death temperatures (mLTE) of dormant buds in the TestA-4 were about 1.41°C higher and about 1.34°C in the Test20-4 based on temperature changes during both years of the study (). Compared to TestA-A approach, the death temperatures (mLTE) of dormant buds were higher about 0.85°C in the TestA-4 and about 1.21°C higher in the Test20-4 based on temperature changes during 2015–16 (). Compared to TestA-A approach, the death temperatures (mLTE) of dormant buds were about 1.98°C higher in the TestA-4 and about 1.48°C higher in the Test20-4 based on temperature changes during 2016–17 (). As a result, the TestA-A approach produced lowest mLTEs compared to the TestA-4 and Test20-A. When the frost hardiness of the dormant buds decreased with a rate of warming and the partial cooling, the height of mLTE increased linearly with TestA-4 and Test20-4 approaches. This suggests that more heat was released by ice nucleation in the dormant buds with a rate of warming and the partial cooling. When the dormant bud is warming after partial cooling, water is released from the ice crystals, pile up during freezing under the collenchymatic plate in the dormant bud cavity (Ide et al., Citation1998; Ishikawa et al., Citation1997; Räisänen et al., Citation2006; Sakai, Citation1982). This free water rapidly rehydrates the surrounding bud tissue with the inclusion of the collenchymatic plate. The dormant bud that is dehydrated during freezing is rehydrated slower than the rate at which the dormant bud deconditioning after warming (Andrews and Proebsting, Citation1987; Ide et al., Citation1998). Analogically, there was a rise in height of mLTE after partial warming-freezing in TestA-4 and Test20-4 as occurred at the freezing point of the dormant bud in this study. This confirmed that the TestA-A approach detected exotherms at the different temperatures than the TestA-4 and Test20-4 approaches. Indeed, earlier results showed that if the temperature suddenly drops, the tissue can be rapidly cooled a few degrees below critical threshold temperature levels and result in freeze damage (Andrews and Proebsting, Citation1987; Ashworth and Wisniewski, Citation1991; Fløistad and Kohmann, Citation2001; Räisänen et al., Citation2006).
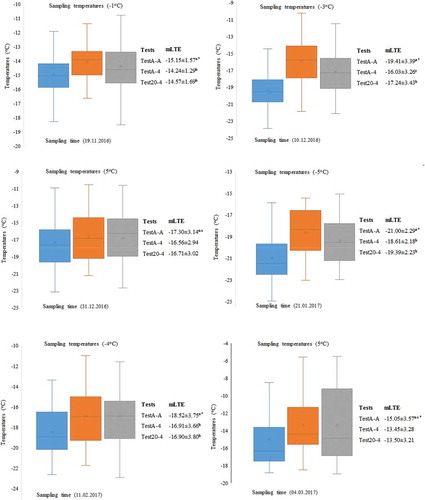
Differences in the values of mLTE among TestA-A, TestA-4, and Test20-4 were more pronounced statistically for the sample temperature 8, 6, −1, −3, −4, −5, and −9°C, except for 3–5°C sampling temperatures or in sampling times 4, 6, 9, and 12 ( and ). Therefore, in this study, mLTE values were compared according to different sampling temperatures in order to see the difference of test approaches explicitly. In 2015–16, samples of dormant buds were taken at temperatures where the vine trunk height was measured by temperature probes as 6, −8, 3, −3, 5, and 8°C in vineyard conditions, whereas the sampling temperatures were −1, −3, 5, −5, −4, and 5°C during 2016–17. Changes in the cold hardiness of buds of the three test approaches have not followed the same general pattern during different sampling temperatures both years of the study. The buds tested at different times with the TestA-A approach was found to be more tolerant to low temperatures compared to the buds tested with the of the TestA-4 and Test20-4 approaches. Comparing the mLTE values of buds in TestA-A with the mLTE values of buds in both TestA-4 and Test20-4, differences were found at eight different sampling temperatures (6, −9, −3, 8, −1, −3, −5, and −4°C). However, when the mLTE values of buds in TestA-A, TestA-4 and Test20-4 were compared, there were not signifincant difference at four sampling temperatures (3, 3, 5 and 5°C) ( and ).
Figure 4. The mLTE values and sampling times of dormant buds taken at six different sampling temperatures (oC, X ± SE, n = 72) for 2015–16. *: Significant at p ≤ 0.01, ns: not significant
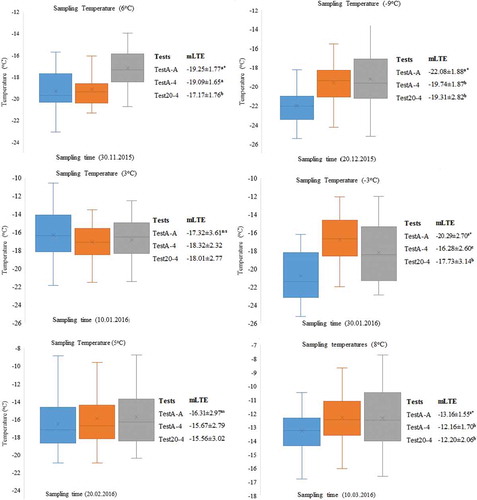
Figure 5. The mLTE values and sampling times of dormant buds taken at six different sampling temperatures (oC, X ± SE, n = 72) for 2016–17. *: Significant at p ≤ 0.01, ns: not significant
The dependence of the rise in deadly temperature caused by rapid cooling on a plant frost tolerance agrees with the findings of Haynes et al. (Citation1992). When plant tissues were submitted to rapid freezing, damage resulting from cell interior freezing may occur at higher temperatures where the rate of diffusion of water from the intracellular could not keep pace with the rate of temperature decrease (Levitt, Citation1980). It is well known that plant tissues cooled little by little to a temperature at which most of the cellular water is frozen extracellularly will endure more freezing independent of cooling rates (Tyler et al., Citation1988). Additionally, Havis (Citation1964) showed that cooled leaf tissues of rhododendron endured temperatures little by little near −40°C, but tissues could not survive when tissues are immediately subjected to −18°C at a faster rate of cooling. The difference between the sampling temperatures and the test start temperature (4°C) of the standard method is ±1 and ±2°C based on the effect on the cold hardiness of the warming-cooling cycle of the dormant buds found in the TestA-A, TestA-4 and Test20-4 approaches were insignificant. Sampling and test initiation temperatures need to be more than 2°C for a difference within the TestA-A, TestA-4 and Test20-4 approaches. These results compared to TestA-A approach indicated that, the death temperatures (mLTE) of dormant buds were found to be between 0.00 and 4.00°C in the TestA-4 approach and 0.00 and 2.77°C in the Test20-4 approach based on temperature changes ( and ). This temperature differential is to confirm the hypothesis that pretest temperature changes could alter the freezing tolerance of the dormant buds and the result of DTA test. Similar effects of rapid cooling-warming on freezing tolerance were found in Norway spruce by Raisanen et al. (Citation2006), who reported that the different cooling rates of 1–5°Ch−1 had a minor effect on the freezing point of primordial shoots of buds. They also found that the cold hardiness of buds decreased rapidly within the first hour of warming at 5°C. In our study, the actual cold hardiness of the dormant buds could not be determined because the sampling temperature was not preserved during the analysis according to the TestA-4 and Test20-4 approaches, except for the TestA-A approach. Since the freezing-warming stress existed in the TestA-4 and Test20-4 approaches, the ideal frost not observed in buds. Thus, the ratio of water frozen at a given temperature is conversely proportional to the temperature in optimal equilibrium freezing conditions (Hansen and Beck, Citation1988; Strimbeck and DeHayes, Citation2000). In conclusion, large rate of the water loss occurred over the first few degrees of cooling below the of freezing point threshold temperature depression of the cell solution (Hansen and Beck, Citation1988; Rajashekar and Burke, Citation1982). On the other hand, controlled laboratory analyzes were widely utilized to determine frost tolerance typically expose tissues to treatment temperatures for ~30–60 min before exposing them to thaw (Arora, Citation2018). However, prolonged (days/hours) versus short (mins) period of freezing can result in a significantly different warming and cooling injury (Pomeroy et al., Citation1975). In our study, dormant buds were analyzed according to the TestA-4 and Test20-4 approaches showed mLTE at higher temperatures because they were exposed to warming and cooling stress for prolonged periods during all tests.
Several factors such as rate of cooling in subfreezing temperatures, the duration of freezing, and rate of thaw related to the freeze-thaw process can impact the magnitude of damage to plant tissues (Arora, Citation2018). On the other hand, there are studies reporting that cells survival in plants increases with thawing rate (Yiu et al., Citation2008). In our study, the thawing rate of samples analyzed with TestA-4 and Test20-4 approaches and taken below zero changed. Especially, the thawing rate of TestA-4 samples was found higher compared to Test20-4. In this regard, we assume that recrystallization of ice inside the cells of plant tissues during thawing can be increased by accelerating the thaw rate, resulting in more cell dehydration and larger ice crystals. Additionally, faster thaw rates in TestA-4 and Test20-4 samples increased the possibility of recrystallization in dormant buds, so that the LTE values of the samples tested by TestA-4 and Test20-4 approaches occurred at higher temperatures compared to TestA-A samples. But, more information on the physiological, molecular and biochemical roles of various cooling, warming and thawing in dormant buds of grapevine is needed to be able to provide more successful test outcomes and overcome the current problem of cold hardiness.
Conclusion
This research evaluated the effects of preprocessing temperatures on DTA results for grapevine buds. Our study brought a solution to the Test20-4 approach, commonly used in a wide plant group such as deciduous wood species with super cooling feature, to be able to make more realistic and reliable estimates preventing the possible effects on cold hardiness of partial cooling-warming. In this regard, this study is a first proof of concept that TestA-A approach gives the most reliable results (66% of the time) of dormant buds exotherm temperatures. Even it has been observed that the dormant bud of mLTE values was determined by the TestA-4 and Test20-4 approaches, these approaches do not reflect the actual mLTE values. We believe that more accurate, consistent and reliable data can be obtained in DTA tests by applying the TestA-A approach. Thus, the roles in cold hardiness of biochemical and physiological events may be more clearly defined based on increasing of accuracy and reliability of data acquired from freezing tests. After determination of data with reliable methods, it will be more likely to possible to apply best suited cultural applications on cold hardiness. Furthermore, it will be much more possible and realizable in the selection of varieties and rootstocks that are tolerated to low temperature or with high adoption skills among current genetic resources and breeding materials. Consequently, it was concluded that the best approach in order to obtain reliable, accurate and consistent mLTE results of TestA-A method in DTA is bringing dormant buds into the laboratory by keeping the temperatures at the sampling time. During the preparation for the test, samples should keep holding at sampling time temperature and then give a start for DTA test again at the sampling time temperatures.
Author Contribution Statement
OK and CK designed this study and performed the experiments. OK and CK analyzed the data and CK wrote the manuscript. CK supervised the experiment and reviewed the manuscript. All the authors read and approved the final manuscript.
Conflicts Of Interest
The authors declare no conflict of interest.
Supplemental Material
Download MS Word (1,012.8 KB)Acknowledgments
This work was supported by TUBITAK (The Scientific and Technological Research Council of Turkey), project no 115O153. Additionally, this study is part of the doctoral dissertation completed by Ozkan Kaya at Ataturk University, Graduate School of Natural and Applied Sciences.
Supplementary Material
Supplemental data for this article can be accessed on the publisher’s website.
References
- Andrews, P.K., C.R. Sandidge, and T.K. Toyama. 1984. Deep supercooling of dormant and deacclimating Vitis buds. Am. J. Enol. Vitic. 35(3):175–177.
- Andrews, P.K., and E.L. Proebsting. 1987. Effects of temperature on the deep supercooling characteristics of dormant and deacclimating sweet cherry flower buds. J. Am. Soc. Horticul. Sci. 112:334–340.
- Andrews, P.K., E.L. Proebsting, and D.C. Gross. 1983. Differential thermal analysis and freezing injury of deacclimating peach and sweet cherry reproductive organs. J. Am. Soc. Horticult. Sci. 108:755–759.
- Arora, R. 2018. Mechanism of freeze-thaw injury and recovery: A cool retrospective and warming up to new ideas. Plant Science. 270:301–313. doi: 10.1016/j.plantsci.2018.03.002.
- Ashworth, E.N., and M.E. Wisniewski. 1991. Response of fruit tree tissues to freezing temperatures. HortScience. 26:501–504. doi: 10.21273/HORTSCI.26.5.501.
- Barney, D.L., C.J. Mancuso, and T.L. Finnerty. 1994. A computerized multiple-chamber controlled freezing system. HortTechnology. 4:266–269. doi: 10.21273/HORTTECH.4.3.266.
- Durner, E.F., and T.J. Gianfagna. 1991. Ethephon prolongs dormancy and enhances supercooling in peach flower buds. J. Am. Soc. Horticult. Sci. 116(3):500–506. doi: 10.21273/JASHS.116.3.500.
- Fennell, A. 2004. Freezing tolerance and injury in grapevines. J. Crop Improve. 10(1–2):201–235. doi: 10.1300/J411v10n01_09.
- Ferguson, J.C., M.M. Moyer, L.J. Mills, G. Hoogenboom, and M. Keller. 2014. Modeling dormant bud cold hardiness and budbreak in twenty-three Vitis genotypes reveals variation by region of origin. Am. J. Enol. Vitic. 65(1):59–71. doi: 10.5344/ajev.2013.13098.
- Fløistad, I.S., and K. Kohmann. 2001. Effects of thawing procedure on frost hardiness, carbohydrate content and timing of bud break in Picea abies. Scandin. J. For. Res. 16(1):30–36. doi: 10.1080/028275801300004389.
- Graham, P., and R. Mullin.1976. The determination of lethal freezing temperatures in buds and stems of deciduous azalea [Rhododendron] by a freezing curve method. J. Am. Soc. Horticult. Sci. 101:3-7.
- Grant, T.N., and I.E. Dami. 2015. Physiological and biochemical seasonal changes in Vitis genotypes with contrasting freezing tolerance. Am. J. Enol. Vitic. 66:195–203. doi: 10.5344/ajev.2014.14101.
- Hansen, J., and E. Beck. 1988. Evidence for ideal and non-ideal equilibrium freezing of leaf water in frosthardy ivy (Hedera helix) and winter barley (Hordeum vulgare). Bot. Acta. 101:76–82. doi: 10.1111/j.1438-8677.1988.tb00014.x.
- Havis, J.R. 1964. Freezing of rhododendron leaves. J. Am. Soc. Horticult. Sci. 84:570–574.
- Haynes, C.L., O.M. Lindstrom, and M.A. Dirr. 1992. Cooling and warming effects on cold hardiness estimations of three woody ornamental taxa. HortScience. 27:1308–1309. doi: 10.21273/HORTSCI.27.12.1308.
- Ide, H., W.S. Price, Y. Arata, and M. Ishikawa. 1998. Freezing behaviors in leaf buds of cold-hardy conifers visualized by NMR microscopy. Tree Physiol. 18:451–458. doi: 10.1093/treephys/18.7.451.
- Ishikawa, M., W.S. Price, H. Ide, and Y. Arata. 1997. Visualization of freezing behaviours in leaf and flower buds of full-moon maple by nuclear magnetic resonance microscopy. Plant Physiol. 115:1515–1524. doi: 10.1104/pp.115.4.1515.
- Kaya, Ö., and C. Köse. 2017. Determination of resistance to low temperatures of winter buds on lateral shoot present in Karaerik (Vitis vinifera L.) grape cultivar. Acta Physiol. Plant. 39(9):209. doi: 10.1007/s11738-017-2513-7.
- Kaya, O., and C. Kose. 2019. Cell death point in flower organs of some apricot (Prunus armeniaca L.) cultivars at subzero temperatures. Sci. Hortic. 249:299–305. doi: 10.1016/j.scienta.2019.01.018.
- Kaya, O., C. Kose, and T. Gecim. 2018. An exothermic process involved in the late spring frost injury to flower buds of some apricot cultivars (Prunus armenica L.). Sci. Hortic. 241:322–328. doi: 10.1016/j.scienta.2018.07.019.
- Kaya, O., C. Kose, V. Donderalp, T. Gecim, and S. Taskın. 2020. Last updates on cell death point, bud death time and exothermic characteristics of flower buds for deciduous fruit species by using differential thermal analysis. Sci. Hortic. 270:109403. doi: 10.1016/j.scienta.2020.109403.
- Knight, H., A.J. Trewavas, and M.R. Knight. 1996. Cold calcium signaling in Arabidopsis involves two cellular pools and a change in calcium signature after acclimation. Plant Cell 8(3):489–503. doi: 10.1105/tpc.8.3.489.
- Kovács, L.G., G. Du, and P. Ding. 2002. Tissue moisture loss during sample preparation lowers exotherm temperatures in dormant grape buds. HortScience 37(4):701–704. doi: 10.21273/HORTSCI.37.4.701.
- Levitt, J. 1980. Responses of plants to environmental stresses. vol. 1. Chilling, freezing, and high temperature stresses. Academic, New York.
- Liu, J., O.M. Lindstrom, and D.J. Chavez. 2019. Differential thermal analysis of ‘Elberta’and ‘Flavorich’Peach flower buds to predict cold hardiness in Georgia. HortScience 54(4):676–683. doi: 10.21273/HORTSCI13518-18.
- Londo, J.P., and A.P. Kovaleski. 2017. Characterization of wild North American grapevine cold hardiness using differential thermal analysis. Am. J. Enol. Vitic. 68(2):203–212. doi: 10.5344/ajev.2016.16090.
- Londo, J.P., A.P. Kovaleski, and J.A. Lillis. 2018. Divergence in the transcriptional landscape between low temperature and freeze shock in cultivated grapevine (Vitis vinifera). Horticul. Res. 5:10. doi: 10.1038/s41438-018-0020-7.
- Mills, L.J., J.C. Ferguson, and M. Keller. 2006. Cold-hardiness evaluation of grapevine buds and cane tissues. Am. J. Enol. Vitic. 57(2):194–200.
- Minorsky, P.V. 1989. Temperature sensing by plants: A review and hypothesis. Plant. Cell Environ. 12(2):119–135. doi: 10.1111/j.1365-3040.1989.tb01924.x.
- Montano, J.M., M. Rebhuhn, K. Hummer, and H.B. Lagerstedt.1987. Differential thermal analysis for large-scale evaluation of pear cold hardiness. HortScience, 22(6):1335-1336..
- Nordin-Henriksson, K., and A.J. Trewavas. 2003. The effect of short term low temperature treatments on gene expression in Arabidopsis correlates with changes in intracellular Ca2+ levels. Plant Cell Environ. 26(4):485–496. doi: 10.1046/j.1365-3040.2003.00979.x.
- Pomeroy, M.K., C.J. Andrews, and G. Fedak. 1975. Cold hardening and dehardening responses in winter wheat and winter barley. Can. J. Plant Sci. 55(2):529–535. doi: 10.4141/cjps75-079.
- Proebsting, E.L., and H.H. Mills. 1971. Use of controlled freezing techniques for estimating critical temperatures for fruit buds. Washington Agricul. Exper. Sta. Circul. 548.9p
- Quamme, H.A. 1972. The relationship of exotherms to cold injury in apple stem tissues. J. Am. Soc. Horticult. Sci. 97:608–613.
- Quamme, H.A. 1986. Use of thermal analysis to measure freezing resistance of grape buds. Can. J. Plant Sci. 66:945–952. doi: 10.4141/cjps86-116.
- Räisänen, M., T. Repo, and T. Lehto. 2006. Effect of thawing time, cooling rate and boron nutrition on freezing point of the primordial shoot in Norway spruce buds. Ann. Bot. 97(4):593–599.
- Rajashekar, C.B., and M.J. Burke. 1982. Liquid water during slow freezing based on cell water relations and limited experimental testing, p. 211–220. In: P.H. Li and A. Sakai (eds.). Plant cold hardiness and freezing stress. Academic Press, New York.
- Rende, M., C. Kose, and O. Kaya. 2018. An assessment of the relation between cold-hardiness and biochemical contents of winter buds of grapevine cv. ‘Karaerik’ in acclimation-hardening deacclimation phases. Mitteil. Klostern. 68:67–81.
- Sakai, A. 1982. Extraorgan freezing of primordial shoots of winter buds of conifer, p. 199–209. In: eds. (P.H. Li and A. Sakai.). Plant cold hardiness and freezing stress. Vol. 2. Academic Press, New York.
- Salazar-Gutiérrez, M.R., B. Chaves, and G. Hoogenboom. 2016. Freezing tolerance of apple flower buds. Sci. Horticul. 198:344–351. doi: 10.1016/j.scienta.2015.12.003.
- Salazar-Gutierrez, M.R., B. Chaves, J. Anothai, M. Whiting, and G. Hoogenboom. 2014. Variation in cold hardiness of sweet cherry flower buds through different phenological stages. Sci. Horticul. 172:161–167. doi: 10.1016/j.scienta.2014.04.002.
- SAS Institute: SAS User’s Guide. 2002. Statistics, version 9th. statistical analysis system. SAS Inst., Inc., Cary.
- Strimbeck, G.R., and D.H. DeHayes. 2000. Rapid freezing injury in red spruce: Seasonal changes in sensitivity and effects of temperature range. Tree Physiol. 20(3):187–194. doi: 10.1093/treephys/20.3.187.
- Tyler, N., C. Stushnoff, and L.V. Gusta. 1988. Freezing of water in dormant vegetative apple buds in relation to cryopreservation. Plant Physiol. 87:201–205. doi: 10.1104/pp.87.1.201.
- Wample, R.L., G. Reisenauer, A. Bary, and F. Scheutze. 1990. Microcomputer-controlled freezing, data acquisition, and analysis system for cold hardiness evaluation. HortScience. 25:973–976. doi: 10.21273/HORTSCI.25.8.973.
- Wolf, T.K., and R.M. Pool. 1986. Microcomputer-based differential thermal analysis of grapevine dormant buds. HortScience 21:1447–1448.
- Yiu, W.K., S.W. Cheng, and B.E. Sumpio. 2008. Synergistic effect of cool/thaw cycles on vascular cells in an in vitro model of cryoplasty. J. Vascu. Intervent. Rad. 19(6):925–930. doi: 10.1016/j.jvir.2008.02.007.
- Zabadal, T.J., I.E. Dami, M.C. Goffinet, T.E. Martinson, and M.L. Chien. 2007. Winter injury to grapevines and methods of protection. p. 36–37. Michigan State University Publications on Grape Production, Michigan, USA.
- Zhang, J., X. Wu, R. Niu, Y. Liu, N. Liu, W. Xu, and Y. Wang. 2012. Coldresistance evaluation in 25 wild grape species. Vitis 51(4):153–160.