
 ?Mathematical formulae have been encoded as MathML and are displayed in this HTML version using MathJax in order to improve their display. Uncheck the box to turn MathJax off. This feature requires Javascript. Click on a formula to zoom.
ABSTRACT
Ecuador is the main exporter of passion fruit concentrate. Passion fruit production is located in the subtropical areas of the Ecuadorian coast and, due to the geographical location of the country, it is possible to harvest fruit throughout the year. However, the production yield in Ecuador is low compared to other countries because there is little genetic improvement and there is little information about its behavior in sites at different altitudes. Therefore, the objective of this research was to determine the effect of the genotype x environment interaction on yield and fruit quality of seven passion fruit populations in different productive locations. The experiment was carried out in five production areas (Jama, Rocafuerte, San Isidro, Quevedo and Santo Domingo) with different environmental conditions. The highest yield (29167 kg ha−1) was obtained in the locality of Santo Domingo (479 m), while the smallest shell thickness (6.48 mm) was observed in San Isidro (243 m), and the highest solids content soluble (14.87 ° Brix) was shown in Quevedo (73 m). Based on the results, it was concluded that there was a highly significant genotype x environment effect; therefore, the variation observed in the behavior of the evaluated populations was due to the adaptation of the genotypes to the conditions of the different locations.
Introduction
In the world there are about 600 known species of Passiflora. This genus is characterized by being semi herbaceous plants and usually they are climbers with axillary tendrils (Ayres et al., Citation2015). In the family Passifloraceae, Passiflora edulis Sims has the designation of “passion fruit” (Joy, Citation2010).
The sour passionfruit is the most important commercial species of this genus. It originated in the Amazon region of Brazil but has been commercially cultivated in countries such as Colombia, Ecuador, Peru, Venezuela, Hawaii, Australia, New Zealand, South Africa and Kenya (Ocampo et al., Citation2013; Pinzón et al., Citation2007; Santos and Gilreath, Citation2006). This fruit is valued not only for its taste and aroma but also for its nutritional content because it is a source of vitamin A, niacin, riboflavin and ascorbic acid (Valarezo Concha et al., Citation2014; Zibadi and Watson, Citation2004).
Commercial cultivation of passion fruit was introduced in Ecuador in the 1970s. In the country there are 8704 hectares with an average yield of 5.57 t ha−1 and its production is mostly destined (> 95%) for extraction and pulp (Álvarez et al., Citation2018; Instituto Nacional de Estadística y Censo [INEC], Citation2018). The geographical location of the country allows for the harvest of the fruit throughout the year, making Ecuador the main exporter of this fruit concentrate (Ocampo et al., Citation2013).
The average production in Ecuador, however, is low compared to the yield obtained in other countries such as Brazil (14.6 t ha−1) and Colombia (19.5 t ha−1) (Álvarez et al., Citation2018; Institute National Statistics and Census [INEC], Citation2018). This lower yield is mainly caused by pest attack, poor fertilization, genetic degeneration and the lack of genetic improvement of this species (Álvarez et al., Citation2018; Ocampo et al., Citation2013). Among current commercial crops there is a variation in shape and size of the fruit, forcing the producer to carry out a selection process before sending fruit to the market, thus affecting the effective yield and causing increased production costs (Cañizares Chacín and Jaramillo Aguilar, Citation2015; Ocampo et al., Citation2013)
In Ecuador, efforts in genetic improvement have been limited compared to those made in other countries such as Brazil where in recent years varieties with high productivity and higher vitamin C content have been released for fresh consumption and destined for the industry (CañizaresChacín and Jaramillo Aguilar, Citation2015; Faleiro et al., Citation2008; Meletti et al., Citation2000). For this reason, it is necessary to develop promising new materials and to evaluate their adaptability and productivity in the various production areas.
This paper aimed to study the effect of genotype x environment interaction (GxE) on the fruit quality traits of seven populations of passion fruit evaluated in five locations on the Ecuadorian coast, with the aim of selecting promising materials with potential for replacing the local cultivars currently grown in Ecuador.
Materials and Methods
Location of the Experiments
The experiments were carried out in five locations in three provinces of the Ecuadorian coast (Jama, Rocafuerte, San Isidro, Quevedo and Santo Domingo) (). At harvest time, fruit was sampled for analysis in the Nutrition and Quality Laboratory of the Santa Catalina Research Site of INIAP.
Table 1. Characteristics of the locations where the passion fruit populations were evaluated
shows the edaphic characteristics of the localities in which the passion fruit populations were evaluated.
Table 2. Soil characteristics of the locations where the passion fruit populations evaluated
Vegetal Material
Five passion fruit populations resulting from segregation of improved genetic material introduced from Brazil, plus two populations (variety Maracuyá lNlAP 2009 and a local germplasm called cultivar Criollo) were used in this study ().
Table 3. Passion fruit populations evaluated in the study of GxE interaction
Statistic Analysis
In the laboratory, a complete random design was used for determining the variables of fruit quality, evaluating five fruits (observations) for each treatment. This evaluation was carried out 3 times in fruits from continuous harvests. On the other hand, to determine the productivity variables, a randomized complete block design with 5 repetitions was used, evaluating 10 plants per repetition. The yield was the recorded fruit harvest for every week for a period of 8 months and the accumulated result was analyzed for each population evaluated.
Data analysis was made according to the Additive Main Effects and Multiplicative Interaction Model Analysis (Pérez-Ruiz et al., Citation2016). This model is based on the analysis of the main components and through the simultaneous representation of genotypes and environments in the two-dimensional Biplot graph; the latter shows differences between environments, degree of interaction of the genotype with the environment, stability and specific adaptations of some genotypes to certain environments.
This analysis was carried out for each variable and for the combination of the most representative variables for both the producer (yield) and the industry (fruit weight, shell thickness and soluble solids content). Once the variables that are important for assessing fruit quality and productivity were determined, they were combined through a multiple score giving more weighting to the soluble solids content (40%), yield (30%), shell thickness (20%) and fruit weight (10%).
The total Z score was composed based on the participation of the individual Z scores as follows:
Considering
The Z score index (Ghasemi and Zahediasl, Citation2012) was given by the following expression:
where Zi is the Zscore of each variable (standardization of the variables) and wi is the weighting assigned to each variable. In the case of shell thickness, this coefficient was inverted since a thinner skin is more desirable in this fruit crop.
To determine the effect of the GxE interaction, the percentage of variation of the treatments was calculated between the locations that presented the highest and lowest value of each variable, with the following formula:
Where% V corresponds to the percentage of variation of each treatment; V1 is the lowest value of the variable among all locations, while V2 is the highest value of the variable among all locations.
The variables were divided into two groups: productivity and fruit quality variables.
Productivity Variables
Yield (Kg Ha −1)
To measure this variable, fruit from 10 plants were collected per repetition in each treatment. Fruits were collected once a week for 8 months in order to obtain a cumulative yield. Fruit harvested was weighed using a digital scale (Metter Toledo Wildcat, WS30R). The fruits were harvested by coloration when they were 60% green and 40% yellow (maximum accumulation of dry material) (Fischer, Citation2010). The data were converted into kg ha−1.
Fruit Weight (G)
This was determined on five fruits per repetition, using an analytical scale (Detecto, TSK).
Polar and Equatorial Diameters (Mm)
These were determined using a digital caliper (Stanley). The polar and equatorial diameter of five fruits per repetition were recorded.
Fruit Quality Variables
Measurements were made in 5 fruits per repetition for each treatment to record the fruit quality variables.
Shell Thickness (Mm)
Shell thickness was determined using a digital caliper (Stanley).
Content of Pulp, Peel and Seeds (%)
In the first instance, the weight in grams of the whole fruit was recorded. The shell was obtained by removing it with a knife. The pulp was obtained by liquefying the fruit without skin for 30 seconds. The seed was separated from the pulp by a waterjet and a sieve, and dried at 60°C in an oven (Precision Scientific, Heratherm). Then the weight of each portion was recorded and the following calculations were done:
Where Pf is the weight of whole fruit, Wp is the pulp weight, Wsh is the shell weight, and Ws is the seed weight. All of them are expressed in grams.
Content of Soluble Solids (° Brix)
An optical refractometer (Carl Zeiss, DY-T20) was used, in which two drops of fruit juice were placed on the surface prism. The concentration of soluble solids was expressed directly with the value of the °Brix reading (Brito and Vásquez, Citation2013).
Titratable Acidity (%)
To determine this parameter, 30 g of liquefied fruit was weighed and taken to a known volume (200 ml) with distilled water. Once the potentiometer (Hanna instruments, HI211) was calibrated, a 0.1 N sodium hydroxide solution was used to titrate until the color change of the phenolphthalein indicator (pH 8.2) occurred. This variable was calculated using the following formula:
Where VNaOH is the volume of sodium hydroxide consumed in the titration, N is the normality of the sodium hydroxide solution, meq is the milliequivalents of the predomint citric acid 0.064, Vt is the final volume, Ws is the sample weight and Va is the volume of the aliquot.
Maturity Ratio
This index is important for determining fruit maturity and is the result of analyses of soluble solids and titratable acidity. This variable was calculated using the following formula:
Where IM is the index or maturity radio, SS is the soluble solid content (°Brix) and A is the titratable acidity (grams of representative acid/100 grams of pulp).
Vitamin C
The amount of ascorbic acid present in the pulp was quantified. A digital reflectometer (Merck, RQ flex plus 10) was used, using test strips (Merck, 25–450 mg/l). 30 g of pulp was diluted to a known volume with distilled water, the strip was immersed in this dilution, taken to the reader, and the value obtained was then calculated using the following formula:
Where ,
and
.
pH. The pH was determined directly in the pulp, using an electrode potentiometer (Hanna Instruments, HI 2211) calibrated with the buffers of pH 4 and pH 7.
Results
Productivity Variables
In relation to yield (), it was observed that the Criollo cultivar population differed from the rest of the populations (P > .05), showing the lowest yield. In relation to the GxE interaction, taking into account all locations, the highest yields were shown by EEPM7 (20514.33 kg ha−1), EEPM10 (19223.20 kg ha−1), EEPM19 (24046.00 kg ha−1) all coming from the improved material introduced from Brazil, and INIAP 2009 (20420.80 kg ha−1). In general, all populations were shown to have a better yield than the cultivar Criollo. It was observed that all improved populations increased their yield in the locality of Santo Domingo, while the cultivar Criollo decreased in this site. On the other hand, the cultivar Criollo showed the least variation (49%); while the EEPM5 population showed the greatest effect of GxE interaction (76%variation). The lowest yields were observed in the location of San Isidro, while Santo Domingo obtained the highest values.
Table 4. Results of the GxE interaction for the productivity variables
For the fruit weight variable (), it was observed that the cultivar Criollo population was different from the rest of the populations (P < .05), showing the lowest value; while the rest of the populations were located in the same range of significance, presenting the highest values of this variable. In relation to the GxE interaction, the lowest average fruit weight was obtained by the cultivar Criollo (93.01 g); while the highest value was observed in the population of the variety INIAP 2009 (174.29 g). It was observed that EEPM19 and cultivar Criollo populations showed the smallest variation and the least effect of GxE interaction (25% and 24%, respectively), indicating that these populations for this variable may be considered to be stable in these environments. On the other hand, the EEPM2 population showed the greatest effect of GxE interaction (variation of 45%). The lowest values of this variable were observed in Rocafuerte; while the highest values were shown in Santo Domingo.
The polar diameter and equatorial diameter () behaved similarly, where the cultivar Criollo population had the lowest value for the two variables and was different from the rest of the populations (P < .05). In relation to the GxE interaction, the populations with the highest value of the two variables all came from the improved material introduced from Brazil. With regard to the variation in polar diameter, it was observed that the cultivar Criollo had the lowest variation (12%), while the EEPM2 population had the highest value (17%). In terms of the equatorial diameter, the greatest variation was observed in the EEPM7 population (18%), while the lowest was shown in the variety INIAP 2009. The lowest values of the two variables were observed in the locality of Rocafuerte; while the highest values were obtained in Santo Domingo.
Fruit Quality Variables
For the shell thickness variable (), it was observed that the cultivar Criollo population was different from the rest of the populations (P < .05), presenting the lowest value (5.31 mm) while the rest of the populations were located in the same range of significance and presenting the highest values. It is worth mentioning that the INIAP 2009 variety showed a desirable value (4.79 mm) when it was grown in San Isidro (Manabí). EEPM10 population showed the lowest variation (16%) and the lowest effect of GxE interaction; indicating that this population for this variable may be considered to be stable in these environments. On the other hand, the cultivar Criollo showed the greatest effect of GxE interaction with a variation of 50%. In general, there is a trend where the lowest values of this variable were observed in San Isidro, while the highest values were shown in Santo Domingo.
Table 5. Results of the GxE interaction for the fruit quality variables
Regarding the pulp content (), it was observed that the cultivar Criollo population and the EEPM5 population differed from the rest of the populations (P < .05), showing the highest percentage of pulp content with 41.9 and 37.09% respectively. EEPM10 population showed the smallest variation (25%) and the lowest effect of GxE interaction; indicating that this population for this variable may be considered to be stable in these environments. On the other hand, EEPM2 population showed the greatest effect of GxE interaction (variation of 44%). In general, it was observed that highest values of this variable were observed in San Isidro, while the lowest values were shown in Santo Domingo. Comparing this variable with yield, it was observed that, despite San Isidro obtaining the lowest yield, in this location the highest fruit pulp content was achieved.
For the shell content variable (), the populations of cultivar Criollo, INIAP 2009, EEPM2 and EEPM5 were different from the rest of the populations (P < .05) with the lowest values of 43.02; 50.41; 49.06 and 50.96% respectively. The EEPM10 population showed the smallest variation (31%) and the lowest effect of GxE interaction while the cultivar Criollo population showed the greatest effect of GxE interaction, with a variation of 49%. In general, the lowest values of this variable were observed in Jama, while the highest values were shown in Santo Domingo.
Regarding seed content (), no differences were observed between the populations (P > .05). It was observed that the cultivar Criollo population showed the lowest variation (53%) and the lowest effect of GxE interaction, while the EEPM10 population presented the greatest effect of GxE interaction with a variation of 62%. In general, it was observed that the highest values of this variable were found in Jama, while the lowest values were shown in Santo Domingo.
In terms of vitamin C content (), the populations of EEPM2, EEPM19 and variety INIAP 2009 were different from the rest of the populations (P < .05) with the highest vitamin C content, with: 21.49, 21.19 and 21.10 mg/100 g respectively. The EEPM2 population showed the smallest variation (23%) and the lowest effect of GxE interaction; indicating that this population for this variable may be considered to be stable in these environments. On the other hand, the variety INIAP 2009 showed the greatest effect of GxE interaction with a variation of 44%. It was observed that the lowest values of this variable were found in Rocafuerte, while the highest values were shown in San Isidro.
Regarding the pH (), differences between populations were observed (P < .05). The EEPM5, INIAP 2009 and cultivar Criollo populations showed the lowest variation (6%) and the lowest GxE interaction effect; indicating that these populations for this variable may be considered to be stable in these environments. While the EEPM10 population showed the greatest effect of GxE interaction with a variation of 13%. The lowest values of this variable were observed in Rocafuerte, while the highest values were shown in San Isidro.
In terms of titratable acidity (), it was observed that there were no differences between the populations (P > .05). It was observed that the EEPM19 population showed the smallest variation (9%) and the lowest effect of GxE interaction, considering this population stable among the environments; while the EEPM10 population showed the greatest effect with a variation of 47%. The highest values of this variable were observed in Rocafuerte, while the lowest values were obtained in Santo Domingo.
Regarding the content of soluble solids (SS) (), it was observed that the populations EEPM7 (14.02° Brix), EEPM10 (13.91° Brix), EEPM19 (14.05° Brix) and cultivar Criollo (14.60° Brix) were similar statistically (P > .05), showing the highest values for this variable. EEPM2 population showed the smallest variation (9%) and the lowest effect of GxE interaction, indicating that this population for this variable may be considered to be stable in these environments. On the other hand, the EEPM5 population showed the greatest effect with a variation of 41%. It was observed that the lowest value of this variable was showed in San Isidro, while Quevedo obtained the highest value.
Finally, for the variable maturity ratio, (), differences between treatments were observed (P < .05). EEPM10 population (4.00) showed the highest value. On the other hand, variety INIAP 2009 population showed the smallest variation (19%) and the lowest effect of GxE interaction, indicating that this population for this variable may be considered to be stable in these environments. While EEPM10 population showed the greatest effect of GxE interaction with a variation of 44%. The lowest values of this variable were observed in Rocafuerte, while the highest values were shown in Santo Domingo.
In the analysis of variance for the fruit quality model explained by the GxE interaction, it was observed that this interaction was highly significant (p < .01), therefore, the variability achieved should be due to the degree of adaptation of the various genotypes to the different locations, as well as the expression of the phenotype in relation to the edaphic and environmental conditions of each site.
Principal Component Analysis
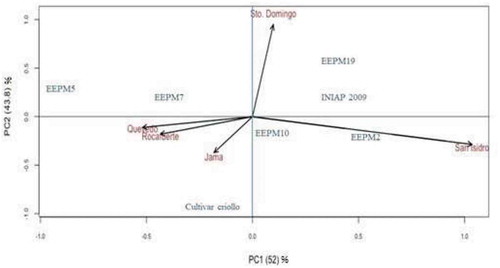
In the analysis of main components for the GxE interaction, the coefficient of determination of the model was significant with a value of 0.731, and the variability explained by the first two components was 95.8% (), both components being highly significant. Gauch (Citation2006) mentions that the prediction model of the interaction between varieties and environments is best obtained with the first components.
Table 6. Analysis of principal components for the GxE interaction of 7 passion fruit populations evaluated in 5 locations of the Ecuadorian Littoral
The first component described a comparison of the agro-climatological factors of the localities of Quevedo and Rocafuerte against San Isidro; while the second component was a gradient of the representative agro-climatic factors of Santo Domingo compared to the lack of those typical factors in the other locations.
In , it can be observed that EEPM5 and EEPM7 populations better expressed their variables in Quevedo and Rocafuerte while the variety INIAP 2009 was best expressed in the localities of Santo Domingo and San Isidro. In addition, EEPM19 population performed better in Santo Domingo and the EEPM2 population in San Isidro. An adaptation tendency of the cultivar Criollo was observed in the locality of Jama, whereas this cultivar showed less adaptation in Santo Domingo. A negative interaction between the EEPM5 population in the locality of San Isidro was observed, where the fruit quality was poor. Both the EEPM19 population and variety INIAP 2009 decreased their fruit quality in Rocafuerte, Quevedo and Jama.
Figure 1. Biplot of principal components for the GxE interaction of 7 passion fruit populations evaluated in 5 locations of the Ecuadorian Littoral
Z Score Index
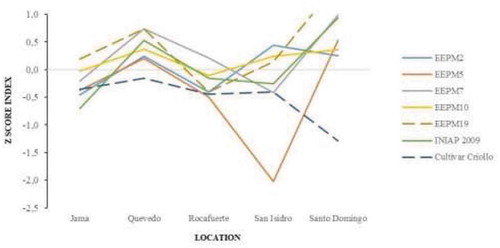
shows the GxE interaction for the Z score index. Cultivar Criollo showed the best values of this index in the localities of Jama (−0.36) and Quevedo (−0.16), decreasing in Rocafuerte (−0.44), San Isidro (−0.41) and Santo Domingo (−1.29). Variety INIAP 2009 showed better results for fruit quality in the localities of Quevedo (0.53) and Santo Domingo (0.93). EEPM5 population showed lower fruit quality traits in San Isidro (−2.02), although it improved in Santo Domingo (0.53). EEPM19 population showed good performance in Santo Domingo (1.57).
Figure 2. Graph of the GxE interaction for the weighting of fruit quality variables
Discussion
Regarding the productivity variables, it was observed that the cultivar Criollo had the lowest yield. This material has not been considered in a breeding program and so continues to produce small fruit, which directly influence yield. On the other hand, the rest of the populations (from the material introduced from Brazil) showed higher yields with values similar to those reported by Álvarez et al. (Citation2018) for the INIAP 2009 variety. In addition, these authors mention that the yield can be increased by having high planting densities. Dorado Guerra et al. (Citation2013) obtained similar results when they evaluated passion fruit in response to the combination of irrigation and fertilization.
The populations coming from the improved material (including the INIAP 2009 variety) showed higher fruit weights in comparison to the cultivar Criollo which is a local material. Fruit weight values were higher than those reported by Ángel-Coca et al. (Citation2011) when they evaluated this fruit crop but inferior to those reported by Sindoni Vielma et al. (Citation2012).
According to Pachón et al. (Citation2006), passion fruit produces fruits with a diameter between 40 and 80 mm which is consistent with the results obtained in this research since the fruits evaluated showed equatorial diameters between 60 and 80 mm. In addition, the results of our study showed greater average size of diameters to those obtained by Fonseca and Ospina (Citation2007) in purple passion fruit.
The six populations coming from the improved material showed similar values of shell thickness (values between 7.48 and 8.06 mm). These results coincide with those obtained by Álvarez et al. (Citation2018) evaluating the variety INIAP 2009. Skin thickness in passion fruit is inversely proportional to the yield in juice, constituting an important factor in agroindustry (Sindoni Vielma et al., Citation2012). According to Farias et al. (Citation2005), shell thickness is a discriminant variable in the selection of promising materials. Currently, this parameter is a variable to take into account because breeders want to obtain varieties with a lower shell thickness and a higher percentage of pulp (Farias et al., Citation2005). Nascimento et al. (Citation1999) stated as acceptable a shell thickness of about 5 mm in passion fruit, both for fresh consumption and for the industry. In our study, only the EEPM2 population in the locality of Jama showed values close to those acceptable. However, Tello (Citation2011) indicated that shell thickness is related to the environmental factors of each locality. In addition, Espitia-Camacho et al. (Citation2008) stated that this variable is specifically related to the genotype of the materials and also has a positive correlation in relation to fruit weight. The aforementioned would support that the populations coming from the improved material that also produce bigger fruits have a greater shell thickness in comparison to the local cultivar (Criollo) which is a material that has not been improved and has small-sized fruits, and consequently smaller shell thickness.
The main use of passion fruit is for the production of concentrates; it is the reason why pulp content is a very important parameter in the industry (Álvarez et al., Citation2018). These same authors report values between 43 and 50% of pulp content; while Pinzón et al. (Citation2007) found values between 46 and 50%. In our study, only the EEPM2 population grown in San Isidro obtained values comparable to those reported by the aforementioned authors. The cultivar Criollo obtained the highest percentage of pulp although in terms of pulp weight, this material presented an average value of 41.08 g per fruit, a value that was less than the average fruit weight of the improved populations (62.54 g). Consequently, although the cultivar Criollo had a smaller shell thickness, the pulp content in grams was also smaller compared to the other population that showed thicker shell.
The high content of vitamin C (between 30 to 40 mg/100 g of dry fruit weight) is the main characteristic of passion fruit pulp (Vasco et al., Citation2008). In our research, variety INIAP 2009 grown in San Isidro reached a similar content as mentioned above although this value was lower than the value (45 mg/100 g dry fruit weight) reported by Franco et al. (Citation2014). However, the level of ascorbic acid (vitamin C) varies according to the environment by presenting different values depending on the location (Flórez et al., Citation2013), a situation that was evidenced in this study. Further, edaphoclimatic conditions affect plant metabolic activity, as well as the concentration of compounds such as organic acids, involved in the development and maturation of the plant, (Morales, Citation2011). In this case, the pH of the soil could have affected vitamin C content in the fruit; shows that the San Isidro locality obtained the highest value of vitamin C and its soil had a high pH value (7.6). Pascale et al. (Citation2001) and Burgos et al. (Citation2009) found the same trend in crops such as tomato and potatoes.
Also, stress increases cell oxidation which enhances the synthesis of enzymatic and non-enzymatic antioxidants to counteract the effects of the oxidation. The most important non-enzymatic antioxidants are: ascorbic acid (vitamin C), α-tocopherol (vitamin E), glutathione and β-carotenes (Scandalios, Citation2005). Some compounds related to oxidative and anti-oxidative responses caused by stress factors, such as ascorbic acid, have been found to be involved in tolerance responses to biotic and abiotic stress and optimal development (Shen and Yeh, Citation2010). Ascorbic acid is present in chloroplasts, cytosol, vacuoles, and apoplastic space; constituting perhaps the most important non-enzymatic antioxidant in plants, which participates in the defense against biotic and abiotic oxidative stress (Smirnoff, Citation1996).
Motta and Otero (Citation1984) state that passion fruit has a pH that ranges between 2.5 and 3.0. The values obtained in this research were slightly higher than those reported by these authors, similar to those indicated by Aponte and Guadarrama (Citation2003) and by Aular et al. (Citation1995) but slightly higher than those reported by Pinzón et al. (Citation2007) and Sindoni Vielma et al. (Citation2012).
The titratable acidity parameter is related to the amount of citric acid present in the fruit. Organic acids contribute to flavor, in a relationship between sugars and acids in different fruit species (Wills et al., Citation1998). In this research, there were no differences between populations for this variable, the values varying between 3.58 and 3.85 and close to the value (3.90) reported by Fonseca and Ospina (Citation2007).
The total soluble solids content must be high for fresh consumption or for the market (Sindoni Vielma et al., Citation2012). All populations coming from the improved material showed acceptable values (between 13 and 14° Brix) of soluble solids. According to the Ecuadorian Thecnical Standart NTE INEN 2 337:2008 (base on the Norm CODEX STAN 247, Citation2005), the minimum Brix degrees requeried in the passion fruit fruit needed for the industry (juice or concentrate) are 12 ° Brix. The results of this study were similar to those obtained by Álvarez et al. (Citation2018) and are also within the range (12.53 and 17.11° Brix) reported by Sindoni Vielma et al. (Citation2012). While the concentration of soluble solids in the fruit is higher, less fruit will be used to obtain the juice concentrate (Da Silva et al., Citation2008). Osterloh et al. (Citation1996) stated that the amount of sugars in the fruit depends on factors such as variety, assimilatory yield of the leaves, leaf/fruit ratio, climatic conditions during fruit development, state of growing and maturity. In addition, Viera et al. (Citation2013) mentioned that the heritability of this trait varies according to the type of sugar in the fruit.
Antioxidant capacity is an important parameter on fruits, according to our records about this trait in fruit of commercial cultivars grown in the province of Manabí such as Criollo and INIAP 2009 the results in fresh pulp obtained were 6.00 ± 0.18 µmol trolox g−1 and 6.23 ± 0.12 µmol trolox g-1, respectively.
In terms of maturity ratio, the highest value was obtained in the EEP10 population in the locality of Santo Domingo. This result was similar to the value (4.34) reported by Pinzón et al. (Citation2007). A high value in the maturity ratio in climacteric fruits occurs when the maximum respiratory rate is reached and their organic acid reserves rapidly unfold in response to the increase in their metabolism (Hernández, Citation2001).
The GxE interaction in the analysis of variance for the fruit quality model was highly significant; therefore’ the variability observed is due to the expression or performance of the different genotypes in the distinct locations. Knowledge of the magnitude of the GxE allows evaluation of the stability of the cultivars in a range of environments where they will be introduced, and also allows evaluation of the productive potentials and the possible limitations in each locality (Contreras and Krarup, Citation2000). The interaction of cultivars with environmental factors is of great importance for farmers and in plant breeding programs. The effects that cultivars and environment exert on the GxE interaction are statistically non-additive, indicating that differences in productivity between cultivars will depend on the environment in which they are being cultivated (Contreras and Krarup, Citation2000; Scapim et al., Citation2002). When compared with the crop requirements mentioned by Othman et al. (Citation2018), the locality of Santo Domingo has adequate soil and climatic characteristics that allow better yield, adaptation and trait expression of the evaluated passion fruit populations.
Conclusions
Based on the results of this research, it is concluded that there was a high genotype x environment interaction that was expressed in the yield and fruit quality traits of the evaluated populations. In relation to the desirable traits, the populations EEPM7, EEPM19 and the variety INIAP 2009 achieved the highest yields; the cultivar Criollo obtained the lowest shell thickness although the variety INIAP 2009 obtained an acceptable value when it was grown in San Isidro. The population EEPM19 and the variety INIAP 2009 reached the highest values of vitamin C; while the populations EEPM7, EEPM19 and the cultivar Criollo obtained the highest soluble solids contents. The best yield was observed in the locality of Santo Domingo although both the highest shell thickness and the lowest pulp content were obtained at this site. Based on the results, the locality of Jama reached an acceptable yield, a low value of shell thickness and good pulp content. However, in this site the lowest value of soluble solids content was obtained but this value is higher than the minimum established in the norm for Ecuador.
Passion fruit is a fruit of economic importance for Ecuador, so it is necessary to develop programs for genetic improvement in order to generate new varieties that have the desirable characteristics for productivity and for its use in industry.
Acknowledgments
Authors thank INIAP and the Project “Productividad y Competitividad Frutícola Andina” funded by FONTAGRO for the support to carry out and publish this research. In addition, we thank Lyn Jackson for editing the manuscript.
References
- Álvarez, H., J. Pionce, J. Castro, W.Y. Viera, and A. Sotomayor. 2018. Densidades poblacionales y fertilización nitrogenada en maracuyá. Ecuador es Calidad: Rev. Cient. Ecuat. 5:1–6.
- Ángel-Coca, C., G. Nates-Parra, R.Y. Ospina-Torres, and D. Melo Ortiz. 2011. Biología floral y reproductiva de la gulupa Passiflora edulis sims f. edulis. Caldasia 33(2):433–451.
- Aponte, L.Y., and A. Guadarrama. 2003. Obtención de patrones de proteínas durante la maduración de frutos de parchita maracuyá (Passiflora edulis f. flavicarpa Degener). Rev. Fac. Agron. (Maracay) 29:221–232.
- Aular, J., D. Batista, and N. Maciel. 1995. Características de la fruta de parchita en tres localidades del sur del lago de Maracaibo. Agron. Trop. 46(2):119–127.
- Ayres, A.S., L.L. de Araújo, T.C. Soares, G.M. Costa, F.H. Reginatto, F.A. Ramos, and S. Zucolotto. 2015. Comparative central effects of the aqueous leaf extract of two populations of Passiflora edulis. Rev. Bras. Farmacognosia 25(5):499–505. doi: 10.1016/j.bjp.2015.06.007.
- Brito, B., and W. Vásquez. 2013. Control de Calidad en Pre y Post-cosecha de las frutas. INIAP,Quito, Ecuador.
- Burgos, G., S. Auqui, W. Amoros, E. Salas, and M. Bonierbale. 2009. Ascorbic acid concentration of native Andean potato varieties as affected by environment, cooking and storage. J. Food Compos. Anal. 22(2009):533–538. doi: 10.1016/j.jfca.2008.05.013.
- Cañizares Chacín, A.E., and E.E. Jaramillo Aguilar. 2015. El cultivo de la Maracuyá en Ecuador. UTM: Machala, Ecuador.
- CODEX STAN 247. 2005. Norma general del Codex para zumos y néctares de frutas. FAO: Roma, Italia.
- Contreras, S., and C. Krarup. 2000. Interacción genotipo por ambiente en cinco cultivares de espárrago (Asparragus officinalis L.). Cienc. Investig. Agrar. 27:133–139. doi: 10.7764/rcia.v27i3.1070.
- Da Silva, J., S. De Araújo Neto, V. De Souza Âlvares, V. De Lima, and T. De Oliveira. 2008. Caracterização de frutos de progênies de meios-irmãos de maracujazeiro-amarelo em rio branco – Acre. Rev. Bras. Frutic. 30(2):431–437.
- Dorado Guerra, G., H. Tafur Hermann, and L. Ríos Rojas. 2013. Rendimiento y calidad de la fruta del maracuyá amarillo (Passiflora edulis fo. flavicarpa o. deg.) en respuesta a la combinación del riego y la fertilización. Ingeniería de Recursos Naturales y del Ambiente 12:109–117.
- Espitia-Camacho, M., H. Araméndiz-Tatis, and C. Cardona-Ayala. 2008. Correlaciones para algunas propiedades físicas y químicas del fruto y jugo de maracuyá (Passiflora edulis var. flavicarpa Degener). Agron. Colomb. 26(2):292–299.
- Faleiro, F.G., N.T.V. Junqueira, M.F. Braga, and J.R. Peixoto. 2008. Caracterização de germoplasma e melhoramento genético do maracujazeiro assistidos por marcadores moleculares: Resultados de pesquisa 2005-2008. Embrapa Cerrados-Boletim De Pesquisa E Desenvolvimento (INFOTECA-E), Planaltina, Brasil.
- Farias, M., G. Faria, M. Cunha, C. Peixoto, and J. Sousa. 2005. Caracterização física e química de frutos de maracujá amarelo de ciclos de seleção massal estratificada e de populações regionais. Magistra 17(2):83–87.
- Fischer, G. 2010. Condiciones ambientales que afectan crecimiento, desarrollo y calidad de las pasifloráceas. p. 10.
- Flórez, L., L. Pérez, L. Melgarejo, and S. Hernández. 2013. Manual calendario fenológico y fisiología del crecimiento y desarrollo del fruto de gulupa (Passiflora edulis Sims) de tres localidades del departamento de Cundinamarca, p. 33–51. In: M. LM (ed.). Ecofisiología del cultivo de la gulupa (Passiflora edulis Sims). Universidad Nacional de Colombia, sede Bogotá, Bogotá.
- Fonseca, D., and N. Ospina. 2007. Relación semilla/fruto en dos pasifloras: Granadilla (Passiflora liguralis Juss.) y gulupa (Passiflora edulis Sims.). Trabajo de grado. Facultad de Agronomía, Universidad Nacional de Colombia, Bogotá.
- Franco, G., J. Cartagena, G. Correa, B. Rojano, and A. Piedrahita. 2014. Actividad antioxidante del jugo de Passiflora edulis Sims (Gulupa) durante la poscosecha. Rev. Cub. Plantas Med. 19(1):154–166.
- Gauch, H.G. 2006. Statistical analysis of yield trials by AMMI and GGE. Crop Sci. 46:1488–1500.
- Ghasemi, A., and S. Zahediasl. 2012. Normality tests for statistical analysis: A guide for non-statisticians. Int. J. Endocrinol. Metab. 10(2):486–489. doi: 10.5812/ijem.3505.
- Hernández, M. 2001. Conservación del fruto de arazá (Eugenia stipitata) durante la poscosecha mediante la aplicación de diferentes técnicas. Facultad de Agronomía, Universidad Nacional de Colombia, Bogotá, Tesis Doctoral.
- Instituto Nacional de Estadística y Censo [INEC]. 2018. Encuesta de Superficie y Producción agropecuaria continua. https://www.ecuadorencifras.gob.ec/documentos/webinec/Estadisticas_agropecuarias/espac/espac-2018/Tabulados%20ESPAC%202018.xlsx
- Joy, P. 2010. Passion fruit production technology (Adhoc). Pineapple Research Station (Kerala Agriculture University) Vazhakulam-686670, Muvattupuzha, Ernakulm Dirstict, Kerala, India.
- Meletti, L.M.M., R. Dos Santos, and K. Minami. 2000. Melhoramento do maracujazeiro-amarelo: Obtenção do cultivar Composto IAC-27. Sci. Agric. 57(3):491–498.
- Morales, P. 2011. Vegetales silvestres de uso alimentario. Determinación de compuestos bioactivos y valoración de la capacidad antioxidante. Universidad Complutense de Madrid, Tesis Doctoral.
- Motta, G., and L. Otero. 1984. El cultivo del maracuyá. Rev. Esso Agric. 16(1):18–24.
- Nascimento, T., J. Ramos, and J. Menezes. 1999. Características físicas do maracujá-amarelo produzido em diferentes épocas. Pesqui. Agropec. Bras. 34(12):2353–2358.
- Ocampo, J., R. Urrea, K. Wyckhuys, and M. Salazar. 2013. Exploración de la variabilidad genética del maracuyá (Passiflora edulis f. flavicarpa Degener) como base para un programa de fitomejoramiento en Colombia. Acta Agron. 62(4):352–360.
- Osterloh, A., G. Ebert, W. Held, H. Schulz, and E. Urban. 1996. Lagerung von Obst und üdfrüchten. Verlag Ulmer, Stuttgart, p. 253. VEB Deutscher Landwirtschaftsverlag.
- Othman, N., Z. El Sebaaly, and Y. Sassine. 2018. Comparing the performance of two passion fruit (Passiflora edulis) cultivars under Lebanese climate conditions. IX Int. Sci. Agric. Symp. “AGROSYM 2018”, Jahorina, Bosnia and Herzegovina, 4-7 October 2018. Book of Proceedings. p. 742–747.
- Pachón, A., A. Montaño, and G. Fischer. 2006. Efecto del empaque, encerado y temperatura sobre las características fisicoquímicas y organolépticas de la gulupa (Passiflora edulis f. edulis) en postcosecha, p. 72–78. In: G. Salamanca (ed.). Propiedades fisicoquímicas y sistemas de procesado: Productos hortofrutícolas en el desarrollo agroalimentario. Editora Guadalupe, Bogotá.
- Pascale, S., A. De Maggio, V. Fogliano, P. Ambrosino, and Ritienia. 2001. Irrigation with saline water improves carotenoids content and antioxidant activity of tomato. J. Hortic. Sci. Biothecnol. 76(4):447–453.
- Pérez-Ruiz, J., M. Zamora-Díaz, J. Mejía-Contreras, A. Hernández-Livera, and S. Solano-Hernández. 2016. Estabilidad del rendimiento de grano en cebada maltera en el bajío, México. Chil. J. Agric. Anim. Sci. 32(1):12–19.
- Pinzón, I., G. Fischer, and G. Corredor. 2007. Determinación de los estados de madurez del fruto de la gulupa (Passiflora edulis Sims.). Agron. Colomb. 25(1):83–95.
- Santos, B.M., and J.P. Gilreath. 2006. Influence of nitrogen fertilization and support systems on passion fruit yield and economic feasibility. HortTechnology 16(1):43–45.
- Scandalios, J. 2005. Oxidative stress: Molecular perception and transduction of signals triggering antioxidant gene defenses. Braz. J. Med. Bio. Res. 38:995–1014.
- Scapim, C., R. Oliveira, A. Braccini, D. Cruz, A. Andrade, and M. Vidigal. 2002. Yield stability in maize (Zea mays L.) and correlations among the parameters of the Eberhart and Russel, Lin and Binns and Huehn models. Genet. Mol. Biol. 23(2):387–393.
- Shen, C.-H., and K.-W. Yeh. 2010. The signal network of ascorbate homeostasis. Plant Signal Behav. 5(5):570–572.
- Sindoni Vielma, M., P. Hidalgo Loggiodice, G. Castellanos, and C. Marín. 2012. Parámetros de calidad de 19 cultivares de parchita (Passiflora sp.) al sur del estado Anzoátegui, Venezuela. Rev. Cient. UDO Agric. 12(2):245–252.
- Smirnoff, N. 1996. The function and metabolism of ascorbic acid in plants. Ann. Bot. 78:661–669.
- Tello. 2011. Efecto de diferentes distanciamientos de siembra y altura de soporte sobre la producción y calidad de la maracuyá (Passiflora edulis f. flavicarpa Degener). Universidad Técnica de Manabí, Portoviejo, Ecuador, Tesis de Ing. Agrónomo.
- Valarezo Concha, A., O. Valarezo Cely, A. Mendoza García, H. Álvarez, and C. Vásquez. 2014. El cultivo de maracuyá: Manual técnico para su manejo en el Litoral ecuatoriano.
- Vasco, C., J. Ruales, and A. Kamal-Eldin. 2008. Total phenolic compounds and antioxidant capacities of major fruits from Ecuador. Food Chem. 111(4):816–823.
- Viera, W., P. Alspach, L. Brewer, J. Johnston, and C. Winefield. 2013. Genetic parameters for sugar content in an interspecific pear population. Eur. J. Hortictural Sci. 78(2):56–66.
- Wills, R., B. McGlasson, D. Graham, and D. Joyce. 1998. Postharvest: An introduction to the physiology and handling of fruit, vegetables and ornamentals. CAB International, Nueva York, p. 262.
- Zibadi, S., and R.R. Watson. 2004. Passion fruit (Passiflora edulis). Evidence-Based Integr. Med. 1(3):183–187.