
 ?Mathematical formulae have been encoded as MathML and are displayed in this HTML version using MathJax in order to improve their display. Uncheck the box to turn MathJax off. This feature requires Javascript. Click on a formula to zoom.
ABSTRACT
This study evaluated the feasibility of using bio-markers to develop statistical models for predicting time to maturity of avocado fruit. The experiment used ‘Mendez#1ʹ and ‘Hass’ as model cultivars. Fruit was sampled bi-weekly from two positions within the tree canopy, namely, inside and outside canopy. Nine fruits per canopy position were sampled from fifteen trees of each cultivar. Mesocarp dry matter content (DM), oil content (OC), D-mannoheptulose and perseitol were assessed from 182 to 294 days after full bloom. Simple and multiple linear regression models were successfully developed to predict the maturity parameters of ‘Mendez#1ʹ and ‘Hass’ avocado fruit. Oil content was the most reliable index for predicting the DM due to the strongest positive and significant correlation (r = 0.76; p < .001). Furthermore, OC remained the only best fit in the DM model after backward elimination that was performed. The DM and oil content (OC) were the most successful variables with a strongest positive and significant (r > 0.7; p < .001) correlation with the number of days to reach maturity, suggesting that these parameters can be used to predict the days to maturity. Therefore, a farmer who keep a record of time after full bloom can use the number of days to predict DM and OC, before starting actual maturity tests. The predictive models from this study can be used to predict OC, DM and time (days) to maturity. D-mannoheptulose and perseitol had non-significant predictive values (p > .05), thus did not fit in both models of predicting avocado maturity.
Introduction
Uneven ripening remains the major challenge limiting the competitiveness of the South African avocado industry in the European Union market. Fruits that are harvested prematurely are more likely to shrivel, have a rubbery texture and a watery taste (Magwaza and Tesfay, Citation2015; Olarewaju et al., Citation2016). On the other hand, fruits that are harvested late have a potential of being susceptible to many physiological disorders (Olarewaju et al., Citation2016). The South African avocado industry is export orientated, targeting the European Union market as a destination market. Upon arrival, ethylene ripening hormone is used to ripen the fruit (García-Rojas et al., Citation2016). However, avocado fruit ripens unevenly due to various factors that results in varying fruit age, and hence days to reach edible ripeness. Varying fruit age is characterized by a significant variation in the biochemical markers associated with fruit development and maturity. Biochemical markers are the most reliable maturity indices because they present the current status of fruit stage of maturity (Magwaza and Tesfay, Citation2015).
The mesocarp oil content (OC) and dry matter content (DM) are globally the most preferable avocado maturity indices (Pedreschi et al., Citation2014). The reliable maturity indices are characterized by changing gradually over time during fruit growth and development (Magwaza and Tesfay, Citation2015). However, both of these parameters are measured destructively, therefore, the fruit of known oil or DM content is not the exact fruit that is shipped for export, a representative fruit samples are used. This is very risky due to the high fruit-to-fruit variation that starts to occur from orchard–to-orchard, tree-to-tree and even at the different branches of the same tree. Among the sources of variation, avocado flowering becomes the major one (Hernández et al., Citation2016). Avocado flowering can last up to three months, therefore, this results in higher variation in fruit age. Furthermore, exposure of fruit to sunlight could result in a huge variation in terms of fruit biochemistry, due to the fruit chemical constituents that are produced more in the presence of light (Yahia, Citation2017). This is linked to a strong biochemical composition in fruit from outside canopy resulting from increased biosynthesis of chemical constituents owing to high light intensity (Lahav and Trochoulias, Citation1982; Shezi et al., Citation2019).
Light is necessary for biosynthesis of carotenoids mainly zeaxanthin, α-cryptoxanthin, β-carotene, and α-carotene in the avocado fruit mesocarp (Bill et al., Citation2014; Yahia et al., Citation2017). Fruits that are fully exposed to the sun have a potential of receiving more assimilates due to close proximity from the highly photosynthesizing leaves, hence develop quicker and mature earlier than fully shaded fruit (Shezi et al., Citation2019). This becomes one of the sources of variation in the number of days to reach edible ripeness. A variation in fruit age is a major source of variation that cannot be controlled, since flowering naturally indeterminate and it depends more on environment which is less controllable. Variation due to full exposure to sun or to full shade also cannot be controlled but can be minimized by training and pruning practices.
The DM is made up of number of biochemical compounds which have a potential of giving a more detailed relationship with the development and maturity of the fruit. These include OC, which contributes approximately 70% of DM (Landahl et al., Citation2009), and the heptose sugars, D-mannoheptulose and perseitol, collectively contribute more than 50% of soluble sugars (Liu et al., Citation1999). OC is the most reliable maturity index of avocado fruit. However, determination of OC requires a sophisticated expensive laboratory equipment, as well as the skilled labor to operate it, thus cannot be easily adopted commercially. Therefore, the DM is currently in use commercially because it is relatively easy to determine it and hence estimate maturity of avocado fruit. The DM was chosen based on being strongly positive and significantly correlated to the mesocarp OC (Hernández et al., Citation2016). However, the minimum and maximum DM that result in optimum quality fruit vary between 20% and 40%, hence cause communication problems from one country to another during export (Gamble et al., Citation2010; Woolf et al., Citation2003). This could be due to the variations in the climatic conditions between different countries, which affect the fresh mass of mesocarp tissue, and hence the final DM percentage (Ncama et al., Citation2018; Woolf et al., Citation2003).
The oil content is most reliable because it is determined from the dry mesocarp tissue, hence cannot be varied by the environment like DM. Therefore, in the current study, it is hypothesized that a knowledge of the OC and other biochemical constituents such as heptose (C7) sugars could aid in predicting the DM as a commercially used maturity index, nondestructively, other than evaluating it manually. Conversely, OC and C7 sugars can be predicted from DM since it is easily measured, provided that the variables fit well in the predictive model. Furthermore, a known concentration of all the biochemical compounds does have a relationship with time to reach maturity (days after full bloom). Therefore, knowledge of the optimum OC, DM, and heptose (C7) sugars at which fruit ripen evenly without any form of shriveling, could be used to estimate the number of days to reach maturity. A multivariate analysis using the backwards elimination can be used to identify the variables that best fit in a predictive model (Binder et al., Citation2013). Even though the precision of the findings could be site specific, but at least more than one parameter can be used to make a decision of commencing harvesting, hence reduce the rate of uneven ripening. This study aims to develop a predictive model that can be used to estimate avocado DM at different canopy positions before actual sampling for maturity tests. The objective was to further use the fruit biochemical markers such as DM and C7 sugars; D-mannoheptulose and perseitol to predict the OC and number of days to reach maturity.
Materials and Methods
Plant Material
Fruits were sampled from the commercial orchard at Westfalia Fruit (Pty) LTD, Everdon Estates in the KwaZulu-Natal Midlands (29°27ʹ14.4”S’ 30°16ʹ40.8”E), South Africa. A total of fifteen 8-year old avocado trees (cv. ‘Mendez#1ʹ and ‘Hass’) were selected in a completely randomized design with three replicates and each replicate consisting of five trees. Fruits were sampled inside and outside canopy and transported with a well-ventilated vehicle to the laboratory at the University of KwaZulu-Natal, Pietermaritzburg. The study was conducted during autumn, winter and spring seasons (February to January) during 2018/9 season. Data were collected bi-weekly from 182 days after full bloom (DAFB) to fruit physiological maturity (25% mesocarp dry matter content).
Orchard Management
The experiment was conducted using 8-year old ‘Mendez#1ʹ and ‘Hass’ avocado cultivars grafted onto Dusa® rootstock. Trees were spaced 4 m within rows and 7 m between rows in a slight slope of about 10% in ‘Mendez#1ʹ, in ‘Hass’ the slope was <5%. An orchard was irrigated using automated micro-sprinkler for soil to be maintained at 80–100% field capacity, based on AquaHaus Irrigation Probe requirements. Therefore, there were no specific water volumes and timings, irrigation starts any time after receiving a message that water level is below 80% field capacity. Since the orchard is only 8-years old, no training system, shoot thinning and fruit thinning techniques were performed during the season. For pest management, copper (6.0 g/L using an electrostatics injector) was applied twice a year, in January and November, to control blackspot. Scouting was adopted at a frequency of three days a week (Monday, Thursday and Friday) for identifying fruit flies, mainly Ceratitis capitata (Medfly), C. cosyra (Marula fly), C. rosa (Natal fly) and Bactrocera invadens (Invader fly). In addition to scouting, trapping was also done once a week, also targeting flies and false codling moth (FCM). The temperature and rainfall were monitored continuously ()
Table 1. The minimum temperature (°C), maximum temperature (°C) and total rainfall (mm) recorded during February 2018 to January 2019
Experiment Design and Fruit Sampling
The experiment consisted of two canopy positions, namely, inside canopy and outside canopy. Inside canopy position was characterized by having leaves that are fully shaded, while outside canopy was characterized by having leaves that are fully exposed to the sun. Discrimination of fruit according to canopy positions in this study was done based on the orientation (upper or lower, and fully exposed to the sun or fully shaded) in the tree. The fruit on the inside canopy position was orientated at the lower edge of a tree, and are always fully shaded, while the fruit from the outside canopy is upper fruit of the tree that is always fully exposed to the sun. An experiment was set up in a completely randomized design with three replicates of five trees each in both cultivars. In ‘Mendez#1ʹ cultivar, the study was conducted on primary (summer) crop load, not the one called ‘Winter Hass’.
Fruits were sampled for mesocarp dry matter content, and other biochemical constituents that change during fruit growth and development. Sampling started from 182 days after full bloom to physiological maturity (25% mesocarp DM or ripening without any form of shriveling). Mesocarp dry matter content was measured using a method described by Magwaza and Tesfay (Citation2015) and modified by Olarewaju et al. (Citation2016). Briefly, samples of fresh mesocarp tissue were weighed, snap frozen in liquid nitrogen and freeze dried to constant mass using Virtis Benchtop freeze drier system (ES Model, SP Industries Inc., Warmister, USA) for five days at 0.015 kPa and −75°C. A total of nine fruits per canopy position per cultivar were sampled in each sampling day for nine sampling days. The mesocarp dry matter content was then calculated and expressed as a percentage.
Dry Matter Content (DM)
A sliced mesocarp tissue of known mass was freeze dried until constant mass. Thereafter, it was weighed and the dry matter content was expressed as a percentage of a fraction of dry mass to fresh mass of the mesocarp tissue.
Oil Content (OC)
Dried samples were ground into powder using pestle and mortar, and then stored in the freezer (−75°C) for oil content analysis later. OC was measured following a procedure described by Meyer and Terry (Citation2008) with slight modification. Briefly, each sample powder (300 mg) was put into glass test tube before addition of 92% hexane (9.0 mL). The tubes were placed in the ultrasonic water bath (Model No. 132, Labotec (PTY) Ltd., Johannesburg, South Africa) set at 50°C for 10 min. Thereafter, the supernatant was filtered using a Buchner funnel. Another 6.0 ml of hexane was used to rinse the supernatant (Olarewaju et al., Citation2016). After filtration, the hexane was dried off using a GenVac® concentrator (SP Scientific, Genevac Ltd., Suffolk, UK) under vacuum leaving the oil content of the sample. The mass of residual oil was weighed and presented as a percentage of the 300 mg powder sample.
Determination of Heptulose (C7) Sugars (D-mannoheptulose and Persietol)
Determination of sugar concentrations was done according to Liu et al. (Citation1999) using an isocratic HPLC system (LC – 20AT; Shimadzu Corp., Kyoto, Japan) equipped with a refractive index detector (RID-10A; Shimadzu Corp.) and a 300 mm 7.8 mm Rezex RCM–Monosaccharide column (8 µm pore size; Phenomenex®, Torrance, CA, USA). The concentrations of individual sugars were determined by comparison with D-mannoheptulose and perseitol sugar standards (Glycoteam GmbH, Hamburg, Germany). The total C7 sugars were calculated by summing up the D-mannoheptulose and perseitol concentrations.
Data Analysis
The correlation analysis was conducted using microsoft excel, and used to evaluate the relationship between the measured parameters. The simple and multiple linear regression models were also conducted on the 2013 version of Microsoft excel, and used to predict the DM and time (days after full bloom) to reach maturity.
Results and Discussion
Minimum Maturity
Fruits were sampled bi-weekly for DM, OC and C7 sugars from 182 DAFB to minimum maturity of each cultivar. The minimum maturity in the current study was defined as a stage whereby avocado fruit ripe evenly for the first time without showing any signs of shriveling, discoloration and disorders. The minimum maturity of ‘Mendez#1ʹ was reached at day 266 and 252 inside and outside canopy, respectively. In ‘Hass’ avocado, the minimum maturity was reached during day 210 and 224 inside and outside canopy, respectively. The results of mesocarp DM, OC, and C7 sugars; D-mannoheptulose and perseitol at minimum maturity were presented in .
Table 2. Minimum maturity of ‘Mendez#1ʹ and ‘Hass’ avocado fruit harvested at different canopy positions
Prediction of Mesocarp DM from OC and C7 Sugars
The study attempted to use the mesocarp OC and C7 sugars, D-mannoheptulose and perseitol to predict the minimum mesocarp DM at which fruit will ripe evenly without showing any quality defects. To achieve this, Pearson’s correlation was performed to see the relationship between each of the variables with DM of fruit sampled from different canopy positions. The results generally revealed a strongly negative and significant correlation (p < .001) between the C7 sugars and the DM, in fruit harvested from inside and outside canopy (). In ‘Mendez#1ʹ cultivar, the D-mannoheptulose had a strongly negative and significant correlation with DM inside canopy (r = −0.74; p < .001) and outside canopy (r = −0.84; p < .001). There was also a strongly negative and significant correlation between D-mannoheptulose and DM measured inside canopy (r = −0.70; p < .001) and outside canopy (r = −0.90; p < .001) in ‘Hass’ avocado. In ‘Mendez#1ʹ cultivar, perseitol had a weak negative correlation with DM inside canopy (r = −0.48; p > .05) and significant correlation outside canopy (r = −0.53; p < .05). Perseitol had a strongly negative and significant correlation with DM inside canopy (r = −0.79; p < .001) and outside canopy (r = −0.68; p < .001) in ‘Hass’. The total C7 sugars had a strongly negative and significant correlation with DM inside canopy (r = −0.74; p < .001) and outside canopy (r = −0.83; p < .001) in ‘Mendez#1ʹ.
Table 3. Pearson’s correlation coefficients (r) describing the correlations of oil content and C7 sugars with DM of ‘Mendez#1ʹ and ‘Hass’ avocado fruit sampled inside and outside tree canopies
In ‘Hass’, the total C7 sugars were also negatively correlated with DM inside canopy (r = −0.73; p < .001) and outside canopy (r = −0.92; p < .001). The OC had a strongly positive and significant correlation with the DM inside canopy (r = 0.76; p < .001) and outside canopy (r = 0.85; p < .001) in ‘Mendez#1ʹ. The correlation between the OC and DM was also strongly positive and significant in ‘Hass’ fruit harvested inside (r = 0.86; p < .001) and outside canopy (r = 0.92; p < .001) position. This means almost all the measured parameters significantly affect the DM either in a negative or positive way, with only ‘Mendez#1ʹ fruit sampled inside canopy as an exception. All other parameters directly or indirectly influence the DM. This is due to the fact that all the measured parameters are the components of the DM. Oil content and C7 sugars form a certain proportion of the total DM, hence the higher proportion that a variable contribute, the stronger it correlates with the total DM. For example, the OC is a major component of DM, forms approximately 70% of DM, hence has high chances of contributing significantly in predicting DM. Among the measured variables in the current study, perseitol has a lowest contribution to DM. Perseitol is a strong storage reserve and antioxidant in avocado seed other than the mesocarp tissue, on the other hand, D-mannoheptulose is a strong storage sugar in the mesocarp tissue of avocado fruit (Tesfay, Citation2010).
A strongly negative and significant correlation between the C7 sugars and DM in both canopy positions was associated with the fact that the C7 sugars serve as storage reserves so they are used up over time for other metabolic processes (Blakey et al., Citation2012; Tesfay, Citation2010). Furthermore, the C7 sugars also serve as antioxidants in avocado tissues for protection against physiological disorders, fungal and microbial infection (Tesfay et al., Citation2010). This is one of the reasons why the C7 sugars decrease as avocado fruit matures and the physiological disorders increase as fruit ripen (Blakey et al., Citation2012; Tinyane et al., Citation2018).
Multivariate analysis was used to determine if the C7 sugars (D-mannoheptulose and perseitol), and mesocarp OC can be used to predict DM, a reliable and commercially used avocado maturity index. The predictive values of D-mannoheptulose, perseitol and the total C7 sugars were not significant (p > .05), hence all the C7 sugars were excluded during the inspection of each of the independent variables using the multiple regression backwards elimination (Hosmer and Lemeshow, Citation2000). The OC had highly significant predictive values inside canopy (p = .01) and outside canopy (p = .0055). Therefore, oil content produced a reliable linear model for predicting the mesocarp DM (). Furthermore, the simple linear regression models were used to predict the DM from the quantified parameters; C7 sugars, D-mannoheptulose and perseitol, however, the data for C7 sugars was not shown in the current study as their predictive values were not significant (p > .05) in the multilinear regression. The simple linear regressions of the relationship between the OC and DM are presented for ‘Mendez#1ʹ ( and b) and ‘Hass’ ( and d).
Figure 1. Simple linear relationship between the OC and DM of ‘Mendez#1ʹ (a and b) and ‘Hass’ (c and d). (IN = inside canopy, OUT = outside canopy, red arrows indicate the minimum maturity). n = 9
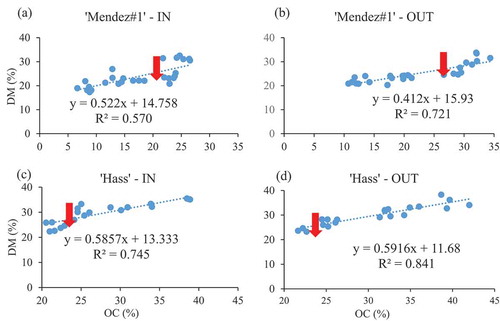
The outcome of the multiple linear regression revealed OC as the most reliable variable to be used to create predictive model of estimating the DM in both cultivars. The successful prediction models of ‘Mendez#1ʹ DM using OC were EquationEq. 1(1)
(1) , with a coefficient of determination (R2 = 0.570) inside canopy and EquationEq. 2
(2)
(2) , with the R2 = 0.721 outside canopy. A successful prediction model of ‘Mendez#1ʹ that was harvested randomly (without considering canopy positions) like in the commercial farm was EquationEq. 3
(3)
(3) , with R2 = 0.61. The successful prediction models of ‘Hass’ DM using OC were EquationEq. 4
(4)
(4) , with R2 = 0.745 inside canopy and EquationEq. 5
(5)
(5) , with R2 = 0.841 outside canopy. A successful prediction model of ‘Hass’ that was harvested randomly (without considering canopy positions) like in the commercial farm was presented in EquationEq. 6
(6)
(6) , with R2 = 0.75.
Where the response variable, y is the DM.
Therefore, from the above equations of the DM, oil content can be predicted by making OC a subject of the formula to give EquationEqs. 7(7)
(7) –Equation12
(12)
(12) .
These models (EquationEqs. 1(1)
(1) –Equation5
(5)
(5) ) suggest that at a given oil content of the fruit harvested inside canopy, outside canopy, or randomly harvested, the DM can be predicted. The coefficient of determination (R2) is defined using EquationEq. 13
(13)
(13) .
Where: SSR defines the sum of squared regression also known as variation explained by the model. SST is known as sum of squared total, it defines the total variation in the data.
The higher R2 is always desirable in a model, as it explains precision, which mostly results from the lower total variation in the data. In the current study, the R2 of 0.57 in the prediction model of ‘Mendez#1ʹ fruit from the inside canopy means the model for the inside canopy is less precise than the model for the outside canopy (R2 = 0.72). The model was generally more precise in predicting the DM of fruit from the outside canopy than the ones from the inside canopy, since in ‘Hass’ it also contained R2 of 0.74 and 0.84, inside and outside canopy, respectively. This could explain the uniformity in the degree of exposure to light of fruit from the outside canopy (Tjur, Citation2009). A lower R2 could be due to the greater variation in the data of ‘Mendez#1ʹ avocado fruit sampled from the inside canopy (Höfle and Pfeifer, Citation2007). The most common source of variation could be the degree of shading, since some fruit from the inside canopy could be close to the leaves that are slightly exposed to the sun thus highly photosynthesizing and translocating more assimilates to hasten fruit maturity (Lahav and Trochoulias, Citation1982; Shezi et al., Citation2019). Furthermore, the light becomes substrates of other biochemical constituents, thus vary the biochemical composure of fruit over time of exposure (Yahia, Citation2017). The sources of variation in the fruit could be genetic, i.e. occur as a result of fruit sampled from different trees with slightly different genetic make-up that yields too low or too high OC. The outcome of evaluation of the models was presented in .
Table 4. Predicted versus actual minimum DM of ‘Mendez#1ʹ and ‘Hass’ avocado fruit harvested from various canopy positions
Prediction of Time to Reach Maturity (DAFB) Using the DM, OC and C7 Sugars
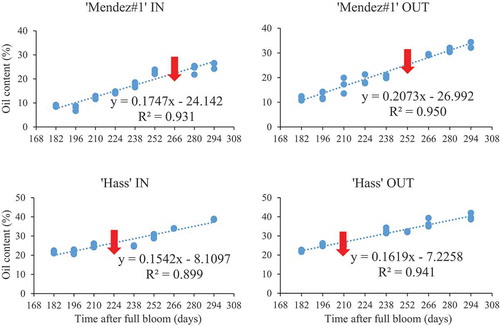
Oil content revealed a strong positive and significant correlation with the DAFB inside canopy (r = 0.96; p < .001) and outside canopy (r = 0.97; p < .001) of ‘Mendez#1ʹ (). A strongly positive and significant correlation was also observed between OC and the time after full bloom (days) in ‘Hass’ inside canopy (r = 0.95; p < .001) and outside canopy (r = 0.97; p < .001). A strong relationship between OC and DAFB suggests that knowledge of time after full bloom (days) can be used to predict the percentage oil content of each cultivar. In ‘Mendez#1ʹ avocado, the regression coefficient (R2) was 0.931 inside canopy and 0.950 outside canopy. In ‘Hass’, for inside and outside canopy position, the R2 was 0.899 and 0.941, respectively ().
Table 5. Pearson’s correlation coefficients (r) describing the correlations of C7 sugars, oil content and dry matter with time after full bloom (days) or DAFB of ‘Mendez#1ʹ and ‘Hass’ fruit sampled inside and outside tree canopies
Figure 2. Simple linear relationship between oil content and days after full bloom (DAFB) in ‘Mendez#1ʹ and ‘Hass’ avocado fruit. (IN = inside canopy, OUT = outside canopy). n = 9
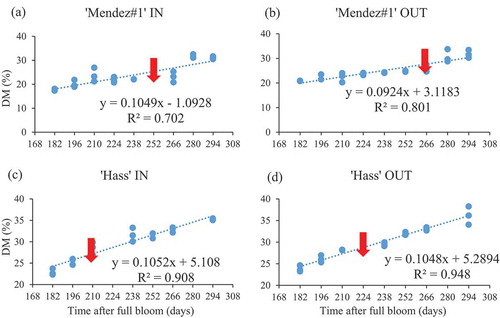
The DM revealed a strong positive and significant correlation with the time after full bloom (days) inside canopy (r = 0.84; p < .001) and outside canopy (r = 0.89; p < .001) of ‘Mendez#1ʹ (). A strong positive and significant correlation was also observed in ‘Hass’ inside canopy (r = 0.95; p < .001) and outside canopy (r = 0.97; p < .001). A strong relationship between DM and DAFB suggests that knowledge of time after full bloom (days) can be used to predict the DM of each cultivar. In ‘Mendez#1ʹ avocado, the regression coefficient (R2) was 0.702 inside canopy and 0.801 outside canopy. In ‘Hass’, the R2 was 0.908 inside canopy and 0.948 outside canopy ().
Figure 3. Simple linear relationship between mesocarp dry matter content and days after full bloom for ‘Mendez#1ʹ and ‘Hass’ avocado fruit (IN = inside canopy, OUT = outside canopy). n = 9
The D-mannoheptulose had a strong negative and significant correlation with the time after full bloom inside canopy (r = −0.91; p < .001) and outside canopy (r = −0.82; p < .001) of ‘Mendez#1ʹ avocado (). For ‘Hass’ avocado fruit, there was also a strong negative correlation between D-mannoheptulose and DAFB inside canopy (r = −0.78; p < .001) and outside canopy (r = −0.89; p < .001). A strong relationship between D-mannoheptulose and DAFB suggests that the number of DAFB can be used to predict the D-mannoheptulose concentration in avocado fruit of known canopy position. Conversely, knowledge of D-mannoheptulose can be used to predict the number of days remaining to reach maturity. However, the predictive values describing the relationship between the D-mannoheptulose in a multivariate analysis were not significant (p > .05) under both canopy positions, indicating that both of them cannot be a part of the predictive model of days to reach maturity. Perseitol was negatively and significantly correlated (p < .001) with the time after full bloom a correlation coefficient (r) of −0.81 inside canopy and −0.83 outside canopy of ‘Mendez#1ʹ avocado. In ‘Hass’ avocado fruit, perseitol also revealed a strong negative and significant correlation with DAFB having correlation coefficients of −0.81 and −0.74 inside and outside canopy positions, respectively. The total C7 sugars had a strong negative and significant correlation with DAFB inside canopy (r = −0.92; p < .001) and outside canopy (r = −0.86; p < .001) in ‘Mendez#1ʹ. A strongly negative and significant correlation was also observed between total C7 sugars and time after full bloom inside canopy (r = −0.79; p < .001) and outside canopy (r = −0.91; p < .001) in ‘Hass’.
Dry Matter Content
The minimum maturity at which fruit ripened without shriveling was reached during 252 and 266 DAFB inside and outside canopy, respectively. In ‘Mendez#1ʹ, the minimum maturity was reached at the DM of 25.56% outside canopy and 25.07% inside canopy. In ‘Hass’, the minimum maturity was reached on 210 DAFB outside canopy and 224 DAFB inside canopy, when the DM was 27.15% and 27.62 for outside and inside canopy, respectively. The regression coefficient (R2) of all the models of DM was between 70% and 80% in ‘Mendez#1ʹ and between 90% and 94% in ‘Hass’, which reveal a high precision of the model in predicting the DM. This suggests that at any day after full bloom, the DM can effortlessly and correctly be predicted, and hence maturity, before actual harvests are done, with <30% risk of incorrectness. This could reduce a waste of fruit samples that are sampled during the series of maturity tests.
The successful prediction models of ‘Mendez#1ʹ DAFB using DM and OC are presented in EquationEq. 14(14)
(14) , with a regression coefficient (R2 = 0.96) inside canopy and EquationEq. 14
(14)
(14) , with the R2 = 0.87 outside canopy. The successful prediction models of ‘Hass’ DAFB using DM and OC are presented in EquationEq. 16
(16)
(16) , with R2 = 0.97 inside canopy and EquationEq. 17
(17)
(17) , with R2 = 0.98 outside canopy. These models suggest that at a given DM and OC of the fruit harvested inside or outside canopy, the time to reach maturity (DAFB) can be predicted.
Where y is time to reach maturity (DAFB).
From the above equations, the oil content can be predicted from EquationEqn. 14(14)
(14) –Equation17
(17)
(17) by making OC a subject of the formula, to give EquationEqs. 18
(18)
(18) –Equation21
(21)
(21) .
Commercially Harvested Fruit (Mixture of Both Canopies)
The minimum maturity of fruit that was harvested randomly without considering canopy positions became the minimum maturity of fruit harvested from the inside canopy. This suggests that harvesting fruit randomly as it is done commercially extends the range of minimum and maximum biochemical markers of maturity thereby increasing the chances of uneven ripening. A simple linear regression for both OC and DM with DAFB on randomly harvested fruit was presented in .
Figure 4. Simple linear relationship between mesocarp dry matter content and oil content with the time after full bloom in ‘Mendez#1ʹ and ‘Hass’ avocado cultivars harvested randomly (without noting canopy positions). n = 9
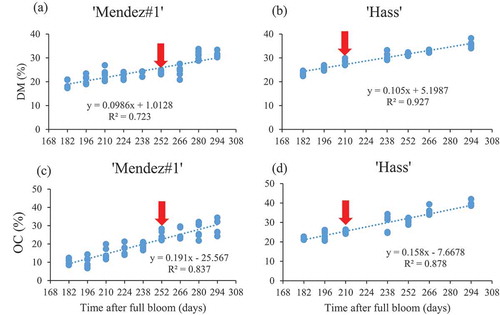
The model for ‘Mendez#1ʹ where fruit was harvested like commercial farmers randomly without considering canopy positions had a predictive linear model EquationEq. 22(22)
(22) , with R2 = 0.88. ‘Hass’ avocado fruit that was randomly harvested, as practiced in commercial orchards, had a predictive model of EquationEq. 23
(23)
(23) with R2 = 0.97. The model was successful in predicting the number of days to reach maturity of both cultivars, with a coefficient of determination of more than 88%. This demonstrates the efficiency of the models, as well as its precision. Furthermore, it defines the degree of variation or distribution of the imported data. The predicted time to maturity was 271 and 238 days for ‘Mendez#1ʹ and ‘Hass’ cultivars, respectively. The actual time to maturity was 259 and 217 days for ‘Mendez#1ʹ and ‘Hass’ cultivars, respectively. Having high predicted value than actual value in both cultivars could be advantageous by giving additional days for allowing fruit to accumulate more oil and DM content for maturity. The findings revealed that the difference between predicted and actual number of days was 12 and 21 for ‘Mendez#1ʹ and ‘Hass’, respectively. Having such values could lead to the recommendation that maturity tests start to be done two weeks before the predicted number of days.
Where y is time to reach maturity (DAFB)
The model test was conducted and presented below ()
Table 6. Predicted versus actual number of DAFB prior to maturity of ‘Mendez#1ʹ and ‘Hass’ fruit harvested at different canopy positions
D-Mannoheptulose
The data were not shown in the current for both C7 sugars hence the simple linear and multiple regression plots were not made for D-mannoheptulose and perseitol, because the C7 sugars did not fit in the DM and OC prediction models. The regression coefficient (R2) which describes the precision of these predictions in ‘Mendez#1ʹ was 0.822 and 0.669 inside and outside canopy, respectively. In ‘Hass’ avocado fruit, the R2 was lower (0.602) inside canopy and higher (0.786) outside canopy. The minimum maturity was reached at the D-mannoheptulose concentrations of 28.26 mg/g outside canopy and 14.23 mg/g inside canopy in ‘Mendez#1ʹ cultivar. In ‘Hass’, the D-mannoheptulose concentration at minimum maturity for outside and inside canopy was 43.33 mg/g and 39.1 mg/g, respectively. The results of the multivariate regression analysis revealed that D-mannoheptulose is strongly correlated to both perseitol and total C7 sugars, thus can represent both.
Perseitol
The minimum maturity of ‘Mendez#1ʹ was achieved at perseitol concentrations of 12.18 and 9. 52 mg/g inside and outside canopy, respectively. In ‘Hass’ avocado, the perseitol concentrations were 14.8 mg/g inside canopy and 13.2 mg/g outside canopy at minimum maturity. The R2 describing the relationship between perseitol and DAFB was higher outside canopy (0.683) and slightly lower inside canopy (0.660). In ‘Hass’, the R2 was higher inside canopy (0.662) and lower outside canopy (0.550). The model was approximately 65% precise, i.e. 35% incorrect for both cultivars. This suggested that as much as perseitol is strongly correlated with the DAFB, it is not precise enough to be used to predict the number of days to reach maturity. Furthermore, the predictive values describing the relationship between the perseitol in a multivariate analysis were not significant (p > .05), indicating that both of them cannot be part of the predictive model for days to reach maturity. This could be due to the fact that the mesocarp tissue of avocado fruit has lower perseitol concentrations (Tesfay et al., Citation2010).
Total C7 Sugars
The findings revealed the fact that the C7 sugars play a critical role in fruit maturation and ripening, even though the role is not positive as common in mesocarp OC and DM content. The C7 sugars have to decrease as fruit grow and develop, unlike oil and DM contents. Several studies have hypothesized that the C7 sugars inhibit avocado fruit on-tree ripening (Blakey et al., Citation2012; Tesfay et al., Citation2010; Tinyane et al., Citation2018). Therefore, in the current study, it was hypothesized that the C7 sugar concentrations have to decrease to below certain threshold without being replenished before an avocado fruit undergo even ripening. This could be the reason why several authors have linked the C7 sugars with the inhibition of ripening on-tree, mainly because these sugars are continuously replenished on-tree, but once detached a fruit ripens (Tesfay et al., Citation2010; Tinyane et al., Citation2018). However, little or no attempts have been made to determine the threshold of the C7 sugar concentrations after which a fruit will ripen evenly. The findings from the current study revealed that avocado fruit can change color to purple-black at any stage of growth (any size), the difference was the degree for ripening which is uneven before minimum maturity therefore a change in color should not be confused with minimum maturity. Before minimum maturity, fruit ripened unevenly and severe shriveling was also noticed. The mesocarp had a rubbery texture with high moisture and water taste. Therefore, the poor quality of fruit that are harvested before reaching a minimum maturity could be attributed the low concentration of ripening enzymes responsible for degrading and softening the mesocarp tissue evenly. Furthermore, the high mesocarp moisture content could be the reason for high transpiration and shriveling occurring in immature fruit because they still contain low oil and DM content.
Conclusion
The simple and multiple linear regression models were successful in predicting the maturity of avocado ‘Mendez#1ʹ and ‘Hass’ fruit. The oil content appeared to be the most reliable parameter for predicting the mesocarp DM due to the strongest positive correlation with it. Furthermore, OC remained the only best fit in the DM model after backward elimination was performed. The DM and OC were the most successful variables with a strongest positive relationship with the number of days to reach maturity. This suggested that these parameters can be used to predict the number of days to reach maturity. “From the current findings, it could be suggested to among the future prospects to evaluate, to what extent does climatic conditions vary the accumulation of DM and OC over time (days)? The sources of variation could be a deviation of the annual mean temperature, rainfall, relative humidity and light from the ones recorded in the current study. This variation also applies to different locations since climate varies with different locations. Therefore, the recommendations from this study suggest the maturity tests be conducted atleast two weeks before the predicted days to maturity. This could counteract a potential variation induced by climatic conditions, while at the same time limiting the number of fruits that could be used if maturity tests were to be just conducted randomly.”
Therefore, a farmer who keeps the records of DAFB can easily predict DM and oil content, before starting the actual maturity tests. The minimum maturity was reached two weeks earlier outside canopy than inside canopy in both cultivars. This suggested that for optimum maturity to be ensured, the maturity tests should be done in fruit from the inside canopy, because the minimum maturity of fruit inside canopy guarantees the maturity of fruit from the outside canopy. The C7 sugars, D-mannoheptulose and perseitol, had non-significant predictive values (p > .05), hence could not fit in the models of predicting avocado maturity. This could be due to the lower concentrations of total C7 sugars in the avocado mesocarp tissue.
Acknowledgments
The College of Agriculture, Engineering and Science of the University of KwaZulu-Natal (UKZN) and the National Research Foundation (NRF) of South Africa are acknowledged for financial support of this study. Westfalia Fruit in Howick, KwaZulu-Natal, South Africa is also acknowledged for providing orchard and fruit for this experiment.
Additional information
Funding
References
- Bill, M., D. Sivakumar, A.K. Thompson, and L. Korsten. 2014. Avocado fruit quality management during the postharvest supply chain. Food Rev. Int. 30:169–202. doi: 10.1080/87559129.2014.907304.
- Binder, H., W. Sauerbrei, and P. Royston. 2013. Comparison between splines and fractional polynomials for multivariable model building with continuous covariates: a simulation study with continuous response. Stat. Med. 32:2262–2277. doi: 10.1002/sim.5639.
- Blakey, R., S. Tesfay, I. Bertling, and J. Bower. 2012. Changes in sugars, total protein, and oil in ‘Hass’ Avocado (Persea americana Mill.) Fruit during ripening. J Hortic Sci Biotech. 87:381–387. doi: 10.1080/14620316.2012.11512880.
- Gamble, J., F.R. Harker, S.R. Jaeger, A. White, C. Bava, M. Beresford, B. Stubbings, M. Wohlers, P.J. Hofman, and R. Marques. 2010. The impact of dry matter, ripeness and internal defects on consumer perceptions of avocado quality and intentions to purchase. Postharvest Biol. Technol. 57:35–43. doi: 10.1016/j.postharvbio.2010.01.001.
- García-Rojas, M., A. Morgan, O. Gudenschwager, S. Zamudio, R. Campos-Vargas, M. González-Agüero, and B.G. Defilippi. 2016. Biosynthesis of fatty acids-derived volatiles in ‘hass’ avocado is modulated by ethylene and storage conditions during ripening. Sci Hortic. 202:91–98. doi: 10.1016/j.scienta.2016.02.024.
- Hernández, I., C. Fuentealba, J.A. Olaeta, S. Lurie, B.G. Defilippi, R. Campos-Vargas, and R. Pedreschi. 2016. Factors associated with postharvest ripening heterogeneity of ‘Hass’ Avocados (Persea Americana Mill). Fruits. 71:259–268. doi: 10.1051/fruits/2016016.
- Höfle, B., and N. Pfeifer. 2007. Correction of laser scanning intensity data: data and model-driven approaches. ISPRS J. Photogramm Remote Sens. 62:415–433. doi: 10.1016/j.isprsjprs.2007.05.008.
- Hosmer, D.W., and S. Lemeshow. 2000. Applied logistic regression. Wiley New York: USA.
- Lahav, E., and T. Trochoulias. 1982. The effect of temperature on growth and dry matter production of avocado plants. Aust. J. Agric. Res. 33:549–558. doi: 10.1071/AR9820549.
- Landahl, S., M.D. Meyer, and L.A. Terry. 2009. Spatial and temporal analysis of textural and biochemical changes of imported avocado cv. hass during fruit ripening. J. Agric. Food Chem. 57:7039–7047. doi: 10.1021/jf803669x.
- Liu, X., P.W. Robinson, M.A. Madore, G.W. Witney, and M.L. Arpaia. 1999. Hass’ avocado carbohydrate fluctuations. Ii. Fruit growth and ripening. J. Am. Soc. Hortic. Sci. 124:676–681. doi: 10.21273/JASHS.124.6.676.
- Magwaza, L.S., and S.Z. Tesfay. 2015. A review of destructive and non-destructive methods for determining avocado fruit maturity. Food Bioprocess Tech. 8:1995–2011. doi: 10.1007/s11947-015-1568-y.
- Meyer, M.D.,Terry, L.A., 2008. Development of a Rapid Method for the Sequential Extraction and Subsequent Quantification of Fatty Acids and Sugars from Avocado Mesocarp Tissue. Journal of Agricultural and Food Chemistry. 56:7439–7445. https://doi.org/10.1021/jf8011322]
- Ncama, K., L.S. Magwaza, C.A. Poblete-Echeverría, H.H. Nieuwoudt, S.Z. Tesfay, and A. Mditshwa. 2018. On-tree indexing of ‘hass’ avocado fruit by non-destructive assessment of pulp dry matter and oil content. Biosyst. Eng. 174:41–49. doi: 10.1016/j.biosystemseng.2018.06.011.
- Olarewaju, O.O., I. Bertling, and L.S. Magwaza. 2016. Non-destructive evaluation of avocado fruit maturity using near infrared spectroscopy and pls regression models. Sci Hortic. 199:229–236. doi: 10.1016/j.scienta.2015.12.047.
- Pedreschi, R., P. Muñoz, P. Robledo, C. Becerra, B.G. Defilippi, H. Van Eekelen, R. Mumm, E. Westra, and R.C. De Vos. 2014. Metabolomics analysis of postharvest ripening heterogeneity of ‘hass’ avocadoes. Postharvest Biol. Technol. 92:172–179. doi: 10.1016/j.postharvbio.2014.01.024.
- Shezi, S., L.S. Magwaza, J. Mashilo, S.Z. Tesfay, and A. Mditshwa. 2019. Photosynthetic efficiency and relationship to mesocarp dry matter Content of ‘Mendez#1ʹavocado (Persea americana Mill.) Fruit in a cool subtropical climate. Sci Hortic. 253:209–216. doi: 10.1016/j.scienta.2019.04.048.
- Tesfay, S., I. Bertling, and J. Bower. 2010. Anti-oxidant levels in various tissues during the maturation of ‘Hass’ Avocado (Persea americana Mill.). J Hortic Sci Biotech. 85:106–112. doi: 10.1080/14620316.2010.11512639.
- Tesfay, S.Z. 2010.Special carbohydrates of avocado: their function as’ sources of energy and anti-Oxidants. PhD Thesis. Scottsville, South Africa: Univesity of KwaZulu-Natal.
- Tinyane, P.P., P. Soundy, and D. Sivakumar. 2018. Growing ‘hass’ avocado fruit under different coloured shade netting improves the marketable yield and affects fruit ripening. Sci Hortic. 230:43–49. doi: 10.1016/j.scienta.2017.11.020.
- Tjur, T. 2009. Coefficients of determination in logistic regression models—a new proposal: the coefficient of discrimination. Am. Stat. 63:366–372. doi: 10.1198/tast.2009.08210.
- Woolf, A., C. Clark, E. Terander, V. Phetsomphou, R. Hofshi, M.L. Arpaia, D. Boreham, M. Wong, and A. White 2003. Measuring Avocado Maturity; Ongoing Developments. The Orchardist, 40–45. http://www.avocadosource.com/Journals/Orchardist/woolfallan2003b.pdf
- Yahia, E.M. 2017. Fruit and Vegetable Phytochemicals: Chemistry and Human Health, 2 Volumes. John Wiley & Sons.
- Yahia, E.M., J. De Jesús Ornelas-Paz, T. Emanuelli, E. Jacob-Lopes, L.Q. Zepka, and B. Cervantes-Paz. 2017. Chemistry, stability, and biological actions of carotenoids. Fruit Veg. Phytochem. 2:285. doi: 10.1002/9781119158042.ch15.