
 ?Mathematical formulae have been encoded as MathML and are displayed in this HTML version using MathJax in order to improve their display. Uncheck the box to turn MathJax off. This feature requires Javascript. Click on a formula to zoom.
ABSTRACT
While plums are widely touted for their health benefits, there is little data available on the levels of beneficial anthocyanins and other antioxidative compounds found in commercial Australian plums. As such, this study aims to provide context data on the typical levels and variation in plums available to consumers. Six commercial plum varieties were sourced from Central Queensland grocery stores, including two varieties developed and grown exclusively in Australia – Croc Egg and “King Midas” yellow plums – as well as four varieties grown both in Australia and internationally: black, Dapple Dandy, red and sugar plums. These were analyzed for antioxidants, phenolics, anthocyanins and mineral contents. Significant differences between varieties were observed in the levels of total phenolics (65–160 mg gallic acid equivalents 100 g−1 on a fresh weight basis), antioxidants (cupric reducing antioxidant potential of 174–542 mg Trolox equivalents 100 g−1) and anthocyanins (0.3–21.5 mg cyanidin-3-glucoside equivalents 100 g−1), as well as in the flavonols quercetin (0.02–0.15 mg 100 g−1) and quercetin-3-glucoside (0.21–2.87 mg 100 g−1). Mid-infrared attenuated total reflectance (MIR-ATR) spectroscopy combined with principal component analysis could separate varieties based on their phytochemical composition. The findings suggest that commercially available Australian plums contain similar levels of health-benefitting compounds to those found internationally, although the levels of these compounds depend strongly on the considered variety.
Introduction
Plums (Prunus domestica and P. salicina) are often touted as functional foods, due to their reported anti-inflammatory, antiallergic and antioxidative properties (Igwe and Charlton, Citation2016). The premise of this belief is based on the high levels of phenolic and other antioxidant compounds found in plums, predominantly anthocyanins (González-Flores et al., Citation2011; Stacewicz-Sapuntzakis et al., Citation2001). The main anthocyanin present in plums – cyanidin-3-glucoside (Fanning et al., Citation2014; Netzel et al., Citation2012a) – is reported to possess a multitude of beneficial health effects, including scavenging free radicals, protecting against oxidative DNA damage, preventing inflammation, and anti-diabetic and anti-neurodegenerative activity (Galvano et al., Citation2007). These functions are believed to be derived from biotransformed metabolites produced by the body rather than the native anthocyanin compounds per se (Fanning et al., Citation2014; Netzel et al., Citation2012a, Citation2012b). As such, measurement of the total anthocyanin content allows for prediction of the food’s expected bioactivity when consumed.
Although most studies on the bioactivity of plums have been conducted using cell lines or animal models (Igwe and Charlton, Citation2016), fresh plums and plum juice have been shown to improve the antioxidant activity of human plasma and urine (González-Flores et al., Citation2011; Ko et al., Citation2005), reduce oxidative stress (Netzel et al., Citation2012b; Santhakumar et al., Citation2015a), lower blood pressure (Igwe et al., Citation2017), and improve the thrombic properties of blood, including reducing platelet aggregation (Santhakumar et al., Citation2015a, Citation2015b). Increased metabolite levels of melatonin have also been observed in the plasma (González-Flores et al., Citation2011). Loss of melatonin production is associated with aging (Reiter et al., Citation2002), leading to the speculation that increasing melatonin levels through increasing plum consumption may potentially slow the aging process. Other research has suggested that the working memory of aged rats increases when fed plum juice containing high levels of phenolics, including anthocyanins (Shukitt-Hale et al., Citation2009). However, similar clinical trials in humans have not shown any significant effect on cognitive function to date (Igwe et al., Citation2017).
Although further controlled clinical trials need to be conducted, consuming plums appears to provide several positive health outcomes. However, due to the high inter-varietal genetic diversity of plums (Ahmad et al., Citation2004), there is a high variability in the phytochemical and antioxidative composition between different plum varieties (Cisneros-Zevallos et al., Citation2005; Kim et al., Citation2003a, Citation2003b; Rupasinghe et al., Citation2006), making it difficult to compare results between different trials. Some plum varieties, such as Queen Garnet, are reported to have anthocyanin contents of up to 277 mg 100 g−1 of fruit (Fanning et al., Citation2013), and are thus more likely to provide the aforementioned beneficial health effects. On the other hand, the anthocyanin contents of most common plum varieties are much lower, ranging between 5 and 173 mg 100 g−1 (Fanning et al., Citation2014). Given increasing interest in concept of functional foods (Englberger et al., Citation2006), this can potentially make the anthocyanin and antioxidant content of a particular plum variety an important factor in the purchasing decision of health-conscious consumers.
Another important facet of nutritional composition is the mineral content. Plums provide a source of important minerals, including calcium (Lister et al., Citation2007), magnesium and potassium (Birwal et al., Citation2017). Although there have been many global studies on the nutritional and antioxidant content of plums, those on Australian-grown plums are somewhat scarcer. This may be partly due to Australia’s relatively low production of plums, ranked 42nd worldwide in 2017 (FAO, Citation2019). Wills et al. (Citation1983) reported the nutritional and mineral contents of six Australian plum varieties, although they did not measure their antioxidant or anthocyanin content. Most recent studies on the antioxidant and anthocyanin contents of Australian plums have formed part of breeding trials of specific varieties developed to contain high anthocyanin levels (Fanning et al., Citation2013, Citation2014), rather than including those varieties which are commonly available and consumed by the general public.
An emerging technique that can provide useful information about the macromolecular composition of food such as fruits is mid-infrared (MIR) spectroscopy, which has become an established and widely adopted method for rapid and reliable testing of plant material (Gordon et al., Citation2019). Naturally, the technique has been extended to fruit attributes. For example, MIR spectroscopy has been applied to study fruit cell wall composition (Canteri et al., Citation2019), assess microbial presence (Adiani et al., Citation2018), develop a greater understanding of the ripening process (González-Cabrera et al., Citation2018) and even examine fruit extracts for possible adulteration (Miaw et al., Citation2018). Other authors have reviewed these studies in greater detail (Roberts et al., Citation2018). However, the use of this technology in the plum industry has been limited (Bureau et al., Citation2019); hence exploratory work on the use of MIR spectroscopy in plums was conducted in this study.
Accordingly, the aim of this work was to evaluate and characterize some of the typical variance in the phenolic, anthocyanin, antioxidant and mineral composition and content in plums available to Australian consumers. Based on the results of international studies (Cisneros-Zevallos et al., Citation2005; Kim et al., Citation2003a, Citation2003b; Rupasinghe et al., Citation2006), it was predicted that significant variation in these nutritional parameters would be found between different plum varieties. This information is hoped to address the current lack of context data for these parameters in Australian plums.
Materials and Methods
Plum Samples and Reagents
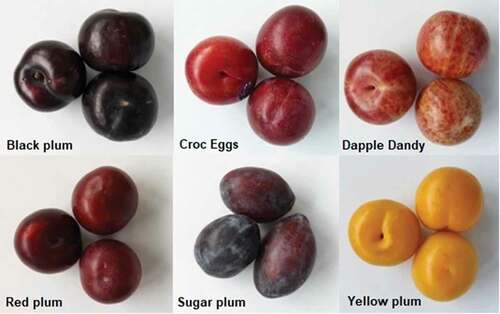
Six commercial plum varieties were purchased from local grocery stores in Yeppoon, Central Queensland: black, Croc Egg, Dapple Dandy, red, sugar and yellow plums (). It should be noted that “Dapple Dandy” is reportedly a cross between a plum and an apricot, hence is marketed as a pluot® (Ahmad et al., Citation2004), although for simplicity it is referred to as a plum throughout this study. While the majority of these varieties are grown internationally, the varieties “Croc Egg” and “King Midas” are only grown in Australia (Hogan, Citation2017; Padman, Citation2019). All plum varieties studied here were of the European variety, which is round in shape and contains higher levels of soluble solids. In contrast, the Japanese plum varieties tend to be oval in shape, have a juicier texture and contain a higher anthocyanin content (Fanning et al., Citation2014).
Figure 1. The six plum varieties. From left to right, top to bottom: black plum, Croc Eggs plum, Dapple Dandy pluot, red plum, sugar plum, yellow plum
All reagents used were of analytical grade. Hydrochloric acid (HCl) was purchased from Chem Supply; all other reagents were purchased from Sigma-Aldrich Australia. Unless otherwise specified, all dilutions and assay preparations were made using Milli-Q water. All solutions were stored in darkness at 4°C. Stable reagents (e.g. sodium carbonate (Na2CO3) solution) were prepared up to a week beforehand; non-stable reagents (e.g. neocuproine (C14H12N2) solution) were prepared fresh each day.
Extraction of Polar Bioactive Compounds
Between one to five fruit of each variety were quartered and pitted, with the flesh and skin homogenized (Anko Mini Blender) for approximately 30 secs on the highest setting. For each variety, triplicate extracts were prepared from the corresponding homogenate. To extract the polar compounds, approximately 5 g of plum homogenate was combined with 45 ml of 90% MeOH (v/v), following the method previously reported by our laboratory (Johnson et al., Citation2020a, Citation2019, Citation2020b). After vortexing briefly, the tube contents were mixed for 60 mins using an end-over-end shaker (Ratek RM4) operating at 50 rpm. Samples were centrifuged at 1000 g for 10 mins using a Heraeus Multifuge (ThermoFisher Scientific) prior to collecting the supernatant. The extraction was repeated with another 45 ml of 90% MeOH, with end-over-end mixing for 20 mins to recover any remaining compounds. Combined supernatants were vacuum filtered with 0.45 μm Advantec® filter paper and volumetrically made up to 100 mL with 90% MeOH. Extracts were stored in the dark at 4°C and all phytochemical assays were performed in the same week.
Total Antioxidant Capacity – FRAP and CUPRAC
To estimate the total antioxidant capacity (TAC) of the extracts, two methods for measuring total antioxidant capacity were utilized (Apak et al., Citation2013; Bartosińska et al., Citation2016) – the ferric reducing antioxidant power (FRAP) assay of Benzie and Strain (Citation1996) and the cupric reducing antioxidant capacity (CUPRAC) method of Apak et al. (Citation2013), with slight modifications as reported by Johnson et al. (Citation2020a).
The FRAP assay was conducted by combining 3 mL of FRAP reagent (comprising 300 mM acetate buffer at pH 3.56, 20 mM ferric chloride (FeCl3) and 10 mM TPTZ (2,4,6-Tri(2-pyridyl)-s-triazine) [made up in 40 mM HCl], in the ratio 10:1:1, respectively) with 100 µL of sample extract and briefly vortexing. After incubation in darkness at 37°C for 4 mins, the absorbance at 593 nm was measured (Thermo Scientific Genesys 10S UV-Vis) and used to derive the FRAP as a function of the equivalent absorbance of Trolox (6-hydroxy-2,5,7,8-tetramethylchroman-2-carboxylic acid), a vitamin E analogue (Scott et al., Citation1974). Trolox standards were prepared in ethanol solution in the range 10 to 175 mg L−1 (R2 = 0.9999).
The CUPRAC assay was performed by combining 1 mL of 10 mM copper chloride (CuCl2), 1 mL of 1 M ammonium acetate (NH4CH3COO), 1 mL of Milli-Q water and 1 mL of freshly prepared 7.5 mM neocuproine ethanol solution with 100 µL of sample extract, and vortexing briefly. After incubation in darkness at 50°C for 30 mins, the resulting absorbance at 450 nm was used to derive the CUPRAC, also using Trolox ethanol solutions as a standard (range 50–600 mg L−1; R2 = 0.9986). Data for both FRAP and CUPRAC are expressed in terms of Trolox equivalents (TE).
Total Phenolics
Total phenolics (TP) were measured through a modification of the Folin-Ciocalteu method of Singleton and Rossi (Citation1965). Two ml of 1:10 diluted Folin-Ciocalteu reagent was combined with 400 µL of the sample extract and incubated in darkness at room temperature for 10 mins. Subsequently, 2 ml of 7.5% w/v sodium carbonate (Na2CO3) was added and the solution briefly vortexed, before being incubated in darkness at 40°C for 30 mins. The absorbance at 760 nm was measured and used to derive the total phenolic content as a function of the equivalent absorbance of gallic acid (C6H2(OH)3COOH) in the range 20 to 120 mg L−1 (R2 = 0.9968).
Total Monomeric Anthocyanins
Total monomeric anthocyanins (TMA) were determined using a modification of the pH differential method described by Giusti and Wrolstad (Citation2001). Buffer solutions at pH 1 and 4.5 were prepared with 0.025 M potassium chloride (KCl) and 0.4 M sodium acetate (NaCH3COO), respectively. The sample extract (200 μL) was combined with 1.8 mL of buffer and mixed. After equilibrating at room temperature in the darkness for 15 mins, the absorbance at 510 and 700 nm was read using a spectrophotometer (Johnson et al., Citation2020c). The monomeric anthocyanin concentration was calculated using the following formula (Giusti and Wrolstad, Citation2001):
The molecular weight (449.38 g mol−1) and molar extinction coefficient (26,900 M−1 cm−1) of cyanidin-3-glucoside (cyd-3-glu) were used, as it is typically the most abundant anthocyanin present in plums (Horbowicz et al., Citation2008; Wang et al., Citation2012).
All results were expressed as mg of equivalent standard per 100 g of fresh plum sample, in order to ensure the results were directly applicable to the fruit as consumed.
HPLC Analysis
Following the determination of the ‘total’ levels of bioactive constituents outlined above (TAC, TP, TMA), the remaining volume of the methanol extract was measured and concentrated to a semi-solid consistency using a rotary evaporator (water bath temperature limited to 27°C), before being reconstituted with 2 mL of 100% MeOH. Each of the triplicate extracts was concentrated and analyzed individually. Following syringe filtering (0.2 µm regenerated cellulose, MiniSart RC4 brand), the concentrated extracts were analyzed for anthocyanins and selected flavonols using high performance liquid chromatography (HPLC).
The HPLC analysis was conducted on an Agilent 1100 system, comprising a G1313A autosampler, G1322A vacuum degasser, G1311A quaternary pump, G1316A thermostatted column compartment and G1365B multi-wavelength detector module. A reversed phase C18 column was used (Agilent Eclipse XDB-C18; 150 × 4.6 mm; 5 µm pore size) with an injection volume of 5 µL. The mobile phase comprised 0.01 M phosphoric acid (H3PO4) and methanol at a flow rate of 1 mL/min, with a gradient beginning at 5% methanol (0 mins), ramping to reach 25% at 15 mins, 40% at 25 mins, 50% at 30 mins and 100% at 35 mins (Johnson et al., Citation2020c). The total run time was 40 mins, with a post-run flush time of 10 mins. The detection wavelength was set at 520 nm for anthocyanins and 250 nm for quercetin and quercetin-3-glucoside. The typical error of the HPLC analysis, as measured by triplicate injections of quercetin, was <2.5%.
Minerals Determination
Approximately 1.0 g of plum flesh from each variety was homogenized in 50 mL of Milli-Q water and 1 mL of 65% nitric acid (HNO3) and digested on a hotplate at 110°C until reduced to approximately 20 mL volume. The sample was then made volumetrically made back up to 50 mL volume (using Milli-Q water) and filtered (0.45 µm). Acid digestion was performed in duplicate for each variety. The mineral contents (Ca, Cu, Fe, K, Mg, Mn, Na, Zn) in the resultant digests were quantified using a calibrated Agilent atomic absorption spectrometer system (240FS AA).
Mid-infrared Attenuated Total Reflectance (MIR-ATR) Spectroscopy
A Bruker Alpha Fourier transform infrared spectrophotometer (Bruker Optics Gmbh, Ettlingen, Germany) fitted with a platinum diamond ATR single reflection module was used for the mid-infrared (MIR) spectroscopy analysis. Cross-contamination of samples was minimized by cleaning and drying the platform with isopropyl alcohol and laboratory Kimwipes® between samples (Gordon et al., Citation2019). MIR spectra between 4000 and 400 cm−1 were recorded using the OPUS software version 7.5 (Bruker Optics Gmbh, Ettlingen, Germany) as the average of 24 scans at a resolution of 4 cm−1. MIR spectra were obtained in triplicate from the plum exteriors (on the skin), blended homogenates (purees) and methanolic extracts.
For the skins and homogenates, air was used as a reference background, while 90% MeOH was used as a reference for the analysis of the methanolic extracts. The background measurement was performed prior to analysis. Fruit skins were pressed firmly against the reflection interface, while the homogenate was placed directly on the reflection module. Approximately 100 μL of methanolic extract was used to cover the reflection interface.
Statistical Analysis
Data on bioactive compounds were analyzed in IBM SPSS (version 25). Correlograms were created in R using the ggplot2 package. The MIR spectra were analyzed with the Unscrambler X software version 10.5 (Camo ASA, Oslo, Norway), including basic chemometric analyses such as principal component analysis (PCA) and partial least squares discriminant analysis (PLS-DA). For all analyses except identification of spectral peaks, the spectra were pre-processed to the second derivative using a Savitzky-Golay algorithm at a polynomial number of 2 and a smoothing window of 41 points (Savitzky and Golay, Citation1964), based on previous studies (Gordon et al., Citation2019; Wold et al., Citation2001). Using the second derivative removes spectral variations in the baseline and slope (Savitzky and Golay, Citation1964), minimizing non-compositional differences due to variables such as the pressure and contact with the reflection module.
Results
Antioxidant Activity, Phenolic and Monomeric Anthocyanin Content
The total antioxidant capacity (TAC) of the plum extracts are provided in . The FRAP ranged from 63–201 mg 100 g−1 Trolox equivalents (TE), while the CUPRAC ranged between 174–542 mg 100 g−1 TE. There was a significant variation in TAC between varieties in both CUPRAC (one-way ANOVA, F5,12 = 214.671, P < .001) and FRAP (one-way ANOVA, F5,12 = 305.686, P < .001). Post-hoc Tukey testing at α = 0.05 indicated that the black plums and Croc Eggs samples had a significantly higher CUPRAC values than the remaining plum varieties and red plums had significantly lower CUPRAC values than all other varieties. Similarly, all plum varieties except the yellow plum and Dapple Dandy pluot showing significantly different FRAP levels at α = 0.05.
Table 1. Polar bioactive compounds concentrations in the six plum varieties studied
The average total phenolic content of the six plum varieties () ranged between 65–160 mg 100 g−1 gallic acid equivalents (GAE), with black plums containing the highest TP levels and red plums the least. This variation in average total phenolic contents was statistically significant when analyzed by a one-way ANOVA (F5,9 = 269.552, P < .001). The TP content of all plum varieties were statistically different to each other, except for the sugar and yellow plums.
Similarly, the anthocyanin contents ranged broadly from 0.3–21.5 mg 100 g−1 cyanidin-3-glucoside equivalents (). Again, this difference between varieties was statistically significant (one-way ANOVA, F5,12 = 230.702, P < .001). Post-hoc Tukey testing at α = 0.05 showed that the black plums had significantly higher anthocyanin concentrations than all other varieties, followed by the Croc Egg plums. The sugar plums had the lowest anthocyanin content.
HPLC Analysis of Anthocyanins and Selected Phenolics
The HPLC analysis revealed the presence of five different anthocyanins distinguishable by their retention times, in addition to the phenolic flavonoids quercetin and quercetin-3-glucoside (). Based on their relative retention times and previous literature (Piga et al., Citation2003; Tomás-Barberán et al., Citation2001; Usenik et al., Citation2009; Wang et al., Citation2012; Wu and Prior, Citation2005), the first four eluting anthocyanins were tentatively identified as cyanidin-3-galactoside, and cyanidin-3-glucoside, cyanidin-3-rutinoside and peonidin-3-glucoside, respectively. The identity of the last-eluting compound (anthocyanin 5) was established as cyanidin through comparison of its retention time to an authentic standard (Sigma Aldrich Australia). As a standard of cyanidin-3-glucoside was not available, all anthocyanins except cyanidin were quantified as equivalents of malvidin-3-glucoside; cyanidin was quantified as itself.
Table 2. Content of anthocyanins and selected phenolics in the six plum varieties (all values given as mg 100 g−1 FW)
Anthocyanin 1 was only found in the Croc Egg plums, while cyanidin was only found in the red plums. The yellow plums had no detectable anthocyanins, except for very small levels of anthocyanin 4, identified in only one extract replicate. As shown in , the black plums had significantly higher concentrations of anthocyanins 2 and 3 (one-way ANOVA, P < .001 for all), while anthocyanin 4 was not detected in this variety. The Croc Egg plums had significantly higher levels of anthocyanin 4 than all other varieties (one-way ANOVA, P < .001).
As quercetin and its glycosylated derivatives are the major flavonols present in plums (Lombardi-Boccia et al., Citation2004), quercetin and quercetin-3-glucoside were identified and quantified in the samples using authentic standards (Sigma Aldrich Australia). The quercetin contents ranged from 0.02–0.15 mg 100 g−1, while the quercetin-3-glucoside contents were between 0.64–2.87 mg 100 g−1 ().
Mineral Contents
Most mineral concentrations were consistent between varieties, although considerable variations were noted in the copper and sodium content (Supplementary Materials, Table S1). In general, the red plum variety had the highest concentration of all minerals tested, apart from sodium and magnesium. The Croc Eggs plum variety generally showed the lowest level of minerals.
ATR-MIR Spectra – Methanol Extracts
The ATR-MIR spectra obtained from the plum skins, flesh homogenates, and methanolic extracts are shown in . The MIR spectra from the methanolic extracts showed small but distinct deviations from the spectral baseline obtained from 90% MeOH, particularly between 3640–3020 cm−1, as well as at 3000–2950 cm−1 and 1700–1570 cm−1.
Figure 2. The raw MIR spectra taken from the plum flesh homogenates, plum skin, and methanolic plum extracts
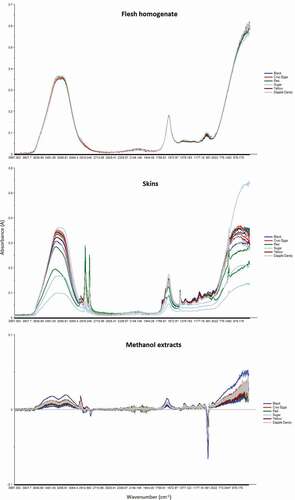
The wide dual peak between 3640 and 3020 cm−1 is likely due to the O-H stretching vibrations of water molecules (Gnanasambandam and Proctor, Citation2000; Lai et al., Citation2010), suggesting slightly increased water levels in the plum extracts, likely due to the constituent water present in the plum matrix. The moderate-sized peak at 3000–2950 cm−1 is characteristic of methyl groups and is a consequence of the asymmetrical CH3 stretch (Falk and Whalley, Citation1961), suggesting the presence of a considerable number of methyl-containing compounds in the plum homogenates. Conversely, the dip centered at 2830 cm−1 is due to decreased symmetrical CH3 stretching from the methanol blank (Falk and Whalley, Citation1961).
The small peak at 1700–1570 cm−1 may be attributed to increased absorption by the OH bend of water (Libnau et al., Citation1994). Neither water nor methanol show any peaks between 1400 and 1060 cm−1; hence the number of small peaks between these wavelengths may be due to soluble sugars or organic acids. The sharp dip around 1025 cm−1, corresponding to CO stretch (Falk and Whalley, Citation1961), is due to decreased methanol concentrations in the plum extracts.
ATR-MIR Spectra – Plum Homogenates
The spectra from the flesh homogenate was almost identical to that of pure water (Libnau et al., Citation1994), with major peaks between 3700–2900 cm−1 and 1700–1560 cm−1 (). Overall, the spectra from the homogenates was very similar to that found by Bureau et al. (Citation2013) for peach homogenates and Di Egidio et al. (Citation2009) for pineapple flesh.
The largest peak was between 3700–2900 cm−1, corresponding to the OH stretch of constitutive water present in the intracellular and extracellular portions of the plum homogenate (Gnanasambandam and Proctor, Citation2000). The second large peak occurred between 1700–1560 cm−1, corresponding to the OH bend of water (Libnau et al., Citation1994).
The peak at 1120–980 cm−1 is not found in water (Libnau et al., Citation1994) and was also observed by Bureau et al. (Citation2013) in their study of peach homogenates. In similar matrices, this absorbance band has been attributed to constituent sugars and acids, such as sucrose, glucose, fructose, citric acid and malic acid (Bureau et al., Citation2013, Citation2009). Furthermore, Bureau et al. (Citation2013) noted a considerable effect of genotypic variation (between peach varieties) in the absorbance throughout this band.
ATR-MIR Spectra – Plum Skins
The spectra obtained from the plum skins showed more chemical information in terms of the number of peaks present, with major peaks at 3700–3020 cm−1, 2930–2900 cm−1, 2860–2840 cm−1, 1740–1570 cm−1, 1740–1570 cm−1 and 730–710 cm−1, with a number of minor peaks between 1410–920 cm−1 (). The greatest degree of variation was found in the region corresponding to the OH stretch of water, between 3700 and 3020 cm−1 (Libnau et al., Citation1994). In most samples, this peak was asymmetrical, with tapering observed at the lower wavelengths (toward the right of the figure). A similar pronounced tapering of this peak was found for water at 2°C by Libnau et al. (Citation1994), due to temperature-dependent changes in the maximal absorption wavelength of the OH stretch (Libnau et al., Citation1994). The plums were taken directly out of storage at refrigerator temperature (4°C) before the MIR analysis of the skin took place, explaining the presence of the taper in this study.
Two sharp peaks were noted at 2930–2900 cm−1 and 2860–2840 cm−1; neither of which is present in the spectra of pure water (Libnau et al., Citation1994; Maréchal, Citation1991). Some of the absorbance in the latter peak may be due to anthocyanins such as cyanidin, which shows absorbance at around 2860 cm−1 (Hsia et al., Citation1965; Marković et al., Citation2005). However, given that Ruiz et al. (Citation2008) were unable to successfully predict the carotenoid content of apricots using MIR spectra, it appears unlikely that peaks of the observed amplitude (visible to the naked eye) would be due to anthocyanins, provided the relatively low concentration of these compounds found in the plum varieties studied. A single peak at 2920 cm−1 in peach skins was attributed to C-H stretch of CH2 groups by Chatjigakis et al. (Citation1998). The second peak between 2860–2840 cm−1 was observed by Domínguez-Martínez et al. (Citation2014) in ground capsicum samples, albeit with a smaller amplitude; however, its etiology was not discussed. However, dual peaks in this region were reported by McKean et al. (Citation1973) for compounds containing non-equivalent hydrogen atoms. It is hypothesized that it may be due to the C-H stretch in another functional group (McKean et al., Citation1973), possibly aldehydes. Alternatively, it may be a case of Fermi resonance of the C-H bonds (Shurvell, Citation2006).
In addition to the OH bend of water between 1740 and 1570 cm−1 (Libnau et al., Citation1994; Maréchal, Citation1991) and a sharp peak at 1480–1455 cm−1, a number of smaller peaks were also present between 1410–920 cm−1, centered at approximately 1380, 1250, 1165, 1035 and 950 cm−1. In other stone fruit matrices, bands between 1500–1200 cm−1 have been attributed to the deformation of -CH2 and angular deformation of C-C-H and H-C-O (Bureau et al., Citation2009; Hineno, Citation1977). Bands between 1200–900 cm−1 were attributed to the stretching of C-C and C-O bonds (Bureau et al., Citation2009). Wavelengths of 1369 and 1227 cm−1 have been found to be highly correlated to the total acidity and citric acid content in tomatoes (Ścibisz et al., Citation2011); hence may explain the peaks at 1380 and 1250 cm−1. The peak centered at 1035 cm−1 may be due to glucose (Ścibisz et al., Citation2011; Sivakesava and Irudayaraj, Citation2000) or other constituent carbohydrates such as cellulose or galactan (Kacurakova et al., Citation2000).
Finally, another sharp peak was observed on the rightmost shoulder of the spectra, between 730 and 710 cm−1. This may possibly be due to C-H bend in monosubstituted aromatic rings (Shurvell, Citation2006). Some variation in the amplitude of the peak absorbances may be due to inherent variation in the force with which the plum was applied against the reflectance module; hence necessitating the use of the second derivative in spectral analyses such as principal component analysis.
Discussion
Antioxidant Capacity, Phenolic Content and Anthocyanins
The TAC content obtained using the CUPRAC and FRAP assays showed a significant positive linear correlation with each other (r4 = 0.970, P < .01). Linear regression analysis gave a regression formula of: CUPRAC (mg TE 100 g−1 FW) = 2.83 × FRAP (mg TE 100 g−1 FW) – 15.21 (F1,4 = 64.575, P < .01; R2 = 0.942). This was expected, as both assays are to measure the total level of antioxidants in the sample (Apak et al., Citation2013). The higher values from the CUPRAC assay are due to differing redox potentials between the reagents (Apak et al., Citation2013; Bartosińska et al., Citation2016). Guo et al. (Citation2003) found a FRAP content of 108 mg FeSO4 equivalents 100 g−1 in an unnamed Chinese plum cultivar, while the values found in plums from Luxembourg ranged from 89–443 mg FeSO4 equivalents 100 g−1 (Kaulmann et al., Citation2014). However, these values were not reported in terms of Trolox equivalents; hence cannot be directly compared to the values found in the present work. The FRAP content of Norwegian plums was approximately 500 mg TE 100 g−1 (Vangdal and Slimestad, Citation2006), while that of another species in the plum genus, Prunus cerasifera (Myrobalan plum), ranged from 280–1122 mg TE 100 g−1 (Wang et al., Citation2012). No previous work appears to have been conducted on Prunus domestica using the CUPRAC assay; however, Güçlü et al. (Citation2006) found slightly lower CUPRAC values between 67–106 mg TE 100 g−1 in five Turkish apricot (Prunus armeniaca) cultivars.
The total phenolic contents determined here were all lower than the range of 174–375 mg GAE 100 g−1 FW determined by Kim et al. (Citation2003b) for 6 New York grown plum cultivars. This may be partly due to the different extraction protocol used by Kim et al. (Citation2003b) (80% MeOH with ultrasound-assisted extraction), which may extract more phenols than shaking-based methods (Aboshora et al., Citation2014; Musa et al., Citation2011). The total phenolic content showed a significant positive linear correlation with the FRAP values (r4 = 0.985, P < .001), as well as with the CUPRAC values (r4 = 0.990, P < .001). This agrees with previous work by Gil et al. (Citation2002), who found a significant linear correlation between TAC (measured using the DPPH assay) and phenolic concentrations in a range of Californian plum varieties, as well as agreeing with correlations between TAC and TP in other matrices (Johnson et al., Citation2020a, Citation2020d). Linear regression analysis suggested that TP content could be approximated using the formula: TP (mg GAE 100 g−1 FW) = 0.716 × FRAP (mg TE 100 g−1 FW) + 20.97 (F1,4 = 131.965, P < .001; R2 = 0.971). The phenolic content of plums is of key interest to researchers and consumers responsible of health benefits in osteoporosis-prone populations (Arjmandi et al., Citation2002; Lister et al., Citation2007). Hence for future screening programs, measurement of the TAC could be used as a proxy for estimating total phenolic content in plums, or vice versa.
Most of the plum varieties studied in this work had lower anthocyanin levels compared to the average of 17 mg 100 g−1 found by González-Flores et al. (Citation2011), who quantified anthocyanins using HPLC on the Japanese plum variety ‘Crimson Globe’ (Prunus salicina). Compared to the more common European plums, which were used in this study, Japanese plums typically have higher anthocyanin concentrations (Fanning et al., Citation2014), which is the most likely explanation for this difference.
The total monomeric anthocyanin (TMA) content of the plum samples showed a moderate positive linear correlation with the measured FRAP (r4 = 0.834, P < .05). Linear regression analysis suggested that TMA content could be approximated using the formula: TMA = 0.127 × FRAP – 9.16 (F1,4 = 9.134, P < .05; R2 = 0.695). However, the RMSEP (root mean square error of prediction) of this regression formula was quite high (RMSEP = 3.857), indicating that the TMA content of the plums cannot be accurately predicted from the FRAP alone. The linear correlation between TMA content and CUPRAC was not statistically significant (r4 = 0.810, P > .05), and TMA could not be accurately predicted from CUPRAC values using a linear model (F1,4 = 7.613, P > .05; R2 = 0.656).
Individual Anthocyanins and Selected Phenolics
As previously mentioned, five different anthocyanins were detected across the six plum varieties. Distinct differences were observed in the anthocyanin profiles between varieties, as well as in their absolute concentrations (). For example, the black plum variety was dominated by the presence of anthocyanin 2, whilst levels of anthocyanin 3 were highest in sugar plums. The yellow plums had no anthocyanins detected using the HPLC method, agreeing with the very minor levels found using the pH-differential method. For comparison to the HPLC anthocyanins sums, the levels of TMA (as measured through the pH-differential method) were calculated using the molar absorptivity and molecular weight of malvidin-3-glucoside. The two methods of anthocyanin measurement were strongly positively correlated (Pearson linear correlation; r4 = 0.961, P < .001), with values obtained by the pH-differential method an average of 21% higher than those via HPLC.
Figure 3. HPLC chromatogram of the six plum varieties
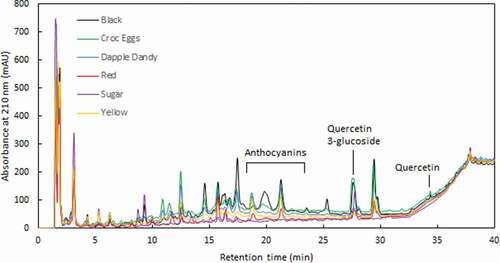
The levels of quercetin-3-glucoside (0.21–2.87 mg 100 g−1 FW) found here were similar to those found in plums from New York (0–3.7 mg 100 g−1 FW) (Chun et al., Citation2003; Kim et al., Citation2003a). Quercetin aglycone was detected but not quantified in plums by Williams and Wender (Citation1953), but not detected by Sultana and Anwar (Citation2008), whose limit of detection was ~0.025 mg quercetin 100 g−1 sample. This agreed with the results found here, where the highest concentration of quercetin was 0.015 mg 100 g−1. Other literature reporting much higher concentrations of quercetin have studied the fruit after the hydrolysis of quercetin glycosides (e.g. Lombardi-Boccia et al., Citation2004); hence these values include quercetin found in glycosylated forms such as quercetin glucoside and quercetin rutinoside. We believe that this may be the first study to quantify levels of quercetin in plums, as previous in-depth studies on plum phenolics have not reported any quercetin concentrations (e.g. Donovan et al., Citation1998; Fang et al., Citation2002).
Varietal Differences in Bioactive Compounds
Overall, the black plum variety showed the highest level of bioactive compounds, closely followed by the Croc Egg variety. This observation was supported by Two-Step Cluster Analysis on all the HPLC data collected, which identified black and Croc Egg plums belonging to one cluster, with all other varieties classified in another cluster.
While the Croc Egg plums showed only slightly lower TAC and TP levels, the level of anthocyanins was much lower than in black plums. This is unsurprising, given that the majority of anthocyanins are concentrated in the skin (Tomás-Barberán et al., Citation2001), hence contributing to the dark skin color of black plums. Whilst red plums had the lowest TAC and TP levels, yellow plums had the lowest anthocyanin concentrations. All remaining plum varieties had moderate TAC, TP and TMA levels. Although it is evident from the data obtained that the total antioxidant and phenolic content did not appear to be directly related to the physical color intensity of the fruit, the black plum variety consistently showed higher antioxidant levels.
The presence of low to negligible anthocyanins in the yellow plum variety is consistent with previous work, which found that yellow-colored stone fruit have lower phenolic and antioxidant levels (Gil et al., Citation2002) and other research demonstrating that the anthocyanin content of grapes correlates strongly with their color (Fernández-López et al., Citation1998). Similarly, the yellow plums had the lowest levels of quercetin and quercetin-3-glucoside of any variety. However, the TAC and TP content was higher in yellow plums compared to red plums (). The results found here, combined with those previously reported in the literature, suggest that whilst it would be acceptable to make a positive correlation between the anthocyanin content and color intensity (i.e. redness) of plums, the same cannot be argued for color intensity and TAC or TP contents.
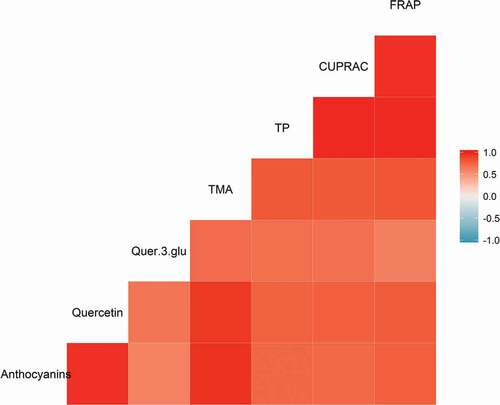
All bioactive compound measurements showed a positive correlation with one another, albeit to varying degrees (). Notably, there was a strong correlation between quercetin and anthocyanin contents, but not between anthocyanin content and quercetin-3-glucoside. Cyanidin and quercetin are formed in the same biosynthetic flavonoid pathway, with dihydroquercetin as a precursor (Jeong et al., Citation2006). Furthermore, the other major anthocyanin present in plums, peonidin, is formed from subsequent modification of cyanidin. Hence increased gene expression of this single metabolic pathway could lead to increased levels of quercetin, cyanidin and peonidin in concert. However, the reduced correlation between anthocyanin and quercetin-3-glucoside content () appears to indicate that the control of the glycosylation rate of quercetin produced is somewhat more independent of the flavonoid synthesis pathway.
Figure 4. Correlogram showing the positive correlations between levels of all bioactive compounds in the plum samples
Mineral Contents
Most of the mineral contents found here were somewhat higher than those reported by Wills et al. (Citation1983) for 6 plum varieties obtained from Sydney markets, in particular the magnesium and sodium contents. They were also slightly higher than those reported by Cunningham et al. (Citation2001) in two varieties of Australian plum (red and yellow fleshed) approximately 20 years ago. In contrast to previous work, significant levels of calcium were not detected, possibly due to the detection limit of the instrument used. The work of Cunningham et al. (Citation2001) found no significant change in mineral contents of Australian plums between 1981 and 2002; however, no further work appears to have been performed since that time. Hence further contemporary investigation into the mineral contents of Australian plums at the retail level is required. In addition, the high levels of copper observed in the red plum variety in this preliminary study bear worth of further study in the future.
ATR-MIR Spectra
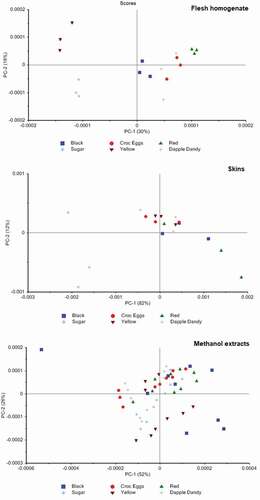
In order to explore trends and inter-relationships within the MIR spectral data, several simple chemometric data analysis techniques were utilized. Principal component analysis (PCA) of the methanolic extracts showed some isolation of the six plum varieties, particularly in diagonal lines across PC1 and PC2 (). This suggests a complex but distinct variation in the macrochemical composition of the plum varieties examined here. Some varieties were tightly clustered (e.g. red plums) while others (e.g. black plums) were widely spread, suggesting greater variation in the macrochemical composition of the plum homogenate used to prepare these extracts. As a proof-of-concept demonstration toward the versatility of this analytical technique, partial least squares discriminant analysis (PLS-DA) models applied individually to the MIR spectra successfully classified all plum varieties with no errors.
Figure 5. Scores plots showing the principal component analysis of the MIR spectra taken from the plum flesh homogenates, plum skin, and methanolic plum extracts. All PCAs were performed on the second derivative of the spectra
Although the sample size was not large enough to explore this in the present study, it is likely that the MIR spectra could be used to predict the TP content, antioxidant capacity (CUPRAC or FRAP) and possibly anthocyanin content of the extracts through the use of chemometric techniques such as partial least squares regression (PLS-R), based on similar previous work in grape extracts (Kwiatkowski et al., Citation2020) and powdered plant matrices (Johnson et al., Citation2020d). If large-scale studies were performed to create a calibrated MIR model, this could allow for the rapid and cost-effective screening for high-antioxidant plums in future breeding programs. The exact concentrations of these bioactive compounds could then be determined in the best performing plum varieties, through traditional ‘wet chemistry’ assays or HPLC analysis.
For the MIR spectra obtained from the plum skin, the first two components of the PCA explained 94% of the variation in the spectra (). Overall, there was little definitive isolation of the plum varieties, with most located around the center of the PCA graph. However, the sugar plums were found on the far left of the graph, with excellent separation from all other plum varieties. Some other varieties, such as the red plums, showed partial separation from the other plum varieties; however, further testing with a greater sample size would be necessary to confirm if complete isolation could be achieved using ATR-MIR. Individual PLS-DA models applied to the plum skin spectra correctly classified all samples.
For the plum homogenate spectra, the first two principal components of the PCA explained only 48% of the spectral variation, although excellent isolation was found for most plum varieties. In particular, the sugar and yellow plums were well separated, while the black and red plums showed some level of separation (). This suggests that there is a clearly detectable difference in the macrochemical composition of these plum varieties, likely due to the varying concentrations of different sugars and organic acids present. Individual PLS-DA models on the plum homogenates correctly classified all plum varieties.
Conclusion
There is a considerable amount of variation in the nutritional content and antioxidant capacities of different plum varieties commercially available in Central Queensland. Black plums and Croc Egg plums have the highest total antioxidant and phenolic contents, with black plums also containing the highest anthocyanin contents. In addition, each variety showed a distinct composition in terms of individual anthocyanins, as determined by HPLC. Variation in the mineral content was also observed. ATR-MIR applied to the plum extracts, skins and homogenates provided insight into the phytochemical composition of the plum skin and flesh. MIR spectra of different plum varieties were able to be isolated using PCA and classified using PLS-DA. This technology may be of use to future researchers, such as in developing noninvasive technologies to predict antioxidant, phenolic or anthocyanin contents.
Declaration of interests
The authors declare no competing interests.
Supplemental Material
Download MS Word (44 KB)Acknowledgments
The authors would like to extend their thanks to Aoife Power, Shaneel Chandra and Kerry Walsh for their useful comments on an early draft of the manuscript.
Supplementary material
Supplemental data for this article can be accessed on the publisher’s website.
Additional information
Funding
References
- Aboshora, W., Z. Lianfu, M. Dahir, M. Qingran, S. Qingrui, L. Jing, N.Q.M. Al-Haj, and A. Ammar. 2014. Effect of extraction method and solvent power on polyphenol and flavonoid levels in Hyphaene thebaica L Mart (Arecaceae)(doum) fruit, and its antioxidant and antibacterial activities. Trop. J. Pharm. Res. 13(12):2057–2063.
- Adiani, V., S. Gupta, R. Ambolikar, and P.S. Variyar. 2018. Development of rapid method to assess microbial quality of minimally processed pomegranate arils using FTIR. Sens. Actuators. B Chem. 260:800–807.
- Ahmad, R., D. Potter, and S. Southwick. 2004. Identi® cation and characterization of plum and pluot cultivars by microsatellite markers. J. Hortic. Sci. Biotechnol. 79(1):164–169.
- Apak, R., S. Gorinstein, V. Böhm, K.M. Schaich, M. Özyürek, and K. Güçlü. 2013. Methods of measurement and evaluation of natural antioxidant capacity/activity (IUPAC Technical Report). Pure Appl. Chem. 85(5):957–998.
- Arjmandi, B.H., D.A. Khalil, E.A. Lucas, A. Georgis, B.J. Stoecker, C. Hardin, M.E. Payton, and R.A. Wild. 2002. Dried Plums Improve Indices of Bone Formation in Postmenopausal Women. J. Womens Health Gend. Based Med. 11(1):61–68.
- Bartosińska, E., M. Buszewska-Forajta, and D. Siluk. 2016. GC–MS and LC–MS approaches for determination of tocopherols and tocotrienols in biological and food matrices. J. Pharm. Biomed. Anal 127:156–169.
- Benzie, I.F., and J.J. Strain. 1996. The ferric reducing ability of plasma (FRAP) as a measure of “antioxidant power”: The FRAP assay. Anal. Biochem. 239(1):70–76.
- Birwal, P., G. Deshmukh, and S. Saurabh. 2017. Plums: A brief introduction. J. Food Nutr. Popul. Health 1:1–5.
- Bureau, S., D. Cozzolino, and C.J. Clark. 2019. Contributions of Fourier-transform mid infrared (FT-MIR) spectroscopy to the study of fruit and vegetables: A review. Postharvest. Biol. Technol 148:1–14.
- Bureau, S., D. Ruiz, M. Reich, B. Gouble, D. Bertrand, J.-M. Audergon, and C.M. Renard. 2009. Application of ATR-FTIR for a rapid and simultaneous determination of sugars and organic acids in apricot fruit. Food Chem. 115(3):1133–1140.
- Bureau, S.B., B. Quilot-Turion, V. Signoret, C. Renaud, M. Maucourt, D. Bancel, and C.M. Renard. 2013. Determination of the composition in sugars and organic acids in peach using mid infrared spectroscopy: Comparison of prediction results according to data sets and different reference methods. Anal. Chem. 85(23):11312–11318.
- Canteri, M.H.G., C.M.G.C. Renard, C. Le Bourvellec, and S. Bureau. 2019. ATR-FTIR spectroscopy to determine cell wall composition: Application on a large diversity of fruits and vegetables. Carbohydr. Polym. 212:186–196.
- Chatjigakis, A.K., C. Pappas, N. Proxenia, O. Kalantzi, P. Rodis, and M. Polissiou. 1998. FT-IR spectroscopic determination of the degree of esterification of cell wall pectins from stored peaches and correlation to textural changes. Carbohydr. Polym. 37(4):395–408.
- Chun, O.K., D.-O. Kim, and C.Y. Lee. 2003. Superoxide Radical Scavenging Activity of the Major Polyphenols in Fresh Plums. J. Agric. Food Chem. 51(27):8067–8072.
- Cisneros-Zevallos, L., D.H. Byrne, D.W. Ramming, W.R. Okie, and M. Vizzotto. 2005. Total phenolic, carotenoid, and anthocyanin content and antioxidant activity of peach and plum genotypes. Paper presented at the VI International Peach Symposium, Santiago, Chile. doi: https://doi.org/10.17660/ActaHortic.2006.713.67.
- Cunningham, J., G. Milligan, and L. Trevisan. 2001. Minerals in Australian fruits and vegetables - a comparison of levels between the 1980s and 2000. Food Standards Australia New Zealand, Canberra, Australia.
- Di Egidio, V., N. Sinelli, S. Limbo, L. Torri, L. Franzetti, and E. Casiraghi. 2009. Evaluation of shelf-life of fresh-cut pineapple using FT-NIR and FT-IR spectroscopy. Postharvest. Biol. Technol. 54(2):87–92.
- Domínguez-Martínez, I., O.G. Meza-Márquez, G. Osorio-Revilla, J. Proal-Nájera, and T. Gallardo-Velázquez. 2014. Determination of capsaicin, ascorbic acid, total phenolic compounds and antioxidant activity of Capsicum annuum L. var. serrano by mid infrared spectroscopy (Mid-FTIR) and chemometric analysis. J. Korean Soc. Appl. Biol. Chem. 57(1):133–142.
- Donovan, J.L., A.S. Meyer, and A.L. Waterhouse. 1998. Phenolic composition and antioxidant activity of prunes and prune juice (Prunus domestica). J. Agric. Food Chem. 46(4):1247–1252.
- Englberger, L., R.B. Wills, B. Blades, L. Dufficy, J.W. Daniells, and T. Coyne. 2006. Carotenoid content and flesh color of selected banana cultivars growing in Australia. Food Nutr. Bull. 27(4):281–291.
- Falk, M., and E. Whalley. 1961. Infrared spectra of methanol and deuterated methanols in gas, liquid, and solid phases. J. Chem. Phys. 34(5):1554–1568.
- Fang, N., S. Yu, and R.L. Prior. 2002. LC/MS/MS characterization of phenolic constituents in dried plums. J. Agric. Food Chem. 50(12):3579–3585.
- Fanning, K.J., D. Edwards, M. Netzel, R. Stanley, G. Netzel, D. Russell, and B. Topp. 2013. Increasing anthocyanin content in Queen Garnet plum and correlations with in-field measures. Paper presented at the X International Symposium on Plum and Prune Genetics, Breeding and Pomology, Davis, CA. doi: https://doi.org/10.17660/ActaHortic.2013.985.12.
- Fanning, K.J., B. Topp, D. Russell, R. Stanley, and M. Netzel. 2014. Japanese plums (Prunus salicina Lindl.) and phytochemicals–breeding, horticultural practice, postharvest storage, processing and bioactivity. J. Sci. Food Agric. 94(11):2137–2147.
- FAO. 2019. FAOSTAT. Food and Agricultural Organization of the United Nations. 6 Jun. http://www.fao.org/faostat/en/#data/QC.
- Fernández-López, J.A., L. Almela, J.A. Muñoz, V. Hidalgo, and J. Carreño. 1998. Dependence between colour and individual anthocyanin content in ripening grapes. Food Res. Int. 31(9):667–672.
- Galvano, F., L.F. La, P. Vitaglione, V. Fogliano, L. Vanella, and C. Felgines. 2007. Bioavailability, antioxidant and biological properties of the natural free-radical scavengers cyanidin and related glycosides. Ann. Ist. Super. Sanita. 43(4):382–393.
- Gil, M.I., F.A. Tomás-Barberán, B. Hess-Pierce, and A.A. Kader. 2002. Antioxidant capacities, phenolic compounds, carotenoids, and vitamin C contents of nectarine, peach, and plum cultivars from California. J. Agric. Food Chem. 50(17):4976–4982.
- Giusti, M.M., and R.E. Wrolstad. 2001. Characterization and Measurement of Anthocyanins by UV-Visible Spectroscopy. Curr. Protoc. Food Anal. Chem. 00(1):F1.2.1-F1.2.13. doi: https://doi.org/10.1002/0471142913.faf0102s00.
- Gnanasambandam, R., and A. Proctor. 2000. Determination of pectin degree of esterification by diffuse reflectance Fourier transform infrared spectroscopy. Food Chem. 68(3):327–332.
- González-Cabrera, M., A. Domínguez-Vidal, and M.J. Ayora-Cañada. 2018. Hyperspectral FTIR imaging of olive fruit for understanding ripening processes. Postharvest Biol. Technol. 145:74–82.
- González-Flores, D., B. Velardo, M. Garrido, D. González-Gómez, M. Lozano, M.C. Ayuso, C. Barriga, S.D. Paredes, and A.B. Rodríguez. 2011. Ingestion of Japanese plums (Prunus salicina Lindl. cv. Crimson Globe) increases the urinary 6-sulfatoxymelatonin and total antioxidant capacity levels in young, middle-aged and elderly humans: Nutritional and functional characterization of their content. J. Food Nutr. Res. 50(4):229–236.
- Gordon, R., J. Chapman, A. Power, S. Chandra, J. Roberts, and D. Cozzolino. 2019. Mid-infrared spectroscopy coupled with chemometrics to identify spectral variability in Australian barley samples from different production regions. J. Cereal Sci. 85:41–47.
- Güçlü, K., M. Altun, M. Özyürek, S.E. Karademir, and R. Apak. 2006. Antioxidant capacity of fresh, sun- and sulphited-dried Malatya apricot (Prunus armeniaca) assayed by CUPRAC, ABTS/TEAC and folin methods. Int. J. Food Sci. Technol. 41(s1):76–85.
- Guo, C., J. Yang, J. Wei, Y. Li, J. Xu, and Y. Jiang. 2003. Antioxidant activities of peel, pulp and seed fractions of common fruits as determined by FRAP assay. Nutr. Res. 23(12):1719–1726.
- Hineno, M. 1977. Infrared spectra and normal vibration of β-d-glucopyranose. Carbohydr. Res. 56(2):219–227.
- Hogan, A. 2017. Montague expands its stone fruit offering. Australian Food News, Melbourne. 6 Feb. http://www.ausfoodnews.com.au/2017/02/06/montague-expands-its-stone-fruit-offering.html.
- Horbowicz, M., R. Kosson, A. Grzesiuk, and H. Dębski. 2008. Anthocyanins of fruits and vegetables-their occurrence, analysis and role in human nutrition. Veg. Crop Res. Bull. 68:5–22.
- Hsia, C.L., B. Luh, and C. Chichester. 1965. Anthocyanin in freestone peaches. J. Food Sci. 30(1):5–12.
- Igwe, E.O., and K.E. Charlton. 2016. A systematic review on the health effects of plums (Prunus domestica and Prunus salicina). Phytother. Res. 30(5):701–731.
- Igwe, E.O., K.E. Charlton, S. Roodenrys, K. Kent, K. Fanning, and M. Netzel. 2017. Anthocyanin-rich plum juice reduces ambulatory blood pressure but not acute cognitive function in younger and older adults: A pilot crossover dose-timing study. Nutr. Res. 47:28–43.
- Jeong, S.T., N. Goto-Yamamoto, K. Hashizume, and M. Esaka. 2006. Expression of the flavonoid 3′-hydroxylase and flavonoid 3′,5′-hydroxylase genes and flavonoid composition in grape (Vitis vinifera). Plant Sci. 170(1):61–69.
- Johnson, J., T. Collins, A. Power, S. Chandra, D. Portman, C. Blanchard, and M. Naiker. 2020a. Antioxidative properties and macrochemical composition of five commercial mungbean varieties in Australia. Legum. Sci. 2(1):e27. doi: https://doi.org/10.1002/leg3.27.
- Johnson, J., T. Collins, D. Skylas, and M. Naiker. 2019. ATR-MIR: A valuable tool for the rapid assessment of biochemically active compounds in grains. Paper presented at the 69th Australasian Grain Science Conference, Carlton, Melbourne, Australia, 27-29 Aug.
- Johnson, J., T. Collins, D. Skylas, K. Quail, C. Blanchard, and M. Naiker. 2020b. Profiling the varietal antioxidative content and macrochemical composition in Australian faba beans (Vicia faba L.). Legum. Sci. 2(2):e28. doi: https://doi.org/10.1002/leg3.28.
- Johnson, J., T. Collins, K. Walsh, and M. Naiker. 2020c. Solvent extractions and spectrophotometric protocols for measuring the total anthocyanin, phenols and antioxidant content in plums. Chem. Pap. 74(12):4481–4492.
- Johnson, J., J. Mani, N. Ashwath, and M. Naiker. 2020d. Potential for Fourier transform infrared (FTIR) spectroscopy toward predicting antioxidant and phenolic contents in powdered plant matrices. Spectrochim. Acta. A. Mol. Biomol. Spectrosc. 233:118228.
- Kacurakova, M., P. Capek, V. Sasinkova, N. Wellner, and A. Ebringerova. 2000. FT-IR study of plant cell wall model compounds: Pectic polysaccharides and hemicelluloses. Carbohydr. Polym. 43(2):195–203.
- Kaulmann, A., M.-C. Jonville, Y.-J. Schneider, L. Hoffmann, and T. Bohn. 2014. Carotenoids, polyphenols and micronutrient profiles of Brassica oleraceae and plum varieties and their contribution to measures of total antioxidant capacity. Food Chem. 155:240–250.
- Kim, D.-O., O.K. Chun, Y.J. Kim, H.-Y. Moon, and C.Y. Lee. 2003a. Quantification of polyphenolics and their antioxidant capacity in fresh plums. J. Agric. Food Chem. 51(22):6509–6515.
- Kim, D.-O., S.W. Jeong, and C.Y. Lee. 2003b. Antioxidant capacity of phenolic phytochemicals from various cultivars of plums. Food Chem. 81(3):321–326.
- Ko, S.-H., S.-W. Choi, S.-K. Ye, B.-L. Cho, H.-S. Kim, and M.-H. Chung. 2005. Comparison of the antioxidant activities of nine different fruits in human plasma. J. Med. Food 8(1):41–46.
- Kwiatkowski, M., D. Cozzolino, and D.K. Taylor. 2020. ATR-MIR spectroscopy predicts total phenolics and colour for extracts produced by microwave-assisted or conventional thermal extraction methods applied separately to mixtures of grape skins from white or red commercial cultivars. Food Anal. Methods 13(4):872–884.
- Lai, F., Q. Wen, L. Li, H. Wu, and X. Li. 2010. Antioxidant activities of water-soluble polysaccharide extracted from mung bean (Vigna radiata L.) hull with ultrasonic assisted treatment. Carbohydr. Polym. 81(2):323–329.
- Libnau, F.O., O.M. Kvalheim, A.A. Christy, and J. Toft. 1994. Spectra of water in the near-and mid-infrared region. Vib. Spectrosc. 7(3):243–254.
- Lister, C., M. Skinner, and D. Hunter. 2007. Fruits, vegetables and their phytochemicals for bone and joint health. Curr. Top. Nutraceutical Res. 5(2):67–82.
- Lombardi-Boccia, G., M. Lucarini, S. Lanzi, A. Aguzzi, and M. Cappelloni. 2004. Nutrients and antioxidant molecules in yellow plums (Prunus domestica L.) from conventional and organic productions: A comparative study. J. Agric. Food Chem. 52(1):90–94.
- Maréchal, Y. 1991. Infrared spectra of water. I. Effect of temperature and of H/D isotopic dilution. J. Chem. Phys. 95(8):5565–5573.
- Marković, J.M.D., J.M. Baranac, and T.P. Brdarić. 2005. Electronic and infrared vibrational analysis of cyanidin–quercetin copigment complex. Spectrochim. Acta. A. Mol. Biomol. Spectrosc. 62(1–3):673–680.
- McKean, D., J. Duncan, and L. Batt. 1973. CH stretching frequencies, bond lengths and dissociation energies. Spectrochim. Acta. A. Mol. Biomol. Spectrosc. 29(6):1037–1049.
- Miaw, C.S.W., C. Assis, A.R.C.S. Silva, M.L. Cunha, M.M. Sena, and S.V.C. de Souza. 2018. Determination of main fruits in adulterated nectars by ATR-FTIR spectroscopy combined with multivariate calibration and variable selection methods. Food Chem. 254:272–280.
- Musa, K.H., A. Abdullah, K. Jusoh, and V. Subramaniam. 2011. Antioxidant activity of pink-flesh guava (Psidium guajava L.): Effect of extraction techniques and solvents. Food Analy. Methods 4(1):100–107.
- Netzel, M., K. Fanning, G. Netzel, F. Frank, D. Zabaras, D. Russell, and R. Stanley. 2012a. Urinary pharmacokinetics of Queen Garnet plum anthocyanins in healthy human subjects. Emerging Trends Dietary Compon. Preventing Combating Dis. 21:375–392. doi: https://doi.org/10.1021/bk-2012-1093.ch021.
- Netzel, M., K. Fanning, G. Netzel, D. Zabaras, G. Karagianis, T. Treloar, D. Russell, and R. Stanley. 2012b. Urinary excretion of antioxidants in healthy humans following Queen Garnet plum juice ingestion: A new plum variety rich in antioxidant compounds. J. Food Biochem. 36(2):159–170.
- Padman, S. 2019. King Midas® plums set to hit the Australian markets. Fresh Plaza, Tholen, The Netherlands. 11 Jan. https://www.freshplaza.com/article/9060570/king-midas-r-plums-set-to-hit-the-australian-markets/.
- Piga, A., A. Del Caro, and G. Corda. 2003. From Plums to Prunes: Influence of Drying Parameters on Polyphenols and Antioxidant Activity. J. Agric. Food Chem. 51(12):3675–3681.
- Reiter, R.J., D.X. Tan, J.C. Mayo, R.M. Sainz, and S. Lopez-Burillo. 2002. Melatonin, longevity and health in the aged: An assessment. Free Radical Res. 36(12):1323–1329.
- Roberts, J., A. Power, J. Chapman, S. Chandra, and D. Cozzolino. 2018. A short update on the advantages, applications and limitations of hyperspectral and chemical imaging in food authentication. Appl. Sci. 8(4):505.
- Ruiz, D., M. Reich, S. Bureau, C.M. Renard, and J.-M. Audergon. 2008. Application of reflectance colorimeter measurements and infrared spectroscopy methods to rapid and nondestructive evaluation of carotenoids content in apricot (Prunus armeniaca L.). J. Agric. Food Chem. 56(13):4916–4922.
- Rupasinghe, H.P.V., S. Jayasankar, and W. Lay. 2006. Variation in total phenolics and antioxidant capacity among European plum genotypes. Sci. Hort. 108(3):243–246.
- Santhakumar, A.B., A.R. Kundur, K. Fanning, M. Netzel, R. Stanley, and I. Singh. 2015a. Consumption of anthocyanin-rich Queen Garnet plum juice reduces platelet activation related thrombogenesis in healthy volunteers. J. Funct. Foods 12:11–22.
- Santhakumar, A.B., A.R. Kundur, S. Sabapathy, R. Stanley, and I. Singh. 2015b. The potential of anthocyanin-rich Queen Garnet plum juice supplementation in alleviating thrombotic risk under induced oxidative stress conditions. J. Funct. Foods 14:747–757.
- Savitzky, A., and M.J. Golay. 1964. Smoothing and differentiation of data by simplified least squares procedures. Anal. Chem. 36(8):1627–1639.
- Ścibisz, I., M. Reich, S. Bureau, B. Gouble, M. Causse, D. Bertrand, and C.M. Renard. 2011. Mid-infrared spectroscopy as a tool for rapid determination of internal quality parameters in tomato. Food Chem. 125(4):1390–1397.
- Scott, J.W., W.M. Cort, H. Harley, D.R. Parrish, and G. Saucy. 1974. 6-Hydroxychroman-2-carboxylic acids: Novel antioxidants. J. Am. Oil Chem. Soc. 51(5):200–203.
- Shukitt-Hale, B., W. Kalt, A.N. Carey, M. Vinqvist-Tymchuk, J. McDonald, and J.A. Joseph. 2009. Plum juice, but not dried plum powder, is effective in mitigating cognitive deficits in aged rats. Nutr. 25(5):567–573.
- Shurvell, H. 2006. Spectra–structure correlations in the mid‐and far‐infrared. Handbook of vibrational spectroscopy. New York (NY): John Wiley & Sons.
- Singleton, V.L., and J.A. Rossi. 1965. Colorimetry of total phenolics with phosphomolybdic-phosphotungstic acid reagents. Am. J. Enol. Vitic. 16(3):144–158.
- Sivakesava, S., and J. Irudayaraj. 2000. Determination of sugars in aqueous mixtures using mid-infrared spectroscopy. Appl. Eng. Agric. 16(5):543–550.
- Stacewicz-Sapuntzakis, M., P.E. Bowen, E.A. Hussain, B.I. Damayanti-Wood, and N.R. Farnsworth. 2001. Chemical composition and potential health effects of prunes: A functional food? Crit. Rev. Food Sci. Nutr. 41(4):251–286.
- Sultana, B., and F. Anwar. 2008. Flavonols (kaempeferol, quercetin, myricetin) contents of selected fruits, vegetables and medicinal plants. Food Chem. 108(3):879–884.
- Tomás-Barberán, F.A., M.I. Gil, P. Cremin, A.L. Waterhouse, B. Hess-Pierce, and A.A. Kader. 2001. HPLC−DAD−ESIMS Analysis of phenolic compounds in nectarines, peaches, and plums. J. Agric. Food Chem. 49(10):4748–4760.
- Usenik, V., F. Štampar, and R. Veberič. 2009. Anthocyanins and fruit colour in plums (Prunus domestica L.) during ripening. Food Chem. 114(2):529–534.
- Vangdal, E., and R. Slimestad. 2006. Methods to determine antioxidative capacity in fruit. J. Fruit Ornam. Plant Res. 14:123.
- Wang, Y., X. Chen, Y. Zhang, and X. Chen. 2012. Antioxidant activities and major anthocyanins of myrobalan plum (Prunus cerasifera Ehrh.). J. Food Sci. 77(4):C388–C393.
- Williams, B.L., and S.H. Wender. 1953. Isolation and identification of quercetin and some quercetin glycosides from plums (Prunus Salicina). J. Am. Chem. Soc. 75(17):4363–4364.
- Wills, R.B., F.M. Scriven, and H. Greenfield. 1983. Nutrient composition of stone fruit (Prunus spp.) cultivars: Apricot, cherry, nectarine, peach and plum. J. Sci. Food Agric. 34(12):1383–1389.
- Wold, S., M. Sjöström, and L. Eriksson. 2001. PLS-regression: A basic tool of chemometrics. Chemometri. Intell. Lab. Syst. 58(2):109–130.
- Wu, X., and R.L. Prior. 2005. systematic identification and characterization of anthocyanins by HPLC-ESI-MS/MS in common foods in the United States: Fruits and berries. J. Agric. Food Chem. 53(7):2589–2599.