
ABSTRACT
Pears (Pyrus spp.) mainly are divided into two main groups of Asian and European species with a wide diversity or similarity in fruit and morphological traits. In this study, flow cytometry was performed to evaluate the genome size of 37 cultivars and genotypes of Asian, European, and Iranian indigenous pears. Besides, the relationship between cytological and morphological traits was investigated for the first time. Morphological traits were measured based on the International Union for the Protection of New Varieties of Plants (UPOV) descriptor. There were positive relationships between genome size, the fruit pedicel length, and the length to fruit diameter ratio. Although, as the genome size was increased, the fruit diameter and size were decreased. Increasing 1.6 pg of the genome size causes a reduction of one cm in the pear fruit diameter. Moreover, with a larger genome size by 1.1 pg, there was an increase in fruit pedicel by one cm. The obtained results revealed that most of the Iranian native genotypes were similar in shape to European pears, but some of them were also oriented to Asian pear cultivars. Most studied cultivars originated between different regions were diploid (2n = 34) and their genome size varied between 0.99 and 1.99 pg. The average genome size of European and Iranian pears was 1.29 pg and Asian’s was 1.32 pg. The principal component analysis (PCA) result showed that the Asian and European genotypes were distinctly separated. Also, according to the cluster analysis, the indigenous cultivars of Iran can be located in the European pear group species. There was a relationship between the East Asian and European pear origins because of the possible gene flow between two major pear culture regions in the past. In general, Iran can be considered as an important region and pathway of gene flow transfer and a rich center of genetic variation of pears. Therefore, this study provided essential information and a useful tool for genetic diversity or similarity assessment of pears through genome size and some morphological traits prediction. Further research on wider fruit tree species in the different fruit-growing regions of the world will warrant the use of genome size as a novel prediction tool for the important morphological traits with specific commercial breeding objectives.
Introduction
Pears (Pyrus spp.) with 34 chromosome number (2n = 2x = 34) is a major fruit of the Rosaceae family after apple, which is originated from Europe and Asia (Postman et al., Citation2015; Westwood, Citation1993). Its cultivation began over 3000 years ago. The geographical distribution of pears can be divided into two main groups, including European and Asian pears (Koushesh-Saba et al., Citation2017; Kumar et al., Citation2017). European pears are located in Europe, North Africa, Asia Minor, Iran, Central Asia, and Afghanistan, with the most important species P. communis. Oriental pears such as P. serotina synonym P. pryifolia distributed in Japan have originated from Eastern Asia (Arzani, Citation2017; Koushesh-Saba et al., Citation2017; Teng and Tanabe, Citation2004). During the period of trade and commercialization, the Silk Road was historically the most concentrated center for the exchange of agricultural products and technology (Wei et al., Citation2008) as well as pear germplasm (Nikzad Gharehaghaji et al., Citation2014c, Citation2014b). Besides, the results are evident of Japanese pear footprint P. pyrifolia during the evolution of the genus Pyrus in Iran (Sharifani et al., Citation2008). Therefore, the northern and northeastern parts of Iran are rich sources of pear genetic diversity (Heidari et al., Citation2019). In this respect, Iran may be the first country that imported P. communis from Europe, and P. serotina and P. pryifolia genotypes from East Asian countries (Arzani, Citation2002a, Citation2002b). Note that according to the published reports, 88 percentages of the pears have disappeared in the United States, in the 19th century (Fowler and Mooney, Citation1990). This erosion of genetic resources has also occurred in pears in other parts of the world such as Iran (Nikzad Gharehaghaji et al., Citation2014a).
Currently, pears are commercially cultivated in more than 50 temperate regions. The genus Pyrus has at least 22 known species, all of which are native to Asia, Europe, and the northern areas of the United States (Bell et al., Citation1996) with more than 5,000 varieties (Monte-Corvo et al., Citation2001). As mentioned earlier, Iran is recognized as an important source of genetic diversity for various fruit crops, including pears (Bashiri et al., Citation2017; Koushesh-Saba et al., Citation2017; Nikzad Gharehaghaji et al., Citation2014a). There is a greater genetic variation of European pear species than other species of fruit trees (Bell et al., Citation1996), with high diversity in this species due to the existence of the gametophytic self-incompatibility system for fruit setting and seed-bearing (Arzani, Citation2018, Citation2020). Genetic variation in this genus has been created through direct seed propagation as well as hybridization in the long-distance in history. Hence, pears originated through the seedling propagations created the opportunity for a wide variation in the world pear germplasm which is used as a working material for proper selection in the pear breeding programs such as A95 promising chance seedling pear genotype (Wang and Arzani, Citation2019). Also, assessing the morphological diversity among existing species is the first step to start any breeding programs, managing genetic resources, protecting cultivars, and selecting candidates to diversify local commercial pear production (Pereira-Lorenzo et al., Citation2012; Wang and Arzani, Citation2019).
European pears can easily be distinguished from any other species of this genus such as the pyrifolia or serotina that called Asian pear because of certain morphological characteristics (Arzani, Citation2002a, Citation2002b) and molecular markers (Koushesh-Saba et al., Citation2017). Over the past decades, efforts have been made to evaluate the genetic diversity of European and Asian pears as well as other Pyrus species using morphological, biochemical, and molecular markers (Koushesh-Saba et al., Citation2017; Nikzad Gharehaghaji et al., Citation2014a). Traditional methods of evaluating cultivars are usually adopted based on morphological traits to identify varieties within the species (Govindaraj et al., Citation2015; Zarei et al., Citation2019). Besides, the reported studied results based on molecular markers have identified a close kinship between Japanese and Chinese pears showed P. bretschneideri (ELi) known as P. serotina and P. pryifolia sub-species, are named P. pyrifolia var. Sinensis (Bao et al., Citation2007; Teng et al., Citation2002).
Also, it has been reported that cytological studies are a powerful tool for assessing the genetic diversity or similarity of pears, among which the nuclear DNA content (C-value) is a key characteristic of plant breeding and the evaluation of germplasm (Abedi et al., Citation2015; Doležel and Bartoš, Citation2005; Doležel et al., Citation2007; Greilhuber et al., Citation2005; Karimzadeh et al., Citation2010; Knight et al., Citation2005; Sarikhani Khorami et al., Citation2018). Besides, flow cytometry data analysis is a reliable and suitable method for estimating the genome size of plant communities such as ornamental plants (Abedi et al., Citation2015), fruit crops including walnuts (Sarikhani Khorami et al., Citation2018), olive (Brito et al., Citation2008) and apple (Hofer and Meister, Citation2010; Korban et al., Citation2009; Podwyszyńska et al., Citation2016) and medicinal plants (Javadian et al., Citation2017; Majdi et al., Citation2010; Noori et al., Citation2017; Tarkesh Esfahani et al., Citation2016; Tavan et al., Citation2015). The preliminary study was conducted by Kadkhodaei et al. (Citation2017) to explore seed germination and further studying the cytology of two European pear cultivars `Dargazi’ and `Khoj’ that usually used as pear rootstock in the pear orchards in Iran. Also, because Iran considered an important region and pathway of gene flow transfer and a rich center of genetic variation of pears, further researches are suggested to continue on more pear genotypes and cultivars originated from Asia, Europe, and Iranian native pears (Arzani, Citation2017; Kadkhodaei et al., Citation2017). Therefore, this study was performed to provide additional information about genetic diversity and similarities among pears through genome size and some morphological traits prediction. Besides, this research aimed to assess the differences and possible relationship between morphological traits and genome size of some European, Asian, and indigenous pears in Iran.
Materials and Methods
Plant Materials
This study was conducted on 37 pears () cultivars and genotypes of Pyrus including 25 European (P. communis L.) and 12 Asian (including ten P. serotina Rehd., one P. betulifolia, and one P. calleryana) pears based on a completely randomized design (CRD). Samples were taken from European and Asian pear collection orchards at Tarbiat Modares University (TMU) including several genotypes and indigenous cultivars of Iran (Arzani, Citation2002a, Citation2002b). Also, several samples were taken from the Horticultural Science Research Institute (HSRI) European pear collection orchards located in Karaj, Iran. The names of the collected samples are presented in .
Table 1. 1Cx monoploid genome size (Mbp), ploidy level, the origin of the studied genotypes in European, Asian, and indigenous Iranian pears during 2017 growing season
Morphological Traits
Some important morphological characteristics, including fruit length, fruit diameter, leaf length, leaf width, and petiole length of pear were evaluated based on the International Union for the Protection of New Varieties of Plants (UPOV) descriptor (UPOV, Citation2000). Leaf-blade base, Leaf-blade apex, Leaf base margin, fruit size, and symmetry were measured based on rating and coding as represented. Furthermore, other morphological traits were measured with a digital caliper (model INSIZE, Japan). Note that morphological traits were assessed using 15 randomly selected mature fruits and 15 fully expanded leaves from each genotype and cultivars. Besides, fruits were assessed at the commercial maturity harvest index mainly based on the fruit background color, total soluble solids (TSS), and flesh firmness. Also, the outside canopy shoots with fully expanded leaves were considered for morphological leaf assessments.
Genome Size Assessment
Methodology and Calculation of Flow Cytometric Data
Flow cytometry was employed to estimate the genome size (2 Cx DNA value) of each genotype, via the propidium iodide (PI) staining method. The pear plant was compared with standard plant tomato (Solanum lycopersicum cv. `Stupicke’; 2 C DNA = 1.96 pg), corn (Zea mays CE-777; 2 C DNA = 5.43 pg), or soybean (Glycine max cv. `Polanka’; 2 C DNA = 2.5 pg ((Doležel et al., Citation1994, Citation1992). For this purpose, about 1 cm2 of young and fully developed fresh leaves of tomato, soybean, and corn were used as the standard plants. Also, about 2 cm2 of young and fully developed fresh leaves were sampled for cytological assessment of the studied pear cultivars. Samples were chopped with a sharp razor blade, and then mixed in 1 ml woody plant extraction buffer (WPB) (Loureiro et al., Citation2007). The Glycine max standard was consulted for the studied genotypes including G12, G15, G17, G27, G28, G29, and G32. Zea mays were considered as a standard for G16 genotype, and Solanum lycopersicum for the other studied genotypes. The obtained mixture was passed through Partech 30 mm nylon mesh filter (Munster, Germany) to remove cell debris. The amount of 50 µg ml−1 RNase was added to eliminate the RNA and prevent PI from joining RNA (Tarkesh Esfahani et al., Citation2016); the same amount of PI fluorescent color was also added to color the nuclear DNA. The nuclei suspension was analyzed, through BD FACS CantoTM KE Flow Cytometer using the BD FACSDivaTM Software (BD Biosciences, Bedford, MA, USA)(). The obtained histograms were analyzed by the Flowing Software version 2.5.0 (Cell Imaging Core specification, Turku Center for Biotechnology, Finland). Afterward, the analyzed data were gated, using Partec FloMax ver. 2.4e (Partec, Münster, Germany). Moreover, areas of the gating range were specified for obtaining histograms. To calculate the genome size in Mbp, each 1 pg of the genome value was considered to be 978 Mbp (Doležel et al., Citation2003). The size of the monoploid genome (1 Cx) of DNA values in a chromosomal complex set (x) is a somatic diploid cell since the plants are most often diploid, 2 Cx DNA. We used the following formula to calculate the 2 Cx DNA of a pear plant (Doležel and Bartoš, Citation2005). Also, the absolute DNA amount of a sample was calculated based on the values of the G1 peak means (Citation2005; Doležel et al., Citation2007) as follows:
Sample 2 CxDNA (pg) = (Sample G1 peak mean/Standard G1 peak mean) × Standard 2 C DNA (pg).
Data Analysis
The obtained data were initially checked for normality and analyzed using SAS (Ver. 9.3, SAS Institute, Cary, NC). Oneway analysis of variance was carried out to determine significant differences between phenotypic and genome size data. The results were statistically evaluated by analysis of variance (ANOVA) and expressed as mean ± standard error (SE). Means comparisons were made using Duncan’s multiple range test (DMRT); differences were considered statistically significant at P≤ 0.01 and P≤ 0.05. Also, morphological traits and genome size data were used for principal component analysis (PCA) and cluster analysis. Before PCA, cluster, and bivariate correlation analyses, the data were normalized by a specific reference sample. PCA and cluster analysis was conducted via Minitab software (Ver. 17). Furthermore, linear regression analysis was carried out to find out the relationship between 2Cx DNA values and some morphological traits using Minitab version 17.
Results
Morphological Variability
In this study, thirty-seven genotypes of pears were selected and sampled, which were originally derived from different parts of the world (, ). ANOVA showed there were significant differences between the genotypes for all of the studied parameters (). Fruit diameter ranged from 2.00 cm to 7.87 cm. The highest fruit diameter was recorded for G7 (7.87 cm), and the lowest value for G29 (2.00 cm) and G27 (2.12 cm) genotypes (). Bashiri et al. (Citation2017) suggested larger fruit diameter resulted in more desirable fruit shape and performance. Also, in the present research, among the studied genotypes and cultivars, the minimum fruit length was calculated in G27 (2.10 cm), G29 (2.03 cm), and G32 (2.13 cm), and the maximum in G1 (9.98 cm), G7 (9.80 cm) and G33 (9.88 cm), respectively. The largest and smallest length-to-diameter ratio was observed in G33 (1.67) and G32 (0.81), respectively, both of which were European origin cultivars. The fruit pedicel length was also different within the studied genotypes, and the maximum and minimum lengths were measured in G17 (7.47 cm) and G4 (1.47 cm), respectively (). The largest length and width of the leaves belonged to G27 (10.63 cm) and G25 (8.07 cm) which originated from Asia. Among the studied samples, G9 (5.80 cm) showed the highest and G32 (1.23 cm) the lowest values for the leaf petiole length ().
Table 2. One-way ANOVA for genome size and morphological traits evaluated among 37 studied pear genotypes
Table 3. Mean values genome size and fruit characteristics of the studied pear genotypes
Table 4. Mean values leaf characteristics of the studied pear genotypes
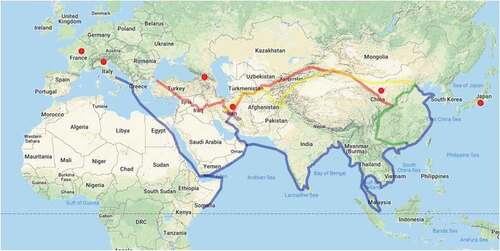
Figure 1. The Silk Road map, which used to be the main route connecting Europe to East Asia through Iran. The lines on the map indicate the land and the sea or water route. Also, the tick dots indicate the countries of origin of the present studied pears
Genome Size
Flow cytometric histograms of 37 pear genotypes are shown in , in which left peaks were referred for G1 pears and right peaks were referred to either standard plants including tomato (Solanum lycopersicum cv. `Stupicke’; 2C DNA = 1.96 pg), corn (Zea mays CE-777; 2C DNA = 5.43 pg), or soybean (Glycine max cv. `Polanka’; 2C DNA = 2.5 pg). As shown in , the difference in genome size was observed among pear genotypes. Most cultivars were diploid (2 n = 2x = 34), but the triploid can be seen among the studied genotypes, so there was a variable amount of 2Cx. The highest amounts of DNA in the nucleus genome were found in G15 (`Astaneh’ cultivar) with 1.99 pg in genome size (). According to Nikzad Gharehaghaji et al. (Citation2014a), and also based on the results obtained in this study, three genotypes G15, G16, and G17 are most likely triploid. In the studied Asian pear cultivars, the nucleus was observed to be 2Cx = 1.25 pg on average, and it seems that all of them were diploid.
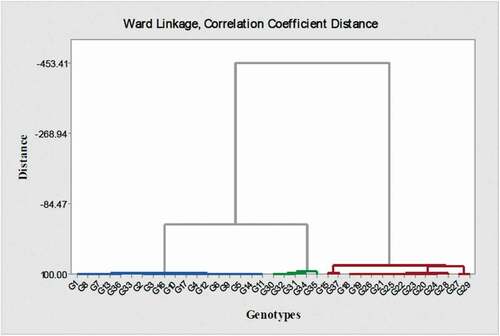
Also, PCA analysis showed that most of the studied Asian pear cultivars and a small number of Iranian cultivars were positioned in one group and European cultivars, and most of the native cultivars of Iran were put in the other main group (). It has been reported that PCA was used for genetic recognition and population structure (Ma et al., Citation2012). Also, in our study thirty-seven genotypes in cluster analysis were classified into 3 groups that had the least genetic differences (). Notably, for cluster analysis, phenotypic and genome size traits were used. G28 and G29 were also placed between the Asian pears group. Some cultivars are native to Iran, and European cultivars were also included in the same group (). According to the cluster analysis, pears were divided into two main European and Asian groups. Most pears have characteristics of both groups, which indicated that Iran is probably an area with a diversity of the Pyrus genus and has played a key role in linking European and Asian pears ().
Figure 2. Flow cytometric histograms of 2Cx DNA content of 37 studied pear genotypes. The left peaks refer to G1 of pear samples and the right peaks refer to G1 of either G.m.: Glycine max cv. `Polanka’ (G12, G15, G17, G27, G28, G29, G32); Z.m.: Zea mays CE-777(G16); S.l.: Solanum lycopersicum cv. `Stupicke’ (other genotypes) as reference standards. Mean CV% of the peaks were less than 5%
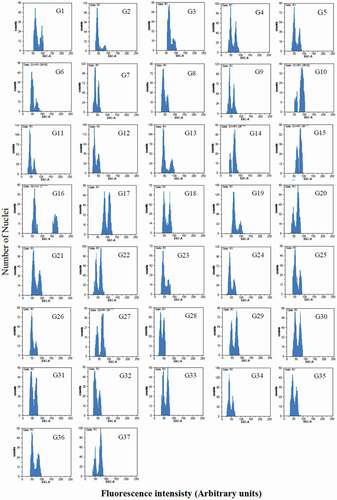
Figure 3. Principal component analysis (PCA) of the studied genotypes and cultivars of pear from European, Asian, and indigenous Iranians based on morphological traits and genome size. Each point represents one genotype and the green and blue lines are drawn to indicate the division of genotypes into two large groups
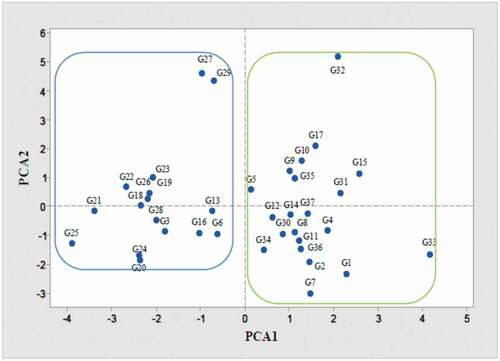
Figure 4. Ward cluster analysis of pear genotypes from European, Asian, and indigenous Iranian pears based on morphological traits and genome size. According to this cluster analysis, pears were divided into two main European (The left side of the figure) and Asian (The right side of the figure) groups
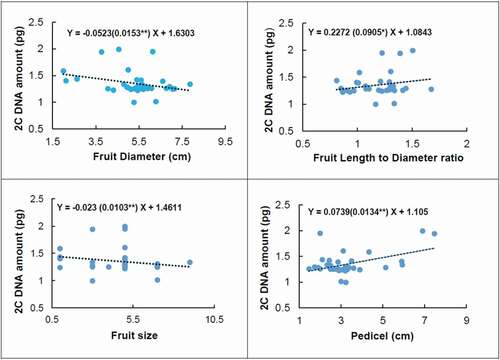
There were significant relationships between the amount of 2Cx DNA and some morphological traits () such as fruit diameter (P ≤ 0.01), fruit length-to-diameter ratio (P ≤ 0.05), fruit pedicel length (P ≤ 0.01), and fruit size (P ≤ 0.01).
Figure 5. Linear regression between genome size (2Cx DNA) and fruit diameter, fruit size, fruit length to diameter ratio, and pedicel length of the studied European, Asian, and indigenous Iranian pear genotypes. The Pearson correlation coefficient between genome size and fruit diameter was −0.306**, fruit size −0.209*, fruit length to diameter ratio 0.217*, and pedicel 0.464**. *and**correlation is significant at P ≤ 0.05 and P ≤ 0.01 respectively
Discussion
The present research was conducted on 37 genotypes of pears originated from Asia, Europe, and Iranian native pears. Also, the geographic position of Iran, as well as the country origins of the studied genotype/cultivars, are shown along with the Silk Road map (). Iran played an important location link between European and Asian pear genotypes. Consequently, this country could be one of the important centers of pear genetic diversity. During the period of trade and commercialization, the transfer of culture between ancient China and Central Asia, the Silk Road was historically the most concentrated center for the exchange of agricultural products and technology (Wei et al., Citation2008) as well as pear germplasm (Nikzad Gharehaghaji et al., Citation2014c, Citation2014b). In this way, Iran may be the first country importer in the world for P. communis from Europe and imported P. serotina and P. pryifolia genotypes from East Asian countries (Arzani, Citation2002a, Citation2002b). The obtained results can be valid for the European and Japanese species, besides the related results of this study indicated that the ancient Iranian cultivars have been influenced during the evolution by the Japanese and European species.
shows an average of 633 Mbp in genome size for the studied genotypes. DNA amount (1C) in Pyrus genus were reported 588 Mbp for P. calleryana (Dickson et al., Citation1992), 563.50 Mbp for P. elaeagrifolia (Jedrzejczyk and Sliwinska, Citation2010), 607.60 Mbp P. communis, and 607.60 Mbp P. piraster (Pustahija et al., Citation2013). Dickson et al. (Citation1992) reviewed two pear cultivars including Pyrus communis L. `Bartlett’ and Pyrus calleryana `Decne’, and reported the amount of 2Cx DNA for this Pyrus at 1.11 and 1.26 pg, respectively. The findings of the present research were consistent with those of Dickson et al. (Citation1992). Also, in the present research, the study of phenotypic traits leads to valuable results, including information about germplasm as well as identification of superior genotypes as reported previously by the other researchers (Arzani, Citation2017; Bernard et al., Citation2018; Wang and Arzani, Citation2019).
In the last half-century, gene flow has been known as a part of the evolutionary path for new cultivars. The gene flow is now known as the success of the allele transfer from one population to another, which is also different among species, populations, and individuals over time. In this study, we found such gene flow in some studied genotypes and cultivars. It has been also reported that gene flow plays an important role in the evolution of the population of animals and plants (Ellstrand, Citation2014; Ellstrand and Rieseberg, Citation2016; Yakimowski and Rieseberg, Citation2014). Interstitial hybridization naturally occurs in flowering plants and affects their evolution path (Field et al., Citation2011).
According to the results of cluster analysis, most cultivated pears of Asian cultivars are diploid (2n = 34) (.), and there is a small number of reported polyploidy (triploid and tetraploid) such as P. bretschneideri (Zielinski and Thompson, Citation1967) or as reported for the German and Romanian pear germplasm (Puskás et al., Citation2016) and Oregon pear collection in the USA (Postman et al., Citation2015). Iketani et al. (Citation1998) showed that the Eastern and Western species of Pyrus evolved independently. In the present research, we identified a difference between the leaves of different studied genotypes. Previously, the variation in some pear species of leaf traits such as leaf length, width, shape, and leaf area was reported among different pear genotypes (Bashiri et al., Citation2017; Najafzadeh and Arzani, Citation2015; Paganová, Citation2009; Zarei et al., Citation2019). In a study conducted on morphological and molecular markers of four species of Pyrus, the mean length and diameter of fruit and pedicel length of fruit in P. communis genotypes were reported to be 7.64, 5.86, and 2.71 and in P. pyrifolia 8.02, 7.91, and 3.62 cm, respectively. The leaf length, width, and petiole length were also reported 6.36, 4.31, and 3.87 in P. pyrifolia and 9.64, 6.19, and 2.54 cm for P. communis, which is quite similar to our data obtained in the present research (Jalilian et al., Citation2018). Pyrus syriaca Boiss., which is a wild and drought-tolerant pear species, was studied for pomology and morphology and the maximum leaf length was reported between 22.27–70.75, and the leaf width between 9.18–35.20 mm (Khadivi et al., Citation2020). Also, 138 pear genotypes from central Zagros mountains were studied, with the minimum and maximum fruit lengths at 1.4 and 10.2, and the minimum and maximum fruit diameters at 1.26 and 7.6. The mean pedicel length was 3.96 and the mean fruit symmetry was 1.63, which was consistent with our obtained and presented results (Bashiri et al., Citation2017).
We found a linear relationship between genome size with traits such as fruit diameter, fruit size, fruit pedicel length, and length-to-diameter ratio. Previous studies also showed a significant relationship between genome size and some phenotypic traits as well as geographical locations in different plant species, such as Lathyrus sativus (Karimzadeh et al., Citation2011), Diphasiastrum sp. (Hanusova et al., Citation2014), and Iranian endemic muskmelon (Karimzadeh et al., Citation2010). Besides, Basak et al. (Citation2019) reported that genome size was not affected by the environment in the turnip. Although, genome size was directly and significantly correlated with cell size and stomatal density in some angiosperm species (Beaulieu et al., Citation2008). Also, Sarikhani Khorami et al. (Citation2018) stated that genome size can be a strong and valuable predictor of nut and kernel weight, nut size of walnut genotypes, and total yield. In this research, we found that by decreasing 1.6 pg genome sizes in the pear, there is an increase of one cm in fruit diameter. In other words, fruit diameter inversely regressed upon genome size. Subsequently, with increasing genome size, fruit size decreased (). The genome size grew in response to a larger length-to-diameter ratio and fruit pedicel. Therefore, by enlarging genome size to about 1.1 pg, one centimeter is added to fruit pedicel length ().
In the present research, we employed cytological studies to detect the differences within the species and between the studied pear species. It has been reported that cytology studies are important in the populations of one species due to their differences, each one exhibits a particular genomic that are in agreement with the environment in which they are being used (Karimzadeh et al., Citation2010; Karimzadeh et al., Citation2011; Abedi et al., Citation2015). Flow cytometry can be employed to determine ploidy levels, estimate the size of the genome in plants, and examine the cell cycle in humans and animals (Doležel and Bartoš, Citation2005; Doležel et al., Citation2007). Also, the application of flow cytometry to detect the polyploidy induction and its effects on morphology, physiology, anatomy, and secondary metabolites have been reported on a wide variety of different plants (Majdi et al., Citation2010, Karimzadeh et al., Citation2011; Abedi et al., Citation2015; Tavan et al., Citation2015; Javadian et al., Citation2017). Genetic diversity is assessed by various factors such as phenotypes, and biochemical, cytological, and molecular characteristics (Govindaraj et al., Citation2015). In the present study, the pear genome was about 633 Mbp on average which is five times smaller than the human genome (6153 Mbp) as reported by Doležel et al. (Citation2003). Besides, in the present research, results showed that the genome size of G15, G16, and G17 were larger than other studied genotypes. According to the results, they are more likely to be triploid. Although Puskás et al. (Citation2016) after using flow cytometric analysis on 124 german and Romanian genotypes, identified 30 triploids in which stated that triploid cultivars will not consider as useful for commercial or breeding programs. Also, Postman et al. (Citation2015) concluded that the most of studied pear cultivars in the Oregon collection orchard are diploid with the few triploid cultivars in which are not recommended for any commercial cultivation. In our research, the native Iranian cultivars showed only a few exceptions, G12 (689.49 Mbp) and G14 (694.38 Mbp), which have relatively large genomes, but the native Iranian pear cultivars were expected to have a relatively small genome. The second, the G13 (484.11 Mbp), the variety has a tiny genome like G2 (493.89 Mbp). Therefore, genome size and morphological traits can be determining factors in establishing relationships in pear genotypes.
Extensive results of plant materials in different climatic areas in one region and the neighboring regions have also been historically documented, such as the movement of pears from Italy to neighboring countries and Eastern and Central Europe (Baccichet et al., Citation2020). The results obtained in the present research showed that given Iran’s location on the Silk Road (), as an important link between Asia and Europe in the past, it played a major role to link Europe and Asian genotypes. Consequently, this country could be an important center of pear genetic diversity.
In conclusion, we observed high genetic diversity in European and Asian pear genotypes and also the similarity in the traits of some studied genotypes. The obtained results revealed that most of the Iranian native genotypes were similar in shape to European pears, but some of them were also oriented to Asian pear cultivars. Most studied cultivars that originated between different regions were diploid (2n = 34) with a varied range of genome size. The results based on PCA and cluster analysis showed that the Asian and European genotypes were distinctly separated and the indigenous cultivars of Iran were located in the European pear group species. There was a relationship between the East Asian and European pear origins because of the possible gene flow between two major pear culture regions in the past. In general, Iran can be considered as an important region and pathway of gene flow transfer and a rich center of genetic variation of pears. Therefore, this study provided essential information and a useful tool for genetic diversity or similarity assessment of pears through genome size and some morphological traits prediction. Besides, related research on wider fruit tree species in the different fruit-growing regions of the world will warrant the use of genome size as a novel prediction tool for the important morphological traits for the further breeding program with the specific commercial objectives.
Acknowledgments
We would like to thank Tarbiat Modares University (TMU) for financial support. This work was supported under Ph.D. Student Grant Program by TMU. Also, laboratory facilities provided by Pomology Lab., Department of Horticultural Science and Cytology Lab., Faculty of Medical Science at TMU are acknowledged.
Disclosure statement
All authors state that there are no conflicts of interest.
Additional information
Funding
References
- Abedi, R., A. Babaei, and G. Karimzadeh. 2015. Karyological and flow cytometric studies of Tulipa (Liliaceae) species from Iran. Plant Syst. Evol. 301(5):1473–1484. doi: https://doi.org/10.1007/s00606-014-1164-z.
- Arzani, K. 2002a. The position of pear breeding and culture in Iran: Introduction of some Asian pear (Pyrus serotina Rehd.) cultivars. Acta Hortic. 587::167–173. doi: https://doi.org/10.17660/ActaHortic.2002.587.18.
- Arzani, K. 2002b. Introduction of some Asian pear cultivars (Pyrus pyrifolia) to Iran. Acta Hortic. 596:287–290. doi: https://doi.org/10.17660/ActaHortic.2002.596.45.
- Arzani, K. 2017. The national Asian pear (Pyrus Serotina Rehd.) project in Iran: Compatibility and commercial studies of introduced cultivars. First International Horticultural Science Conference of Iran (IrHC2017). Tehran Iran, Tarbiat Modares University (TMU), September 4–7. Abstracts Book, P-67 (215) pp 192.
- Arzani, K., (2018). The onset of controlled hybridization, pollination studies, and the history of pollinizer application in the commercial fruit tree orchards in Iran. 5th International Symposium on Plant Genetic Resources &XXX International Horticultural Congress, Istanbul – Turkey, 12–16 August 2018. ( Abstract S1 pp 16–17).
- Arzani, K. 2020. The onset of controlled hybridization, pollination studies, and the history of pollinizer application in the commercial fruit tree orchards in Iran. Acta Hortic. 1297:137–144. doi: https://doi.org/10.17660/ActaHortic.2020.1297.19.
- Baccichet, I., S. Foria, R. Messina, E. Peccol, A. Losa, M. Fabro, G. Gori, P. Zandigiacomo, G. Cipriani, and R. Testolin. 2020. Genetic and ploidy diversity of pear (Pyrus spp.) germplasm of Friuli Venezia Giulia, Italy. Genet. Resour. Crop Evol. 67(1):83–96. doi: https://doi.org/10.1007/s10722-019-00856-9.
- Bao, L., K. Chen, D. Zhang, Y. Cao, T. Yamamoto, and Y. Teng. 2007. Genetic diversity and similarity of pear (Pyrus L.) cultivars native to East Asia revealed by SSR (simple sequence repeat) markers. Genet. Resour. Crop Evol. 54(5):959–971. doi: https://doi.org/10.1007/s10722-006-9152-y.
- Basak, S., X. Sun, G. Wang, and Y. Yang. 2019. Genome size unaffected by variation in morphological traits, temperature, and precipitation in turnip. Applied Sciences 9(2):253. doi: https://doi.org/10.3390/app9020253.
- Bashiri, H., K. Cheghamirza, I. Arji, and N. Mahmodi. 2017. Assessing genetic diversity of Pyrus spp. in the central Zagros Mountains based on morphological characters. Genet. Resour. Crop Evol. 64(2):391–404. doi: https://doi.org/10.1007/s10722-016-0367-2.
- Beaulieu, J.M., I.J. Leitch, S. Patel, A. Pendharkar, and C.A. Knight. 2008. Genome size is a strong predictor of cell size and stomatal density in angiosperms. New Phytol. 179(4):975–986. doi: https://doi.org/10.1111/j.1469-8137.2008.02528.x.
- Bell, R.L., H.A. Quamme, R.E.C. Layne, and R.M. Skirvin.1996. Pears, p. 441–514. In: eds. (J. Janick and J.N. Moore.). Fruit breeding tree and tropical fruits. Vol. 1. John Wiley and Sons, NY.
- Bernard, A., F. Lheureux, and E. Dirlewanger. 2018. Walnut: Past and future of genetic improvement. Tree Genet. Genomes 14(1):1–28.
- Brito, G., J. Loureiro, T. Lopes, E. Rodriguez, and C. Santos. 2008. Genetic characterisation of olive trees from Madeira Archipelago using flow cytometry and microsatellite markers. Genet. Resour. Crop Evol. 55(5):657–664. doi: https://doi.org/10.1007/s10722-007-9268-8.
- Dickson, E.E., K. Arumuganathan, S. Kresovich, and J.J. Doyle. 1992. Nuclear DNA content variation within the Rosaceae. Am. J. Bot. 79(9):1081–1086. doi: https://doi.org/10.1002/j.1537-2197.1992.tb13697.x.
- Doležel, J., J. Bartos, H. Voglmayr, and J. Greilhuber. 2003. Nuclear DNA content and genome size of trout and human. Cytometry A 51(2):127–128. doi: https://doi.org/10.1002/cyto.a.10013.
- Doležel, J., and J.A.N. Bartoš. 2005. Plant DNA flow cytometry and estimation of nuclear genome size. Ann. Bot. 95(1):99–110. doi: https://doi.org/10.1093/aob/mci005.
- Doležel, J., M. Doleželová, and F.J. Novák. 1994. Flow cytometric estimation of nuclear DNA amount in diploid bananas (Musa acuminata and M. balbisiana). Biol. Plant. 36(3):351–357. doi: https://doi.org/10.1007/BF02920930.
- Doležel, J., J. Greilhuber, and J. Suda. 2007. Estimation of nuclear DNA content in plants using flow cytometry. Nat. Protoc. 2(9):2233. doi: https://doi.org/10.1038/nprot.2007.310.
- Doležel, J., S. Sgorbati, and S. Lucretti. 1992. Comparison of three DNA fluorochromes for flow cytometric estimation of nuclear DNA content in plants. Physiol. Plant. 85(4):625–631. doi: https://doi.org/10.1111/j.1399-3054.1992.tb04764.x.
- Ellstrand, N.C. 2014. Is gene flow the most important evolutionary force in plants? Am. J. Bot. 101(5):1–17. doi: https://doi.org/10.3732/ajb.1400024.
- Ellstrand, N.C., and L.H. Rieseberg. 2016. When gene flow really matters: Gene flow in applied evolutionary biology. Evol. Appl. 9(7):833–836. doi: https://doi.org/10.1111/eva.12402.
- Field, D.L., D.J. Ayre, R.J. Whelan, and A.G. Young. 2011. Patterns of hybridization and asymmetrical gene flow in hybrid zones of the rare Eucalyptus aggregata and common E. rubida. Heredity 106(5):841–853. doi: https://doi.org/10.1038/hdy.2010.127.
- Fowler, C., and P.R. Mooney. 1990. Shattering: Food, politic, and the loss of genetic diversity. University of Arizona Press, USA, 278.
- Govindaraj, M., M. Vetriventhan, and M. Srinivasan. 2015. Importance of genetic diversity assessment in crop plants and its recent advances: An overview of its analytical perspectives. Genet. Res. Int. 2015:1–14. doi: https://doi.org/10.1155/2015/431487.
- Greilhuber, J., J. Doležel, M.A. Lysak, and M.D. Bennett. 2005. The origin, evolution, and proposed stabilization of the terms ‘genome size’ and ‘C-value’ to describe nuclear DNA contents. Ann. Bot. 95(1):255–260. doi: https://doi.org/10.1093/aob/mci019.
- Hanusova, K., L. Ekrt, P. Vít, F. Kolar, T. Urfus, and P. Hohenlohe. 2014. Continuous morphological variation correlated with genome size indicates frequent introgressive hybridization among Diphasiastrum species (Lycopodiaceae) in central Europe. PLoS One 9(6):1–13. doi: https://doi.org/10.1371/journal.pone.0099552.
- Heidari, P., M. Rezaei, M. Sahebi, and A. Khadivi. 2019. Phenotypic variability of Pyrus boissieriana Buhse: Implications for conservation and breeding. Sci. Hortic. 247:1–8. doi: https://doi.org/10.1016/j.scienta.2018.11.075.
- Hofer, M., and A. Meister. 2010. Genome size variation in Malus species. J. Bot. 2010:1–8. doi: https://doi.org/10.1155/2010/874304.
- Iketani, H., T. Manabe, N. Matsuta, T. Akihama, and T. Hayashi. 1998. Incongruence between RFLPs of chloroplast DNA and morphological classification in east-Asian pear (Pyrus spp.). Genetic Resources and Crop Evolution 45(6):533–539. doi: https://doi.org/10.1023/A:1008646016181.
- Jalilian, H., A. Zarei, and J. Erfani-Moghadam. 2018. Phylogeny relationship among commercial and wild pear species based on morphological characteristics and SCoT molecular markers. Sci. Hortic. 235:323–333. doi: https://doi.org/10.1016/j.scienta.2018.03.020.
- Javadian, N., G. Karimzadeh, M. Sharifi, A. Moieni, and M. Behmanesh. 2017. In vitro polyploidy induction: Changes in morphology, podophyllotoxin biosynthesis, and expression of the related genes in Linum album (Linaceae). Planta 245(6):1165–1178. doi: https://doi.org/10.1007/s00425-017-2671-2.
- Jedrzejczyk, I., and E. Sliwinska. 2010. Leaves and seeds as materials for flow cytometric estimation of the genome size of 11 Rosaceae woody species containing DNA-staining inhibitors. J. Bot. 2010:1–9. doi: https://doi.org/10.1155/2010/930895.
- Kadkhodaei, S., K. Arzani, A. Yadollahi, and G. Karimzadeh. 2017. Preliminary assessment of cytological characters of two European pears (Pyrus communis L.) cultivars. First International Horticultural Science Conference of Iran (IrHC2017), Tehran Iran, Tarbiat Modares University (TMU), September 4–7. Abstracts Book, P-63 (200) pp 188
- Karimzadeh, G., M. Danesh-Gilevaei, and M. Aghaalikhani. 2011. Karyotypic and nuclear DNA variations in Lathyrus sativus (Fabaceae). Caryologia 64(1):42–54. doi: https://doi.org/10.1080/00087114.2011.10589763.
- Karimzadeh, G., S.H. Mousavi, M. Jafarkhani-Kermani, and M. Jalali-Javaran. 2010. Karyological and nuclear DNA variation in Iranian endemic muskmelon (Cucumis melo var. Inodorus). Cytologia 75(4):451–461. doi: https://doi.org/10.1508/cytologia.75.451.
- Khadivi, A., F. Mirheidari, Y. Moradi, and S. Paryan. 2020. Morphological and pomological characterizations of Pyrus syriaca Boiss. germplasm. Sci. Hortic. 271:109424. doi: https://doi.org/10.1016/j.scienta.2020.109424.
- Knight, C.A., N.A. Molinari, and D.A. Petrov. 2005. The large genome constraint hypothesis: Evolution, ecology, and phenotype. Ann. Bot. 95(1):177–190. doi: https://doi.org/10.1093/aob/mci011.
- Korban, S.S., W. Wannarat, C.M. Rayburn, T.C. Tatum, A.L. Rayburn, and P. Gustafson. 2009. Genome size and nucleotypic variation in Malus germplasm. Genome 52(2):148–155. doi: https://doi.org/10.1139/G08-109.
- Koushesh-Saba, M., K. Arzani, and M. Rasouli. 2017. Genetic relationship of Iranian pear genotypes with European and Asian pears as revealed by random amplified polymorphic DNA markers. Int. J. Fruit Sci. 17(1):82–89. doi: https://doi.org/10.1080/15538362.2016.1220343.
- Kumar, S., C. Kirk, C. Deng, C. Wiedow, M. Knaebel, and L. Brewer. 2017. Genotyping-by-sequencing of pear (Pyrus spp.) accessions unravels novel patterns of genetic diversity and selection footprints. Hortic. Res. 4(1):17015. doi: https://doi.org/10.1038/hortres.2017.15.
- Loureiro, J., E. Rodriguez, J. Doležel, and C. Santos. 2007. Two new nuclear isolation buffers for plant DNA flow cytometry: A test with 37 species. Ann. Bot. 100(4):875–888. doi: https://doi.org/10.1093/aob/mcm152.
- Ma, J., C.I. Amos, and M. You. 2012. Principal components analysis of population admixture. PloS One 7(7):e40115. doi: https://doi.org/10.1371/journal.pone.0040115.
- Majdi, M., G. Karimzadeh, M.A. Malboobi, R. Omidbaigi, and G. Mirzaghaderi. 2010. Induction of tetraploidy to feverfew (Tanacetum parthenium Schulz-Bip.): Morphological, physiological, cytological, and phytochemical changes. HortScience 45(1):16–21. doi: https://doi.org/10.21273/HORTSCI.45.1.16.
- Monte-Corvo, L., L. Goulão, and C. Oliveira. 2001. ISSR analysis of cultivars of pear and suitability of molecular markers for clone discrimination. J. Am. Soc. Hortic. Sci. 126(5):517–522. doi: https://doi.org/10.21273/JASHS.126.5.517.
- Najafzadeh, R., and K. Arzani. 2015. Superior growth characteristics, yield, and fruit quality in promising European pear (Pyrus communis L.) chance seedlings in Iran. J. Agric. Sci. Technol. 17(2):427–442.
- Nikzad Gharehaghaji, A., H. Abdollahi, K. Arzani, A. Shojaeiyan, M. Naghi Padasht, L. Dondini, and P. De Franceschi. 2014c. Contribution of western and eastern species to the Iranian pear germplasm revealed by the characterization of s-genotypes. Acta Hortic. 1032:159–167. doi: https://doi.org/10.17660/ActaHortic.2014.1032.21.
- Nikzad Gharehaghaji, A., K. Arzani, H. Abdollahi, A. Shojaeiyan, L. Dondini, and P.D. Franceschi. 2014a. Genomic characterization of self-incompatibility ribonucleases in the Central Asian pear germplasm and introgression of new alleles from other species of the genus Pyrus. Tree Genet. Genomes 10(2):411–428. doi: https://doi.org/10.1007/s11295-013-0696-7.
- Nikzad Gharehaghaji, A., K. Arzani, H. Abdollahi, A. Shojaeiyan, M. Henareh, P. De Franceschi, and L. Dondini. 2014b. Chloroplast genome diversity of the Pyrus genus; from Iranian and European wild pear species to the cultivated cultivars. Acta Hortic. 1032:151–158. doi: https://doi.org/10.17660/ActaHortic.2014.1032.20.
- Noori, S.A.S., M. Norouzi, G. Karimzadeh, K. Shirkool, and M. Niazian. 2017. Effect of colchicine-induced polyploidy on morphological characteristics and essential oil composition of ajowan (Trachyspermum ammi L.). Plant Cell Tiss. Org. Cult. 130(3):543–551. doi: https://doi.org/10.1007/s11240-017-1245-0.
- Paganová, V. 2009. The occurrence and morphological characteristics of the wild pear lower taxa in Slovakia. Hortic. Sci. 36(1):1–13. doi: https://doi.org/10.17221/5/2008-HORTSCI.
- Pereira-Lorenzo, S., A.R.F. Dos Santos, A.M. Ramos-Cabrer, F. Sau, and M.B. Díaz-Hernández. 2012. Morphological variation in local pears from north-western Spain. Sci. Hortic. 138:176–182. doi: https://doi.org/10.1016/j.scienta.2012.02.007.
- Podwyszyńska, M., D. Kruczyńska, A. Machlańska, B. Dyki, and I. Sowi. 2016. Nuclear DNA content and ploidy level of apple cultivars including Polish ones in relation to some morphological traits. Acta Biol. Crac. Ser. Bot. 58(1):81–93. doi: https://doi.org/10.1515/abcsb-2016-0008.
- Postman, J., N. Bassil, and R. Bell. 2015. Ploidy of USDA world pear germplasm collection determined by flow cytometry. Acta Hortic. 1094:75–81. doi: https://doi.org/10.17660/ActaHortic.2015.1094.6.
- Puskás, M., M. Hofer, R.E. Sestraş, A. Peil, A.F. Sestras, M.-V. Hanke, and H. Flachowsky. 2016. Molecular and flow cytometric evaluation of pear (Pyrus L.) genetic resources of the German and Romanian national fruit collections. Genet. Resour. Crop Evol. 63(6):1023–1033. doi: https://doi.org/10.1007/s10722-015-0298-3.
- Pustahija, F., S.C. Brown, F. Bogunić, N. Bašić, E. Muratović, S. Ollier, O. Hidalgo, M. Bourge, V. Stevanović, and S. Siljak-Yakovlev. 2013. Small genomes dominate in plants growing on serpentine soils in West Balkans, an exhaustive study of 8 habitats covering 308 taxa. Plant Soil 373(1–2):427–453. doi: https://doi.org/10.1007/s11104-013-1794-x.
- Sarikhani Khorami, S., K. Arzani, G. Karimzadeh, A. Shojaeiyan, and W. Ligterink. 2018. Genome size: A novel predictor of nut weight and nut size of walnut trees. HortScience 53(3):275–282. doi: https://doi.org/10.21273/HORTSCI12725-17.
- Sharifani, M., V. Erfani, A. Bagerian, C. Nishtani, T. Yamamoto, and T. Kimura. 2008. Mutations in chloroplast dna revealed relations and discriminations in genus Pyrus. Acta Hortic. 800(800):355–364. doi: https://doi.org/10.17660/ActaHortic.2008.800.45.
- Tarkesh Esfahani, S., G. Karimzadeh, and M.R. Naghavi. 2016. 2C DNA value of Persian poppy (Papaver bracteatum Lindl.) medicinal plant as revealed by flow cytometry analysis; quick effective criteria for distinguishing unidentified papaver species. Int. J. Adv. Biotechnol. Res. 7(2):573–578.
- Tavan, M., M.H. Mirjalili, and G. Karimzadeh. 2015. In vitro polyploidy induction: Changes in morphological, anatomical, and phytochemical characteristics of Thymus persicus (Lamiaceae). Plant Cell Tiss. Org. Cult. 122(3):573–583. doi: https://doi.org/10.1007/s11240-015-0789-0.
- Teng, Y., and K. Tanabe. 2004. Reconsideration on the origin of cultivated pears native to East Asia. Acta Hortic. 634:175–182. doi: https://doi.org/10.17660/ActaHortic.2004.634.21.
- Teng, Y., K. Tanabe, F. Tamura, and A. Itai. 2002. Genetic relationships of Pyrus species and cultivars native to East Asia revealed by randomly amplified polymorphic DNA markers. Journal of the American Society for Horticultural Science 127(2):262–270. doi: https://doi.org/10.21273/JASHS.127.2.262.
- UPOV. (2000). Guidelines for the conduct of tests for distinctness, uniformity, and stability in Pear (Pyrus communis L.). International Union for the Protection of New Varieties of Plants. Geneva, Switzerland. 43pp.
- Wang, Y., and K. Arzani. 2019. European Pear, p. 305–328. In: S.T. De Feritas and S. Pareek (eds.). Postharvest physiological disorders in fruits and vegetables. 1st. CRC Press, Taylor & Francis Group, London, United Kingdom & New York, USA.
- Wei, H., J. Li, Z. Peng, B. Lu, Z. Zhao, and W. Yang. 2008. Relationships of Aegilops tauschii revealed by DNA fingerprints: The evidence for agriculture exchange between China and the West. Prog. Nat. Sci. 18(12):1525–1531. doi: https://doi.org/10.1016/j.pnsc.2008.05.022.
- Westwood, M.N. 1993. Temperate zone pomology. 3rd. Timber Press, Portland, Oregon. p. 389.
- Yakimowski, S.B., and L.H. Rieseberg. 2014. The role of homoploid hybridization in evolution: A century of studies synthesizing genetics and ecology. Am. J. Bot. 101(8):1247–1258. doi: https://doi.org/10.3732/ajb.1400201.
- Zarei, A., J. Erfani-Moghadam, and H. Jalilian. 2019. Assessment of variability within and among four Pyrus species using multivariate analysis. Flora 250:27–36. doi: https://doi.org/10.1016/j.flora.2018.11.016.
- Zielinski, Q.B., and M. Thompson. 1967. Speciation in Pyrus: Chromosome number and meiotic behavior. Botanical Gazette 128(2):109–112. doi: https://doi.org/10.1086/336386.