
ABSTRACT
Canopy development and production efficiency variations were evaluated in four sweet cherry (Prunus avium L.) cultivars: ‘Bing’, ‘Lapins’, ‘Sweetheart’ and ‘Regina’, grafted on different vigor rootstocks: ‘Colt’, ‘Cab-6P, ‘Maxma-14’ and ‘Gisela-12’, and conducted in two training systems: Central Leader (CL) and Kym Green Bush (KGB), growing in Chile. Leaf indicators were calculated after tree defoliation. A principal components analysis (PCA) was conducted to select indicators that explain the variation among the combinations. Results showed that leaf size and number varied between different cultivar/rootstock combinations and training systems. By means of two principal components, the model employed could explain 72% of the data variability. The most relevant indicators for the PC1 were: leaf weight per hectare (0.98) and leaf area index (0.97), with a significant training system effect, whereas for the PC2 they were: leaf weight per leaf area (0.85) and production per leaf area (0.72), mainly for productive efficiency. In ‘Lapins’/‘Colt’, the KGB system presented a higher weight and leaf area than CL, with almost double the leaf weight per hectare and leaf area index, due mainly to a 37% leaf area per tree and 20% higher tree number/ha in KGB. However, average production per leaf area reached 0.49 kg m−2, without distinction between training systems.
Introduction
World sweet cherry (Prunus avium L.) production has increased in recent years and Chile is one of the countries with the greatest expansion. The current area would exceed 38,000 ha. In spite of that, this country has a limited participation in world production, but it is the main exporter of the southern hemisphere, selling nearly 230,000 tons of fruit in early 2019/2020 season (Bujdosó and Hrotkó, Citation2017; ODEPA, Citation2020).
In response to the need for greater production efficiency and profitability, growers have redesigned their orchards to more intensive plantations, introducing training systems with smaller trees planted at higher densities to improve precocity, yields, fruit quality and operating costs (Ayala and Lang, Citation2017; Lang, Citation2000). However, achieving the expected vegetative growth and productivity is technically difficult to implement (Koumanov et al., Citation2018).
Several factors affect plant growth and productivity. These include climate, soil type, water supply and mineral nutrition, as well as planting density and cultivar/rootstock combination (Lang, Citation2005; Predieri et al., Citation2003; Whiting et al., Citation2005). As planting density increases, leaf area usually increases. Therefore, the introduction of dwarfing rootstocks and new training systems have helped balance vegetative growth and fruit production (Gainza et al., Citation2015; Lang, Citation2000; Long, Citation2001; Robinson, Citation2005).
The new, more intensive, training systems modify canopy architecture, seeking to optimize light interception and distribution in trees, thus favoring flower bud formation and plant carbohydrate assimilation. Consequently, fruit production and quality improvements are achieved (Ayala and Lang, Citation2004; Lang, Citation2005; Radunic et al., Citation2011; Zhang et al., Citation2012). These new systems also facilitate the design of pedestrian orchards, enabling manual labor and cultural practices (Ayala and Lang, Citation2017).
Among others, the introduction of high and medium density training systems, such as Upright Fruiting Offshoots (UFO), Tall Spindle Ax (TSA) and Kym Green Bush (KGB), have provided good productive results for Chile, specifically regarding labor efficiency during harvesting. However, further improvements are required for their adaptation (Donoso et al., Citation2019).
The leaf area index (LAI), defined as the leaf area per unit of land area ratio (Watson, Citation1947), is among the most used indicators to evaluate vegetative growth and production efficiency between cultivars and training systems (Chen and Black, Citation1991; Wünsche and Lakso, Citation2000). Similarly, the leaf/fruit ratio is another key indicator for describing production efficiency and fruit quality (Cittadini et al., Citation2008, Citation2007).
The purpose of this study was to evaluate foliar indicators in some of the main sweet cherry cultivars growing in Chile, in two training systems: a traditional Central Leader (CL) system and the more intensive KGB system, aimed at describing canopy development variations and production efficiency, under edaphoclimatic conditions in central Chile.
Materials and Methods
Plant Material and Experiment
The study was carried out during the 2017/18 season in two commercial orchards in the Maule Region, Chile: one located in Curicó (35°01ʹ S; 71°11ʹ W; 247 m.a.s.l.), with the sweet cherry cultivars ‘Lapins’, ‘Sweetheart’ and ‘Regina’ in CL system; and another located in Pencahue (35°26ʹ S; 71°52ʹ W; 48 masl), with the cultivars ‘Lapins’ and ‘Bing’ in KGB system.
In Curicó the soil type was deep and of clay loam texture with pH 6.6, while in Pencahue it was thinner and stony with pH 6.4. Meteorological conditions of the evaluated season are summarized in . Mathematical expressions for the calculation of Chill Units (Modified and Positive Utah models) are described in Darbyshire et al. (Citation2011), and those for thermal accumulation (GDH and GDD) in Darbyshire et al. (Citation2013). Rainfall was concentrated between June and August in both localities. Pencahue showed a warmer microclimate than Curicó, with slightly less cold accumulation in winter, and more heat during the fruit growth period, until December. Plantation background is presented in . In both orchards, pruning, thinning, fertilization, sanitary control and irrigation were executed according to respective commercial standards.
Table 1. Climatic variables during the evaluated season for Curicó and Pencahue, Chile
Table 2. Background of the sweet cherry cultivars plantation used in the study
A random selection of three healthy, homogeneously vigorous trees was made, representing each cultivar and training system (each tree as a replicate). Assessments were conducted at post-harvest, the peak time of vegetative expression (125 days after full bloom (DAFB)).
Plant and Production Evaluations
Evaluations included the description of foliar indicators for each cultivar and training system. A complete tree defoliation was performed manually on each tree (see ). Leaf totals were collected from each tree and weighed using a scale. These were then stored in a cooler and taken to the laboratory for immediate analysis.
Figure 1. Sweet cherry tree ‘Lapins’, ‘Sweetheart’ and ‘Regina’ formed in CL (above) before manual defoliation and (below) after manual defoliation. Curicó, Chile
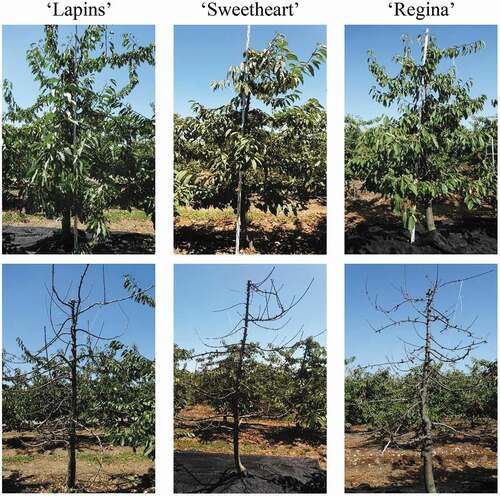
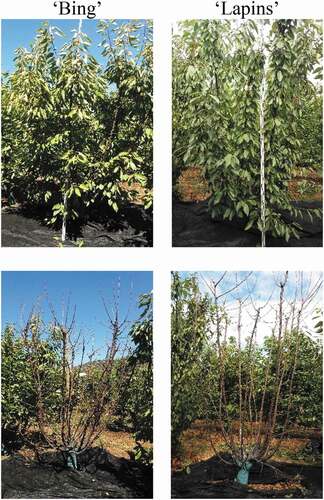
Figure 2. Sweet cherry ‘Bing’ and ‘Lapins’ formed in KGB (above) before manual defoliation and (below) after manual defoliation. Pencahue, Chile
Foliar indicators were estimated in a 50 g leaf sample per tree, in which the number of leaves was counted and the leaf area (cm2) was measured with a LI-3100 equipment (LI-COR, Inc., Lincoln, NE, USA). Finally, the dry weight (g) and dry matter (%) were calculated in a forced air-drying oven.
Estimates considered that each sample was proportional to the fresh leaf weight per tree (LWT). Accordingly, gravimetric relations were made to determine: leaf dry weight per tree (LWDT), leaf number per tree (LNT), leaf area per tree (LAT), leaf fresh weight per leaf (LW), leaf dry weight per leaf (LWD), leaf dry matter per leaf (DML), leaf area per leaf (LA), fresh leaf weight per leaf area (LW/A). On the other hand, and according to the planting distance, the leaf area index (LAI) was determined as the quotient between the leaf area and the assigned soil area per tree to .
Orchard yield (Yield ha−1) was obtained from the fruit weight per hectare. This was used to estimate tree yield (Yield tree−1) according to planting density. In addition, orchard yield was used to determine fruit yield per leaf area (Yield/LA). Fresh leaf weight per fruit (LW/F), leaves number per fruit (LN/F) and leaf area per fruit (LA/F) were estimated based on the standard weight of 10 g per fruit.
Data Analysis
A principal component analysis (PCA) was performed on the data using Unscrambler X 10.5.1 (CAMO Software AS, Oslo, Norway). A total of 23 leaf and production efficiency indicators were included. A standardization of continuous variables (n = 19) was made: a/(SDev+b) (a = 1; b = 0; Sdev: standard deviation) and the rest (n = 4) were categorical variables. Cross validation was performed with the NIPALS algorithm, with 15 segments and 100 iterations, at full mode, per segment. The warning levels were: 0.5 for the calibrated to validated residual variance ratio; 0.75 for the validated to calibrated residual variance ratio; and 6.0% for the residual variance increase limit (Eriksson et al., Citation2014; Wold, Citation1976). Scores plot with the Hotelling’s limit to detect outliers and correlations loadings obtain the importance of the different variables. The outer ellipse is the unit circle and indicates 100% explained variance. The inner ellipse indicates 50% of explained variance. In addition, an analysis of variance (ANOVA) was carried out to analyze foliar indicator differences with greater impact in the PCA, between the training systems in the cv. Lapins, by using the Statgraphics Centurion XVI software (Warrenton, Virginia, USA). Averages were compared using the Tukey HSD 95% test (α = 0.05).
Results and Discussion
Leaf size varied among the different cultivar/rootstock combinations and training systems, whose values ranged from 1.2–1.6 g LW to 46–63 cm2 LA, being higher in ‘Bing’/‘Gisela-12’ in KGB (). Research indicates that leaf size can be affected by tree vigor, which depends not only on genotype, but also on growing conditions and management practices (Gonçalves et al., Citation2008; Jung and Choi, Citation2010; Webster, Citation1995). The LNT in the CL system, at the tree level, showed high variation among cultivar/rootstock combinations, reaching 3,640 in ‘Regina’/‘Maxma-14’ and 5,140 in ‘Sweetheart’/‘Cab-6P’. In contrast, the LNT in KGB showed minimal variation, averaging 5,700 among cultivar/rootstock combinations. In turn, the LAI in CL ranged from 1.9–2.1 while in KGB it was 3.7–4.1.
Table 3. Foliar indicators for the sweet cherry cultivar/rootstock combinations according to training system (CL and KGB). Leaf samples were taken 125 days after full bloom
The LW/A in the CL system showed minimal variation among cultivar/rootstock combinations, averaging 26 mg cm−2. In contrast, in KGB the cultivar/rootstock combinations did show differences, with an LW/A of 27 mg cm−2 in ‘Bing’/‘Gisela-12’ versus 19 mg cm−2 in ‘Lapins’/‘Colt’. A similar response was reported by Gyeviki et al. (Citation2012) regarding rootstock vigor influence.
In Chile, ‘Colt’ is the most-used rootstock in orchards. Although it adapts to a wide soil variety, it induces a lot of vigor, thus decreasing precocity (Donoso et al., Citation2019). On the other hand, ‘Gisela-12’ is a less vigorous rootstock than ‘Colt’, it promotes precocity and is recommended for more intensive systems (Lang, Citation2000).
presents the foliar indicators related to productive efficiency. Yield/LA in ‘Sweetheart’/‘Cab6’ formed in CL system showed the highest values (0.66 kg m−2) while ‘Lapins’/‘Colt’ in KGB showed the lowest values (0.44 kg m−2). LN/F was very similar among cultivar/rootstock combinations, with values ranging from 3.5–3.7. Ayala and Lang (Citation2017) note that a balanced sweet cherry tree should have approximately 5.5 LN/F for optimum fruit size and quality (10 to 12 g) and at least 200 cm2 LA/F for optimum source-sink ratio. In this study, LA/F values ranged from 161–231 cm2 in the different cultivar/rootstock combinations, with ‘Lapins’/‘Colt’ and ‘Sweetheart’/‘Cab6’ reaching values below the recommended ones, with LA of 53 and 46 cm2, respectively.
Table 4.. Production efficiency indicators for the sweet cherry cultivar/rootstock combinations according to training system (CL and KGB). Leaf samples were taken 125 days after full bloom
For each training system, productive efficiency depends on its light intercepting ability and on how the tree converts that energy into assimilates (Jung and Choi, Citation2010; Robinson and Lakso, Citation1991). Vigorous trees, with a high leaf area/fruit ratio, show excessive vegetative growth and high shading. Orchards under these conditions enter production later and obtain lower yields (Ayala and Lang, Citation2017). However, fruit quality can be affected by a low leaf/fruit ratio, due to photoassimilates reduced availability, and maturity can be delayed (Usenik et al., Citation2010; Whiting and Lang, Citation2004).
In order to evaluate both training systems efficiency, a PCA was conducted with the foliar and production efficiency indicators of the different cultivar/rootstock combinations. The model was able to explain 72% of the data variability, reducing the analyzed vegetative variables into two principal components ().
Figure 3. Principal component analysis based on foliar and productive efficiency indicators in sweet cherry trees. a: scores plot with Hotelling’s T2 ellipse for cultivar/rootstock combinations and training system clusters (CL system: blue inner ellipse on II and III quadrant; KGB system: green inner ellipse on I and IV quadrant). b: correlations loadings show the most importance variables for the model. The outer ellipse indicates 100% explained variance and the inner ellipse indicates 50% of explained variance. DML: Leaf dry matter; LW: Leaf weight; LWD: Leaf dry weight; LWT: Leaf weight per tree; LWDT: Leaf dry weight per tree; LNT: Leaf number per tree; LA: Leaf area; LAT: Lear area per tree; LW/A: Leaf weight per leaf area; LAI: Leaf area index; Yield ha−1: Yield per hectare; Yield tree−1: Yield per tree; LN/F: Leaf number leaves per fruit; LW/F: Leaf weight per fruit; LA/F: Lear area per fruit; LW ha−1: Leaf weight per hectare; LWD ha−1: Leaf dry weight per hectare; LA ha−1: Leaf area per hectare; Yield/LA: Yield per leaf area
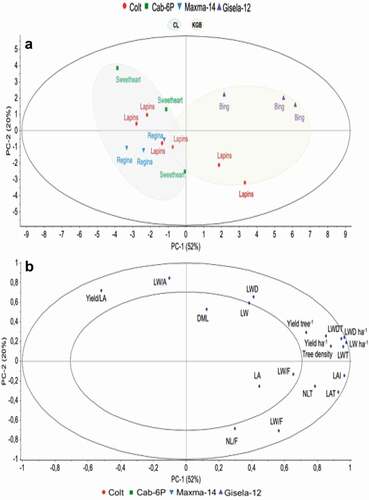
All individual variables showed at .b had a positive correlation associated with external factors projection (location, cultivar, training system and rootstock), grouped around the first and fourth quadrant except Yield/LA and LW/A. The first component (PC1) explained 52% of the data variability, showing a strong effect withthe training system (CL and KGB) (.a). For the PC1 the most important variables were: LW ha−1 (0.98), LAI (0.97), LWD ha−1 (0.97), LWT (0.96), LWDT (0.95) and LAT (0.93). The ‘Bing’ cultivar grafted on ‘Gisela-12’ was the combination that best associated these indicators with values very close to 1, considering the ‘training system’ external factor (.b). The same ascending pattern occurred in the other combinations from the third to the first quadrant.
The second component (PC2) explained 20% of the data variability, and was related to productive efficiency parameters, such as LW/A (0.85) and Yield/LA (0.72). These showed, also, a high inverse correlation with another productive efficiency parameter (LA/F: −0.71), without clear differences among external factors.
The most relevant leaf and production efficiency indicators, identified through the PCA, were compared in both training systems of ‘Lapins’/‘Colt’ cultivar (). Results showed a higher vegetative development in KGB, with an LAI of almost double CL, due mainly to 37% LAT and 20% more trees/ha in KGB. Similarly, the LW ha−1 was higher in KGB with 7.1 t against 4.9 t in CL.
Table 5.. Foliar and productive efficiency indicators in sweet cherry trees ‘Lapins’/‘Colt’ conducted in CL and KGB
Unlike CL, which combines growth in a single axis, KGB allows for the natural vigor of the sweet cherry tree to be diluted in multiple vertical branches (Lang, Citation2001). The difference in canopy architecture allows the KGB system to develop significantly higher foliar indicators, even though each tree has a smaller soil area.
In this context, Yuri et al. (Citation2011) showed that the reduction in tree height led to a leaf density increase, without decreasing the LAI, in apple trees ‘Ultra Red Gala’ on semi-vigorous rootstock. This allowed to improve canopy light distribution, increase production efficiency and facilitate harvesting tasks. However, the central axis training system was maintained.
In contrast, the LW/A was higher in the CL system, reaching 25 mg cm−2 versus 19 mg cm−2 in KGB. Gonçalves et al. (Citation2008) observed that sweet cherry trees with denser crown, and less light transmission, presented a lower LW/A, mainly associated to a lower leaf thickness.
In spite of the differences observed in the vegetative development, the Yield/LA did not show significant differences between training systems, reaching values between 0.44–0.54 kg m−2. Cittadini et al. (Citation2007) pointed out that for an LAI of 3.07, in ‘Bing’/‘Mahaleb’ cherry trees, the highest economic income would be obtained with a Yield/LA of 0.8 kg m−2, which would correspond to almost double that obtained in this study.
Conclusions
Leaf weight and leaf area showed variations in the different cultivar/rootstock combinations and training systems evaluated. The statistical model used was able to explain 72% of the data variability. Foliar indicators with greater variation for the PC1 were leaf weight per hectare (0.98) and leaf area index (0.97), with a significant effect of the training system, whereas those for the PC2 were leaf weight per leaf area (0.85) and production per leaf area (0.72), mainly associated to productive efficiency.
In the cv. Lapins major differences were observed in leaf area per tree, fresh leaf weight per leaf area, leaf area index and fresh leaf weight per hectare between both training systems, CL and KBG. In KGB, the leaf area index was almost double compared to CL, due mainly to a 37% increase in the leaf area per tree and a 20% increase in tree/ha. These factors led to a production efficiency decrease, although without significant differences, with an average of 0.49 kg m−2 between training systems.
The findings of this study provide a diagnosis of the main foliar indicators of different cultivar/rootstock combinations, and quantify the changes of these variables in different training systems, providing thus a reference to describe the production efficiency of sweet cherry orchards in Chile.
Acknowledgments
The authors express their gratitude to the companies Agropecuaria Wapri S.A., Highland Fruit S.A., and to the Fundación para la Innovación Agraria (FIA) for their contribution.
Disclosure Statement
No potential conflict of interest was reported by the author(s).
References
- Ayala, M., and G.A. Lang. 2004. Examining the influence of different leaf populations on sweet cherry fruit quality. Acta Hortic. 636:481–488. doi: https://doi.org/10.17660/ActaHortic.2004.636.59.
- Ayala, M., and G.A. Lang. 2017. 12. Morphology, Cropping Physiology and Canopy Training, p. 269–304. In: J. Quero-García, A. Iezzoni, J. Pulawska, and G.A. Lang (eds.). Cherries: Botany, Production and Uses. CAB International, Boston, MA.
- Bujdosó, G., and K. Hrotkó. 2017. Cherry Production, p. 1–13. In: J. Quero-García, A. Iezzoni, J. Pulawska, and G.A. Lang (eds.). Cherries: Botany, Production and Uses. CAB International, Boston, MA.
- Chen, J.M., and T.A. Black. 1991. Measuring leaf area index of plant canopies with branch architecture. Agric. For. Meteorol. 57(1–3):1–12. doi: https://doi.org/10.1016/0168-1923(91)90074-Z.
- Cittadini, E.D., H. van Keulen, P.L. Peri, and N. de Ridder. 2007. Designing a “target-tree” for maximizing gross value of product in Patagonian sweet cherry orchards. Int. J. Fruit Sci. 6(3):3–22. doi: https://doi.org/10.1300/J492v06n03_02.
- Cittadini, E.D., P.L. Peri, N.D. Ridder, and H.V. Keulen. 2008. Relationship between fruit weight and the fruit-to-leaf area ratio, at the spur and whole-tree level, for three sweet cherry varieties. Acta Hortic. 795(795):669–672. doi: https://doi.org/10.17660/ActaHortic.2008.795.105.
- Darbyshire, R., L. Webb, I. Goodwin, and E.W.R. Barlow. 2013. Evaluation of recent trends in Australian pome fruit spring phenology. Int. J. Biometeorol. 57(3):409–421. doi: https://doi.org/10.1007/s00484-012-0567-1.
- Darbyshire, R., L. Webb, I. Goodwin, and S. Barlow. 2011. Winter chilling trends for deciduous fruit trees in Australia. Agric. For. Meteor. 151(8):1074–1085. doi: https://doi.org/10.1016/j.agrformet.2011.03.010.
- Donoso, J.M., G. Lemus, D. Arribillaga, and B. Sagredo. 2019. Evolution of the sweet cherry industry in Chile. Acta Hortic. 1235:141–148. doi: https://doi.org/10.17660/ActaHortic.2019.1235.18.
- Eriksson, L., J. Trygg, and S. Wold. 2014. A chemometrics toolbox based on projections and latent variables. J. Chemom. 28(5):332–346. doi: https://doi.org/10.1002/cem.2581.
- Gainza, F., I. Opazo, V. Guajardo, P. Meza, M. Ortiz, J. Pinochet, and C. Muñoz. 2015. Rootstock breeding in Prunus species: Ongoing efforts and new challenges. Chil. J. Agric. Res. 75:6–16. doi: https://doi.org/10.4067/S0718-58392015000300002.
- Gonçalves, B., C.M. Correia, A.P. Silva, E.A. Bacelar, A. Santos, and J.M. Moutinho-Pereira. 2008. Leaf structure and function of sweet cherry tree (Prunus avium L.) cultivars with open and dense canopies. Sci. Hortic. 116(4):381–387. doi: https://doi.org/10.1016/j.scienta.2008.02.013.
- Gyeviki, M., K. Hrotkó, and P. Honfi. 2012. Comparison of leaf population of sweet cherry (Prunus avium L.) trees on different rootstocks. Sci. Hortic. 141:30–36. doi: https://doi.org/10.1016/j.scienta.2012.03.015.
- Jung, S.K., and H.S. Choi. 2010. Light penetration, growth, and fruit productivity in ‘Fuji’ apple trees trained to four growing systems. Sci. Hortic. 125(4):672–678. doi: https://doi.org/10.1016/j.scienta.2010.05.027.
- Koumanov, K.S., I.N. Staneva, G.D. Kornov, and D.R. Germanova. 2018. Intensive sweet cherry production on dwarfing rootstocks revisited. Sci. Hortic. 229:193–200. doi: https://doi.org/10.1016/j.scienta.2017.11.009.
- Lang, G.A. 2000. Precocious, dwarfing, and productive—how will new cherry rootstocks impact the sweet cherry industry? HortTechnology 10(4):719–725. doi: https://doi.org/10.21273/HORTTECH.10.4.719.
- Lang, G.A. 2001. Critical concepts for sweet cherry training systems. The Comp. Fruit Tree 34(3):70–73.
- Lang, G.A. 2005. Underlying principles of high density sweet cherry production. Acta Hortic. 325–336. doi: https://doi.org/10.17660/ActaHortic.2005.667.47.
- Long, L.E. 2001. Cherry training systems: Selection and development. Ore. State Univ., PNW Ext. Publ. 543.
- ODEPA, 2020. Base de datos comercio exterior, https://www.odepa.gob.cl (Access date: 10 September 2020).
- Predieri, S., R. Dris, L. Sekse, and F. Rapparini. 2003. Influence of environmental factors and orchard management on yield and quality of sweet cherry. J. Food Agric. Environ. 1(2):263–266. doi: https://doi.org/10.1234/4.2003.377.
- Radunic, M., A. Jazbec, M. Pecina, T. Čosić, and N. Pavičic. 2011. Growth and yield of the sweet cherry (Prunus avium L.) as affected by training system. Afr. J. Biotechnol. 10(24):4901–4906.
- Robinson, T.L. 2005. Developments in high density sweet cherry pruning and training systems around the world. Acta Hortic. (667):269–272. doi: https://doi.org/10.17660/ActaHortic.2005.667.39.
- Robinson, T.L., and A.N. Lakso. 1991. Bases of yield and production efficiency in apple orchard systems. J. Amer. Soc. Hortic. Sci. 116(2):188–194. doi: https://doi.org/10.21273/JASHS.116.2.188.
- Usenik, V., P. Orazem, and F. Stampar. 2010. Low leaf to fruit ratio delays fruit maturity of ‘Lapins’ sweet cherry on Gisela 5. Sci. Hortic. 126(1):33–36. doi: https://doi.org/10.1016/j.scienta.2010.06.008.
- Watson, D.J. 1947. Comparative physiological studies on the growth of field crops: I. Variation in net assimilation rate and leaf area between species and varieties, and within and between years. Ann. Bot. 11(41):41–76. doi: https://doi.org/10.1093/oxfordjournals.aob.a083148.
- Webster, A.D. 1995. Rootstock and interstock effects on deciduous fruit tree vigour, precocity, and yield productivity. N. Z. J. Crop Hortic.Sci. 23(4):373–382. doi: https://doi.org/10.1080/01140671.1995.9513913.
- Whiting, M.D., G. Lang, and D. Ophardt. 2005. Rootstock and training system affect sweet cherry growth, yield, and fruit quality. HortScience 40(3):582–586. doi: https://doi.org/10.21273/HORTSCI.40.3.582.
- Whiting, M.D., and G.A. Lang. 2004. ‘Bing’ sweet cherry on the dwarfing rootstock ‘Gisela 5ʹ: Thinning affects fruit quality and vegetative growth but not net CO2 exchange. J. Amer. Soc. Hortic. Sci. 129(3):407–415. doi: https://doi.org/10.21273/JASHS.129.3.0407.
- Wold, S. 1976. Pattern recognition by means of disjoint principal components models. Pattern Recognit. 8(3):127–139. doi: https://doi.org/10.1016/0031-3203(76)90014-5.
- Wünsche, J.N., and A.N. Lakso. 2000. The relationship between leaf area and light interception by spur and extension shoot leaves and apple orchard productivity. HortScience 35(7):1202–1206. doi: https://doi.org/10.21273/HORTSCI.35.7.1202.
- Yuri, J.A., M. Ibarra-Romero, J.L. Vásquez, V. Lepe, J. González-Talice, and A. Del Pozo. 2011. Reduction of apple tree height (Malus domestica Borkh) cv. Ultra Red Gala/MM111 does not decrease fruit yield and quality. Sci. Hortic. 130(1):191–196. doi: https://doi.org/10.1016/j.scienta.2011.06.036.
- Zhang, J., R. Luo, P. Scharf, M. Whiting, and Q. Zhang. 2012. Canopy architecture affects light interception in sweet cherry your. ASABE Ann. Int. Meeting. (2012):1511–1521. doi: https://doi.org/10.13031/2013.41789.