
 ?Mathematical formulae have been encoded as MathML and are displayed in this HTML version using MathJax in order to improve their display. Uncheck the box to turn MathJax off. This feature requires Javascript. Click on a formula to zoom.
ABSTRACT
This study was carried out to investigate the optimum level of ingredients to develop an acceptable jam product from yellow passion fruit. The jam was developed from fresh yellow passion fruit using four ingredients: sugar, pectin and citric acid of different levels. The different ingredient levels were optimized using response surface methodology (RSM). A uniform precision type Box-Behnken design consisting of three variables in a three-level pattern with 17 runs (with five center points) was employed to optimize the jam to obtain a product with adequate sensory acceptability, especially, overall acceptability. Sensory analysis for appearance, color, flavor, sweetness, taste, texture and overall acceptability was performed. Jam produced under the optimum conditions was subjected to sensory evaluation, and the results were compared with the RSM predictions. Data obtained from RSM were subjected to the analysis of variance (ANOVA) using a second-order polynomial equation. Results showed that the model fit was significant (p < .05) for appearance, flavor, taste, sweetness and even highly significant (p < .01) for texture, color and overall acceptability. There was also a satisfactory correlation between actual and predicted values. Depending on the best sensory score obtained, the optimum ingredient levels were 400 g/kg, 5.24 g/kg and 1 g/kg for sugar, pectin and citric acid, respectively.
Introduction
Passion fruit (Passiflora edulis) is an exotic tropical fruit that belongs to the Passifloraceae family (Samyor et al., Citation2020). Among the different species, two well-known edible passion fruit species are purple (Passiflora edulis Sims) and yellow (Passiflora edulis f. flavicarpa Deg.) (Samyor et al., Citation2020). Yellow-type fruits are generally larger than the purple type with yellow mottled spots and turn golden yellow during ripening, whereas purple type attains deep purple color.
There is a lot of evidence that passion fruit could be a powerful medicinal source. Nowadays people are more concerned about their health, demand for passion fruit juice is increasing not only because of its exotic flavor but also for its high nutritional and medicinal properties. Passion fruit is a prime source of bioactive compounds, which could extenuate oxidative stress. Some phenolic compounds identified in passiflora species showed therapeutic effects like immune modulation, anticarcinogenic and antioxidant activities (Brandão et al., Citation2020; Da Silva et al., Citation2014). The juice contains a very good proportion of acids, sugars, vitamin-A, fiber, phenolic compounds, ascorbic acid (Brandão et al., Citation2020; Ramaiya et al., Citation2019) and minerals such as sodium, magnesium, sulfur and chlorides.
Increased demand for exotic fruits has given rise to a greater variety of products on the market. The development of fruit products from the underutilized fruits in Ethiopia offers another alternative for the exploitation of these resources, to supplement their nutritional value and promote the new export channels. Recently, researchers have shown an increased interest in less expensive post-harvest technologies to reduce the loss of fruits and to encourage large-scale processing and availing the products during off-seasons (Dereje and Abera, Citation2020; Dubey et al., Citation2021; Golpour et al., Citation2020). Therefore, processing the juice into an aggregate valued product such as jam becomes an alternative for the use of the fruit at the ripening stage, as it would enable the valorization and help avoid post-harvest losses (Ngoh Newilah et al., Citation2020; Ogunlade and Oluwafemi, Citation2021). However, there is little or no knowledge of the use of jams or any associated products of passion fruits in Ethiopia.
Jam is a food product with an intermediate moisture content (semi-solid) made by cooking fruits with sugar (with or without added pectin and acid) to raise the total soluble solid content to >65% (Dubey et al., Citation2021; Kaunsar and Pavuluri, Citation2018; Neha et al., Citation2019). The authors also stated that fruit has most of the ingredients in acidity and pectin, which are extracted during cooking. In traditional jam making, sugar plays a technological role and influences the soluble content of solids, which is essential for jams’ physical, chemical and sensory properties and also increases their microbiological stability and safety (Neha et al., Citation2019). However, the quality of the end product depends on different factors, like the fruit type and variety, pH, sugar content, pectin type and concentration and process parameters. Although some research has been carried out on the nutritional composition of passion fruits, there is very little scientific understanding of the optimization of ingredient level for developing yellow passion fruit jam. Thus, this study was initiated to optimize the level of ingredients used for jam production from passion fruits grown in Ethiopia.
Materials and Methods
Raw Material
The plant material used for this study was fully ripe yellow passion fruit variety that was obtained from Awash Agro-Industry which is located 150 km southeast of Addis Ababa. Additional ingredients like sugar, pectin (Purix powdered pectin) and citric acid were purchased from commercial suppliers (Merck and SD fine chemical suppliers) found in Addis Ababa.
Experimental Plan
The Box-Behnken followed by response surface methodology (RSM) was used to develop the relationship between the variables and optimize experimental conditions for jam production. The experimental design was planned with three factors (x1 is sugar, x2 is pectin and x3 is citric acid), which were considered in three levels. The three levels of these variables and the coded and actual values of ingredients in each experiment are given in , respectively. Each treatment was done at three different levels. The jam was produced from different levels of ingredients using juice extracts from the passion fruit, and the produced jams were analyzed.
Table 1. Box-Behnken experimental design with three variables.
Table 2. Actual levels and codes of the ingredients for all the test runs of the experiment.
The values of independent coded factors were calculated by using the following formula:
Preparation of Passion Fruit Jam
The jam was prepared as showed in . One kilogram of yellow passion fruit was sorted and washed. Then, the fruits were cut into half with a stainless steel knife and the pulp was scooped out with a spoon into an extractor. Passion fruit juice was extracted by churning the pulp at the low speed of the extractor for about 5 s to avoid the chipping of seeds in a food processor. The mixed content was then filtered using a muslin cloth to separate the juice. The rate of mixing clear fruit juice with ingredients was at 50% by weight with sugar and pectin and citric acid. The prepared yellow passion fruit juice and sugar mixture were heated in a stainless steel pan on the electric stove. Pectin was being added under manual agitation into boiling water for 2 min to allow proper pectin hydration. The required quantity of mixtures was added and heating was continued. The contents of the pan were stirred continuously to prevent the mixture from sticking to the bottom of the pan. The mixture boiled to a final concentration of 65 to 68 °Brix at a temperature of 90 to 105°C (final boiling point) and for 20 to 25 min.
Figure 1. Process flow chart for the development of yellow passion fruit jam.
The boiling mixture was checked for the right consistency with the help of a spoon test. Stainless steel spoons were first kept in the freezing compartment of a refrigerator before the test. To check the consistency, a spoon was withdrawn from the refrigerator and a small quantity of jam was taken out with it, left aside for a minute and then checked if the jam spills from it when the spoon was held in the upright position. If the jam spilt, more cooking was done and at that time citric acid was added. As soon as the desired texture was obtained the heating was stopped. The jam was immediately removed from heating and was poured into a sterilized 1 L volume glass jar which was used for packaging the developed passion fruit jam product. The lid of the glass jar was tightly closed and was cleaned with tap water and stored at room temperature.
Data Collection
Proximate Composition
Proximate composition, namely moisture, crude protein, crude fat, crude fiber, crude ash and utilizable carbohydrate of passion fruits and jam, was determined by AOAC 2005 methods.
pH, Total Soluble Solids and Titratable Acidity
The pH of the fresh fruits and jam was determined using a pH meter. 5 g of fruit and jam was dissolved in 25 mL of distilled water and the sample was placed in a beaker. The pH of the sample was measured by dipping the electrode of a digital pH meter into the samples after proper calibration of the pH meter with the standard buffer solutions of 4.0 and 7.0 pH. The pH meter was rinsed with distilled water immediately after use before proceeding to the next sample.
Total soluble solids for passion fruit and jam were determined by AOAC (Citation2005) official method using a hand refractometer. The refractometer was checked for accuracy before use, and this was done by placing few drops of distilled water on the prism in the specimen chamber of the refractometer with the help of a glass rod after folding back the cover. By looking through the eyepieces with the projection inlet facing toward the light, the point on the scale is noted when the boundary line of the shaded area intersects with the unshaded area. For determining the TSS, a drop of the sample was placed on the prism and threading was taken.
Ten grams of fruit and jam were diluted to 250 mL using distilled water. An aliquot of 50 mL was mixed with phenolphthalein indicator (2–3 drops) and titrated with 0.1 N NaOH solution to the first appearance of a pink color endpoint. TA was expressed as g citric acid per 100% of fruit jam using the following formula:
Vitamin C (Total Ascorbic Acid)
AOAC (Citation2005) method was used for the determination of vitamin C in yellow passion fruit juice samples. Ascorbic acid was calculated as follows:
E = Ascorbic acid equivalent of the dye in mg/ml;
V = ml of the dye indicator used in the titration (VR);
V1 = Volume to which the fruit juice is diluted (500 ml);
V2 = Volume of filtrate taken for the titration (10–20 ml);
W = Weight or volume of fruit juice initially taken for the determination
Sensory Evaluation
A panel of 30 (10 females and 20 males) members were selected from the staff, undergraduate and graduating class students of Food Science and Process Engineering and Technology programs of Haramaya University who have experience and knowledge on sensory evaluation of food. The sensory evaluation was conducted 24 h after the time of preparation. The samples were evaluated at room temperature and under cool white fluorescent lighting. Spoons were provided to the panelists for making jams from the plate. The order of presenting the samples of prepared fruit jam was randomized and coded with randomly selected three-digit numbers labeled on the plate. Just before each test, orientation was given to the panel members on the procedure of sensory evaluation. The panelists were requested to rinse their mouth with water in between testing different samples and provision was arranged for the same. Conversation or any other form of exchange of ideas was not allowed between panelists during the test. The panelists were asked to evaluate the descriptors, rating each sample on a seven-point hedonic scale. The sensory method employed was a seven-point hedonic scale to assess the overall appearance, color, taste, texture, flavor, sweetness and overall acceptability. The sensory score levels included: like extremely = 7, like moderately = 6, like slightly = 5, neither like nor dislike = 4, dislike slightly = 3, dislike moderately = 2, dislike extremely = 1.
Statistical Analysis
Upon the completion of experiments, the scores of the sensory evaluation of passion fruit jam for appearance, color, flavor, taste, sweetness, texture and overall acceptability were taken as the response (Y). A regression analysis of the data was carried out for obtaining an empirical model that relates the response measured to the independent variables. The second-order polynomial equation was fitted to the experimental data of each dependent variable as given below:
Where:
y – Response variable as a function of regression
n – number of factors
X1 – Sugar
X2 – Pectin
X3 – Citric acid
β0 – Constant term
βi, βii, βij – Regression coefficients.
£ – Random error
The percent error in prediction was also calculated using the following formula
Analysis of variance, regression constants and coefficient of determination (R2) was done using Design-Expert statistical software (Trial Version 10.0.6.0 State-Ease, Inc., Minneapolis MN, USA). The validity of models was tested, and the effect of variables on the sensory acceptability scores was interpreted.
Multiple response optimization software was used to determine the optimum condition. Contour plots were generated to show the effect of sugar, pectin and citric acid on the overall acceptability scores of passion fruit jam. These contour plots were generated for different interactions of any two independent variables while holding the value of the third variable as constant (at the central value). Such three-dimensional surfaces could give accurate geometrical representation and provide useful information about the behavior of the system within the experimental design.
Results and Discussion
Physicochemical Properties of Yellow Passion Fruit Juice
The physicochemical properties of the fruits play an important role in product development and affect the final quality of the product. Data of the physicochemical analysis of the yellow passion fruit are presented in . The research found that the moisture content of yellow passion fruit was 83.5%. This result was the nearer agreement with the reported value (84.7%) for yellow passion fruit by Ramaiya et al. (Citation2019). shows that the pH value of yellow passion fruit juice was 3.2. The value found in this study was in agreement with the 3.4 reported by Joy (Citation2010). The result indicated that the juice was fairly acidic. It might be due to the organic acids, such as citric and malic acid, which are also indicators of the freshness of fruits and are used as common parameters to evaluate the quality of fruit. The titratable acidity of yellow passion fruit was 2%. The acids influence the flavor, brightness of color, stability, consistency and keeping quality of the product (Adebooye et al., Citation2006). The organic acid in the juice increases the titratable acidity could be due to the presence of preservatives.
Table 3. Physicochemical properties of yellow passion fruit.
The research found that the TSS of yellow passion fruit juice was 19.5 °Brix (). The soluble solid content is one of the most important quality parameters in processing fruits and is used in characterizing the quality of juice (Obasi et al., Citation2017). The ascorbic acid or vitamin C is important water-soluble vitamin already implicated in most of the life processes but principally functions as an antioxidant (Iqbal et al., Citation2004) and it is present abundantly in fruits and vegetables. The protein content of the yellow passion fruit juice was 2.7%. This value was in agreement with the reported value (2.8%) for yellow passion fruit juice by Ramaiya et al. (Citation2019). In general, low protein content is a common characteristic of fruits.
The fat content of the yellow fruit juice was 0.06%. The fruit contains much less amount of fat when compared to other fruits grape 0.2%, banana 0.1%, avocado 0.23% and olive 0.3% (Vincente et al., Citation2014). The result in shows that the crude fiber content of yellow passion fruit was 3.5%. This value is in close agreement with 3.3% reported by Ramaiya et al. (Citation2019) for passion fruits. In this study, fruit contains a high amount of fiber when compared with 0.2% yellow passion fruit fiber forward by He et al. (Citation2020).
As shown in , the ash content of the yellow passion fruit was 0.4%. This value was in agreement with the report 0.48% for ash content of yellow passion fruit reported by Ramaiya et al. (Citation2019). The ash content of yellow passion fruit juice was lower as compared to banana and guava fruits but higher than the oranges (0.44%), papaya (0.39%) and pineapple (0.22%). The high ash content in the juice sample means that the fruit contains a high content of various minerals, which is expected to accelerate metabolism and improve growth and development (Bello et al., Citation2008). The utilizable carbohydrate content of the yellow passion fruit was 9.3%.
Sensory Evaluation of Yellow Passion Fruit Jam
Sensory scores for different attributes, namely appearance, color, flavor, taste, texture and overall acceptability, are reported in .
Table 4. Actual and predicted sensory evaluation yellow passion fruit jam.
Table 5. Actual and predicted sensory evaluation of yellow passion fruit jam.
Appearance
The actual records of appearance score ranged between 5.33 and 6.00 (). The highest mean score of 6.00 was recorded for yellow passion fruit jam produced from 450 g/kg sugar, 4 g/kg pectin and 1 g/kg of citric acid (sample 9, ). This indicated that the sample was liked moderately by the panelists. The jam produced from 400 g/kg sugar, 2 g/kg pectin and 2 g/kg of citric acid had the lowest mean score (5.33) which indicated that the sample was liked slightly by the respondents (sample 1, ). A previous study by Bekele et al. (Citation2020) observed that pectin, sugar and pH levels have no significant (p < .05) differences in appearance, color, flavor, consistency and overall acceptability among the samples of jams of mango. A full second-order model was established to predict the appearance and the relationship between experimental and predicted values is given in . It showed how the points are scattered along the line inclined at 45° to either of the axes which showed perfect fit. The points ranged between 5.47 and 6.00 scattered close to the 45° lines suggesting a good fit.
Figure 2. Relationship between experimental and predicted sensory scores for appearance.
Color
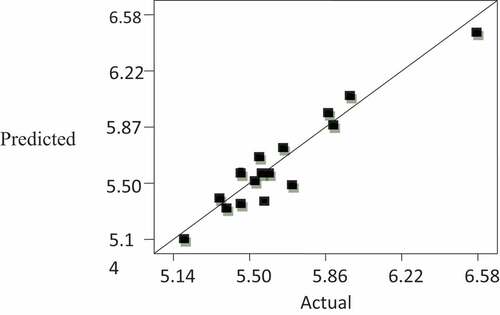
The actual records of color score ranged between 5.47 and 6.58 (). The highest mean score of 6.58 was recorded for yellow passion fruit jam produced from 400 g/kg sugar, 2 g/kg pectin and 2 g/kg of citric acid. This indicated that the sample was liked moderately by the panelists. The jam produced from 450 g/kg sugar, 4 g/kg pectin and 2 g/kg of citric acid had the lowest mean score (5.47) which indicated that the sample was liked slightly by the respondents. A full second-order model was established to predict the color and the relationship between experimental and predicted values is given in . The points are ranged between 5.47 and 6.58 scattered close to the 45° lines suggesting a good fit. The regression coefficients of the different terms in the model are presented in showing the significant effect of each independent variable on the color score.
Figure 3. Relationship between experimental and predicted sensory scores for color.
Flavor
The yellow passion fruit jam developed using sugar 500 g/kg, pectin 4 g/kg and citric acid 3 g/kg had the highest acceptability score of 6.07 is like moderately. The jam produced from 400 g/kg, pectin 4 g/kg and citric acid 3 g/kg () had the lowest acceptability score of 5.53 which showed slightly like on the seven hedonic scales. The flavor of products comes from volatile substances in fresh food and others. The loss of these volatiles leads to a decrease in the aroma of the product. A longer processing time will result in a greater loss of volatiles. In this study, the highest score for flavor was of a sample with the highest sugar addition. This is in agreement with the report of Jain and Nema (Citation2007) who noted an increase in the mean score for flavor rating with an increase in sugar content. The percent error in prediction varied between −0.05 and 0.05 and the lowest percent error was of experiments 6, 11, 16 and the highest was of experiments 7 and 10. The others are near to an acceptable line thus suggesting good prediction.
A full second-order model was used to predict the flavor values for a given set of ingredients. The relationship between experimental and predicted values is given in . It shows that the prediction was good as the points are scattered uniformly along the line at 45° and it also shows the relationship between experimental and predicted values.
Figure 4. Relationship between experimental and predicted scores for flavor.
Taste
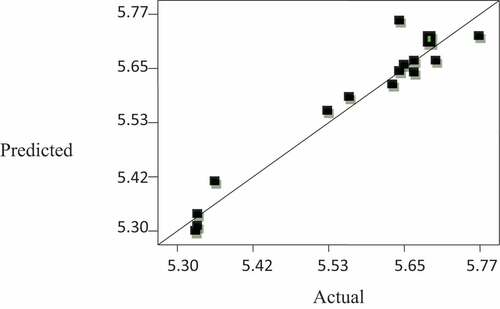
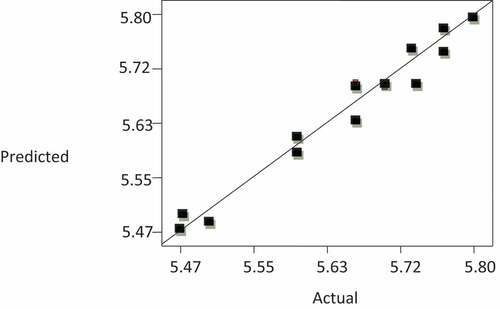
shows that the taste scores of yellow passion fruit jam ranged between 5.47 and 5.80, the smaller of which was of samples (experiment 1, ) produced using 400 g of sugar, 2 g of pectin, 2 g of citric acid for a kg of jam, whereas the larger sample was produced using 500 g of sugar, 4 g of pectin and 1 g of citric acid per kg of jam (experiment 6, ). The taste of jam is contributed by the number of sugars contained in the fresh juice. An increase in the amount of sugar beyond optimum amounts may, however, reduce the taste ratings thus requiring optimization (Verma, Citation2000). Besides sugar, other ingredients such as pectin and citric acid among others could be used to improve the taste of fruit jam. As sugar content increases, there was an increasing hardness in the jam making and it was less acceptable to tasters. The percent error in prediction varied between −0.03 and 0.04, in this the lowest percent error was of experiment 10, 14 and the highest was of experiment 15. Others are near to an acceptable line that suggesting good prediction. The full second-order model was used to predict the taste and relationship between experimental and predicted values and is given in . It shows that the predicted and actual values are represented by points scattered uniformly along the line at 450 which shows the perfect fitting of taste score. All relevant regression coefficients of the terms in the model and the significant effects of the independent variables are shown in .
Table 6. Regression coefficients (RC) and ANOVA for response surface quadratic model of all dependent variables.
Figure 5. Relationship between experimental and predicted sensory scores for taste.
Sweetness
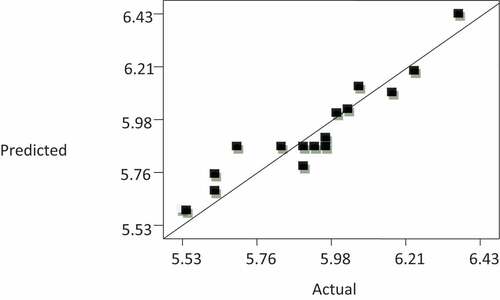
shows that the sweetness scores of yellow passion fruit jam ranged between 5.53 and 6.37 on a scale of seven points. The smaller value was of samples produced using 400 g of sugar, 2 g of pectin, 2 g of citric acid for a kg of jam (experiment 1, ), whereas the larger value is of the sample produced using 500 g of sugar, 4 g of pectin and 1 g of citric acid per kg of jam (sample 6, ). Sweetness rating may also depend on the type of fruit (Khan et al., Citation2020). The full second-order model was used to predict the texture, and the relationship between experimental and predicted values is shown in . It shows that the points representing the pairs of predicted and corresponding actual values are scattered uniformly along the line at 45° to the horizontal which shows a perfect fit. The sweetness scores ranged between 5.53 and 6.37. All the model parameters and the effect of the independent variables on sweetness are shown in .
Figure 6. Relationship between experimental and predicted sensory scores for sweetness.
Texture
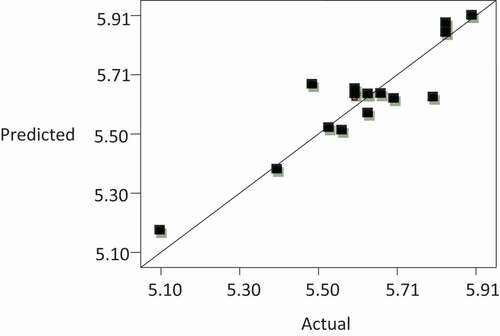
The values for the texture was ranged between 5.53 and 5.9 (). The highest acceptability score of 5.9 for texture is observed for yellow passion fruit jams developed by using 500 g sugar, 6 g pectin, 2 g citric acid (experiment 4, ). The score showed moderately in the seven-point hedonic scale used for evaluation. All five test runs 13–17 using the same ingredients have resulted in products with scores between 5.6 and 5.8 showing liking levels of jam. On the other hand, the lowest score of 5.53 was recorded for samples of test runs 1 and 13 produced using 400 g of sugar, 2 g of pectin, 2 g of citric acid and 450 g of sugar, 4 g of pectin, 2 g of citric acid per kg of jam. This score indicates “like slightly” in the seven-point hedonic scale. The acceptability of the texture of the yellow passion fruit jam developed at 450 and 400 g/kg was generally liked moderately. The percent error in prediction varied between −0.80 and 0.16 and the lowest percent error was of experiment 3 and the highest was of experiment 17. The others are near to an acceptable line and suggest a good prediction. The full second-order model was used to predict the texture and relationship between experimental and predicted values as shown in . It shows that the points representing the pairs of predicted and corresponding actual values scattered uniformly along the line inclined at 45° to the horizontal which shows a perfect fit in texture score. All the model parameters and the effect of the independent variables on texture are shown in .
Figure 7. Relationship between experimental and predicted sensors for texture.
Overall Acceptability
As it can be seen from , sensory analysis results showed that the average overall acceptability of the yellow passion fruit jams was highest (6.40) for fruit jams developed at 450 g/kg of sugar, 4 g pectin, 2 g citric acid (experiment 13–17, ) and 500 g/kg of sugar, 4 g pectin, 1 g citric acid (experiment 6, ). The lowest (5.47) was of fruit jams developed at 400 g/kg sugar, 4 g pectin, 3 g citric acid. The overall acceptability score (5.95) of fruit jams that were developed at 450 g/kg of sugar, 4 g pectin, 2 g citric acid (experiments 13–17, ) (6.40) and 400 g/kg of sugar, 4 g pectin, 1 g citric acid (6.00) was the best scored by the respondents and was liked moderately (experiment 5, ). Therefore, according to the panelists’ preference, the yellow passion fruit jam produced using 450 g/kg of sugar, 4 g pectin and 2 g citric acid and that produced using 500 g/kg of sugar, 4 g pectin and 1 g citric acid (experiment 6, ) is considered to be the best jam in terms of overall acceptability. These results are in good agreement with Bekele et al. (Citation2020) which have shown that the addition of 60% sugar improves the overall acceptability of the mango jam.
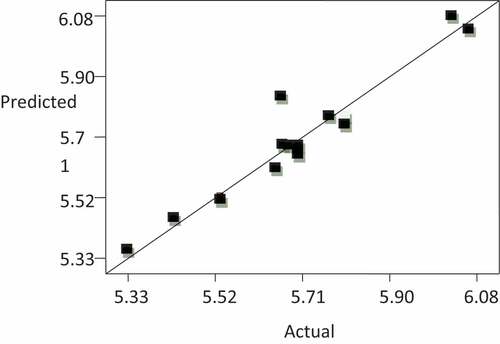
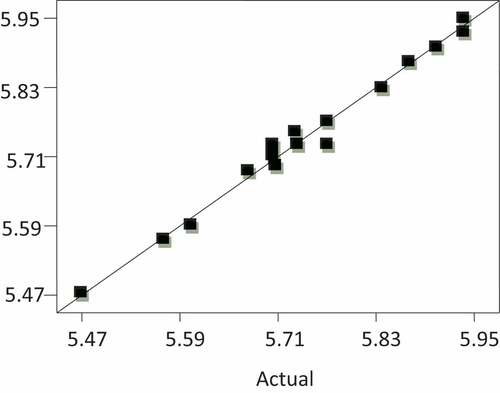
The percent error in prediction varied between −0.03 and 0.04. The lowest percent error belonged to experiment 13 and the highest to experiments 15. The others are near to an acceptable line, this suggesting a good prediction. Sensory evaluation indicated that 9, 6 and 1 samples scored high which were 6.4, 6.00 and 5.93, respectively, for overall acceptance. The full second-order model was used to predict the overall acceptability, and the relationship between experimental and predicted values is given in . It showed that the points of paired values of actual and predicted results are scattered uniformly along the line inclined at 45° to the horizontal which shows a perfect fit. The scores in this work ranged between 5.47 and 6.40. The regression coefficient of the different terms in the model is presented in showing the significance of the effect of each independent variable on the overall acceptability score.
Figure 8. Relationship between the experimental and predicted sensory score for overall acceptability.
Effect of Ingredients on Overall Sensory Acceptability of Yellow Passion Fruit Jam
Sensory scores of appearance, color, flavor, taste, sweetness, texture and overall acceptability showed that an acceptable yellow passion fruit jam could be developed using all ingredients. It was found that in general minimum overall sensory score was of the product made with a combination of sugar, pectin and citric acid, 500, 4, 3 g/kg and maximum 400, 2, 2 g/kg, respectively. Thus, sugar, pectin and citric acid are important ingredients in the preparation of yellow passion fruit jam. Analysis of variance showed that the coefficient of determination, R2 value was 96.7 for appearance, 97.5 for overall acceptability, 94.7 for color, 96.9 for flavor, 95.6 for taste, 88.4 for sweetness and 92.2 for texture. They were significant for all attributes and overall acceptability. The variables were standardized to simplify computation and to deduce the relative effect of variables on the responses. The magnitude of the coefficient in the second-order model shows the effect of that variable on the response.
shows that sugar affected all the sensory parameters (appearance, color, sweetness, taste, flavor, texture and overall acceptability) at high significant level (P < .01), but pectin and citric acid only at significant level (P < .1) at the linear, quadratic and interactive levels. All the above analysis of variance showed that the designed ingredients level had a significant effect on the overall acceptability of yellow passion fruit jam production and the need to optimize the overall acceptability by using RSM.
Optimization of Ingredients Level Using Response Surface Methodology (RSM)
The Response Surface Methodology (RSM) consists of a group of mathematical and statistical techniques used for the evaluation of the relationship between groups of controlled experimental factors and measured response. The RSM was employed to optimize the process ingredient level sugar, pectin and citric acid in the yellow passion fruit jam preparation. The software is used to optimize individual responses as well as compromise optima considering more responses. To get compromise optima, the software takes into account individual optimum and tries to get the compromise optimum. However, it is always not possible to get compromise optima since the optimum of the individual responses varies widely. The compromised optimum conditions could not be obtained as the individual optimum conditions vary widely. Therefore, overall acceptability was considered for optimization as it is a generalization of the acceptability of all quality attributes.
Optimization of Yellow Passion Fruit Jams Production Based on Overall Acceptability Score
Numeric optimization was carried out for the maximization of overall acceptability using various constraints (goal) on the process parameters of the yellow passion fruit jam. The desired goals for each variable and response were chosen. Three constraints or goals which were chosen are as follows ().
Table 7. Constraints for maximization of overall acceptability of yellow Passion fruit jam.
The software has generated three optimum conditions of independent variables with the predicted values of responses, in the target level of sugar = 471.26, 400 and 400 g/kg and pectin level = 2.86, 5.3 and 5.24 g/kg, citric acid = 1.46, 1.55 and 1 g/kg. By using the constraints, overall acceptability was optimized and three optimum levels were determined. The observed levels of sugar, pectin and citric acid are reported in and corresponding responses are predicted (). The jam was made at these three optimum levels to find out either similar response scores are obtained or not to validate the optimization. The observed sensory scores are also given in . It shows that error is less than 10% which suggests that optimized levels are good enough to make yellow passion fruit jam. The results of constraints 2 and 3 are in good agreement, so sugar = 400 g/kg, pectin = 5.24 g/kg and citric acid = 1 g/kg are recommended. The optimized jam was developed by using the above ingredients for assessment of nutritional composition and quality parameters. The yellow passion fruit was prepared using the derived optimum formulation level to check the validity of the second-order model. The observed values, i.e. experimental values for appearance, color, flavor, taste, sweetness, texture and overall acceptability score were determined and compared with the predicted values of the second-order model.
Table 8. Predicted and observed sensory attributes of optimized yellow passion fruit jam.
Table 9. Sensory analysis of optimized constraints (C) of yellow passion fruit jam product.
Table 10. Sensory evaluations of actual and predicted values of yellow passion fruit jam.
Multi-objective optimization was aimed at achieving better quality coupled with higher productivity. Accordingly, the optimization criteria for each response were selected as given in . The best solution satisfying the above criteria was obtained using the “Design Expert” software, which is given below and it has the overall desirability of 1.0.
The minimum scores for the recipe blend C2 might be due to the amount of pectin and citric acid added may not give fine sensory acceptance and C3 due to the presence of a small quantity of sugar and citric acid in passion fruit jam product. It was observed that these values are intermediate within the range of each response. Therefore, C3 gave the best results with the highest scores in appearance, color, flavor, taste, sweetness, texture and overall acceptability. The sensory acceptability scores of the three optimized conditions are presented in . To obtain the optimum jam formulation, acceptability was maximized within the experimental range and respecting the legal limits for jams. Maximum obtained overall acceptability (6.49) within these constraints of C3: sugar (400 gm), pectin (5.24 gm) and citric acid (1 gm) fruit extracted juice (500 ml), while minimum (6.22) score was recorded in C2 (400 gm sugar + 5.7 gm pectin + 1.55 gm citric acid + 500 ml fruit extract) and (6.31) in (471.26 gm sugar +1.46 gm citric acid + 2.86 gm pectin + 500 ml fruit extract juice).
The observed values of overall acceptability scores were found to be in close agreement with the predicted values of these scores, and all other scores were also within the acceptable limits indicating the suitability of the model in predicting quality attributes of yellow passion fruit jam. For these optimized jams the observed quality parameters value was pH = 3.93, 3.77 and 3.85, TSS = 68, 67 and 67.5, TA = 0.39, 0.41 and 0.37, Vitamin C = 15.5, 15.8 and 16 for all triplicate sample was optimized (C1), optimized (C2) and optimized (C3) respectively and all the observed values are on the line of standard. The yellow passion fruit jam prepared using the derived optimum formulation conditions was used to check the validity of the second-order polynomial model. The actual values, i.e. experimental values for appearance, color, taste, flavor, sweetness, texture and overall acceptability score were compared with corresponding values predicted using the second-order polynomial model (). The actual values of appearance (5.90), color (6.42), taste (6.00), flavor (6.20), sweetness (6.10), texture (6.45) and overall acceptability (6.49) scores were found to be in close agreement with the predicted values of these scores, i.e. 6.00, 6.41, 6.10, 6.24, 6.12, 6.46 and 6.50, respectively, and they were also within the acceptable limits indicating the suitability of the model in predicting quality attributes of yellow passion fruit jam products shown under.
Optimization of Yellow Passion Fruit Using Response Surface Methodology
Response surface methodology (RSM) can be used to model and optimize any response affected by levels of one or more quantitative factors. This methodology was used to study the effects of ingredients on the sensory acceptability of yellow passion fruit. The statistical software, Design-Expert (Version 10-States Inc. www.statease.com) was used to analyze the experimental data. Experiments were performed according to the Box Behnken design (BBD) in the RSM. Upon the completion of experiments, the average maximum sensory evaluation of yellow passion fruit for overall acceptability was taken as the response. A combination of ingredients was used to obtain overall acceptability to individual treatment to increase the levels of sugar, pectin and citric acid. The levels considered for optimization were sugar 400–500 g, pectin 2–6 g and citric acid 1–3 gm (). The different variables and their levels, Box Behnken design arrangement for preparation of yellow passion fruit, are given in . A Box Behnken design was used in selecting the levels of parameters in the experiments and to investigate the effect of independent variables on the response. The optimum conditions for the best sensory score of the three outputs were obtained using a response optimizer in Design-Expert Version 6.0.8. An experimental run was conducted by taking the operating parameters that yielded the best sensory value. The overall scores were 6.49 for overall acceptability.
Response surface methodology design was used to test the relative importance of sensory outputs, the optimum condition for the best score is C3 (400 g sugar, 5.34 g pectin, 1 g citric acid and 500 mL fruit extract juice). The quality of the jam depends on the proportion of the mixture which can be tested by sensory analysis.
By the complete model, a response surface was constructed for the overall acceptability of the jam (). It can be seen that the surface created by the predictive model indicated a maximum for overall acceptability that would allow the formulation of the optimum jam.
Figure 9. Response surface contour plots for overall acceptability of yellow passion fruit jam as a function of amounts of pectin and sugar.
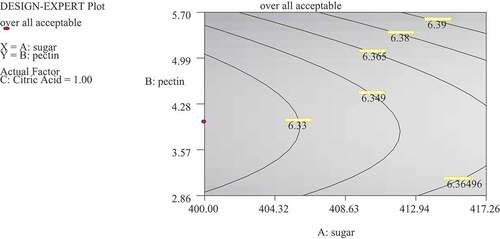
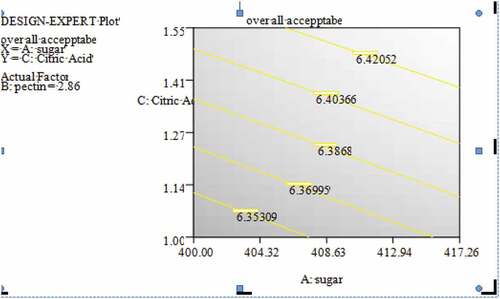
Figure 10. Response surface contour plots for overall acceptability of yellow passion fruit jam as a function of amounts of pectin and sugar.
Using the STATISTICA (Version 6.0.8-States) Design-Expert software for response overall acceptability (Y) optimization, the value obtained was X1 = sugar (400 g), X2 = citric acid (1 g), X3 = pectin (5.24 g) and fruit extract juice (500 g) concentrations. The response value (overall acceptability) for these optimum values was 6.49, which corresponds to “like very much” on the 7-point hedonic scale.
Statistical analysis showed that the model fit was significant (P = .0055) for overall acceptability and the R values for these response variables overall acceptability (R2 = 0.985 and adjusted R2 = 0.965). As shown in , A, B, A2, C2 and AC, BC had a significant contribution to the overall acceptability (P < .05). This means that the effect of sugar and pectin in overall acceptability was significant but the effect of (citric acid) was not significant (P > .05). Statistical analysis showed that the lack of fit was non-significant (P = .1512) and this shows the validation of the model in the study. The response surface models were fitted to the response variable (Y) of three independent variables; x1 = sugar (400 g), x2 = pectin (5.24 g) and x3 = citric acid (1 g). The sign and the magnitude of the coefficient indicate the effect of the variable on the response. The negative sign of a coefficient at the linear level indicates a decrease in response with an increase in the level of the variable. In the case of the quadratic term, the negative sign of a variable indicates that the minimum is at the center point and increases or decreases toward the alpha 5% level of the variable. A positive sign indicates a maximum response at the center point. Yellow passion fruit jam affected all the responses significantly (P < .05) at linear and quadratic levels as well as interaction levels. The effect was negative, suggesting that an increase in the quadratic level of yellow passion fruit jam decreased overall acceptability. However, it affected overall acceptability (P < .05) at quadratic and interaction levels.
Table 11. ANOVA and regression coefficients (RC) and second-order polynomial model for all over acceptability responses.
The “Pred R-Squared” of 0.948 is in reasonable agreement with the “Adj R-Squared” of 0.965 (). “Adeq Precision” measures the signal-to-noise ratio. A ratio greater than 4 is desirable. In this case, the ratio of 22.324 indicates an adequate signal. This model can be used to navigate the design space.
Table 12. Model adequacy measures for overall acceptability.
Development of a Model Equation
The application of RSM offers an empirical relationship between the response function and the independent variables. The mathematical relationships between the response and the independent sugar (A), pectin (B) and citric acid (C) in terms of coded and actual factors can be determined by Design-Expert software. The model equation that correlates the response (Y) was given in the equation below.
Final Equation in Terms of Coded Factors:
Where A = Sugar
B = Pectin
C = citric acid
From the regression model equation developed in terms of coded factors, the response overall acceptability was affected by linear terms Sugar (A), Pectin (B) and Citric acid (C) and quadratic terms, pure quadratic terms (A2, B2 and C2) and interaction quadratic terms (AB, AC and BC). Based on the coefficients in equations, it was evident that the response overall acceptability increases with the Pectin (B) and citric acid (C), which have a positive linear effect on overall acceptability but sugar has a negative effect at linear. Pure quadratic terms (A2, B2 and C2) contain a negative effect on the response’s overall acceptability but the effect of a pure quadratic term (A2) has a substantial effect than the other quadratic terms.
Interaction of AB and BC has a negative quadratic effect on overall acceptability.
Final Equation in Terms of Actual Factors:
Where A = Sugar
B = Pectin
C = citric acid
Model equations of both coded and actual factors can be used to make predictions about the response for given levels of each factor. The coded model equation is useful for identifying the relative impact of the factors by comparing the factor coefficients.
Response surface and contour plots obtained from the calculated RSM are shown in . The Response surface was plotted to better visualize the significant (P < .05) interaction effects of independent variables on the overall acceptability of yellow passion fruit jam. The factor levels for the formulation that maximized acceptability were as; sugar 400 g (40%), pectin 5.24 g (5.24%), citric acid 1 g (1%) and fruit extract juice 500 mL (50%).
Figure 11. Response surface contour plots for overall acceptability of yellow passion fruit jam as a function of amounts of pectin and sugar.
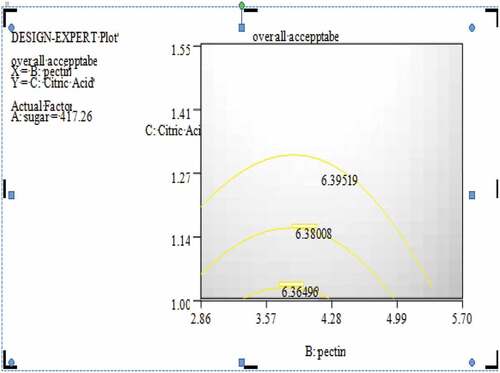
, which shows an increase in sugar and pectin resulted in an increase in sensory score of up to 6.4 results in an increase in overall acceptability but increasing above 6.4 is an inverse effect. increasing sugar and citric acid up to 6.39 results in an increase of overall acceptability, whereas increasing more above 6.39 inverse effects on overall acceptability. shows the corresponding plots that are pectin and citric acid increasing the sensory score up to 6.4 with further decreasing the number of ingredients. The sensory value of overall acceptability increased with increased ingredient level and its sensory score decreases with further increase in ingredients. The factor levels for the formulation that maximized acceptability were as follows: sugar = 400%, pectin = 5.24% and citric acid = 1%.
Conclusion
This study demonstrated the potential use of yellow passion fruits in jam production. The jam was successfully developed from fresh yellow passion fruit using four ingredients: sugar, pectin and citric acid of different levels. For a good quality jam, the right amount of acid and pectin ratio is critical for gel formation and stability. The study then concluded that the selection of appropriate ingredients and processing conditions were important to produce an acceptable sensory quality product of yellow passion fruit jam. Furthermore, the sensory attribute of the fruit jam was the most influential characteristic for its acceptability. The sensory acceptability of the jam prepared from yellow passion fruit was quite good, acceptable and encouraging. The quality of various formulations suggests and extends a great opportunity to utilize yellow passion jam in formulations. The yellow passion fruit jams developed were generally judged to be acceptable by the sensory panelists. Sensory score of color, flavor, taste, texture and overall acceptability range showed that an acceptable yellow passion fruit jam could be developed using all ingredients sugar, pectin and citric acid are important ingredients in the preparation of yellow passion fruit jam. This study clearly showed the effect of ingredients on the sensorial acceptability of yellow passion fruit jam. The developed jams have very good acceptability and will attract the consumer for its characteristic sensorial attributes. The development of such nutritional products will reduce the postharvest losses and also impart value to highly appreciated fruits.
Disclosure statement
No potential conflict of interest was reported by the author(s).
Additional information
Funding
References
- Adebooye, O.C., G.O. Adeoye, and H. Tijani-Eniola. 2006. Quality of fruits of three varieties of tomato (Lycopersicon esculentum (L.) Mill) as affected by phosphorus rates. J. Agron. 5(2):396–400
- AOAC (Association of Official Agricultural Chemists). 2005. Official methods of analysis of the association of official analytical chemists (US), 20th Ed. The Association
- Bekele, M., N. Satheesh, and S. J.a. 2020. Screening of Ethiopian Mango cultivars for suitability for preparing jam and determination of pectin, sugar, and acid effects on physico-chemical and sensory properties of Mango jam. Sci. Afr. 7:e00277. doi: 10.1016/j.sciaf.2020.e00277.
- Bello, M.O., O.S. Falade, S.R. Adewusi, and N.O. Olawole. 2008. Studies on the chemical compositions and anti-nutrients of some lesser-known Nigeria fruits. Afr. J.Biotechnol. 7(21):3972–3979.
- Brandão, T., E. Carvalho, L.I.M.A. Juliana Pinto de, C.A.R.M.O. Eloá Lourenço do, E.L.I.A.S. Heloisa Helena de Siqueira, M.A.R.T.I.N.S. Glêndara Aparecida de Souza, and B.O.R.G.E.S. Soraia Vilela. 2020. Effects of thermal process in bioactive compounds of mixed Brazilian cerrado fruit jam. Food Sci. Technol. doi: 10.1590/fst.28020.
- Da Silva, J.K., C.B.B. Cazarin, Â.G. Batista, and M. Marósticajr. 2014. Effects of passion fruit (Passiflora edulis) byproduct intake in the antioxidant status of Wistar rats tissues. LWT-Food Sci. Technol. 59(2): 13–12. doi: 10.1016/j.lwt.2014.06.060.
- Dereje, B., and S. Abera. 2020. Effect of some pretreatments before drying on microbial load and sensory acceptability of dried Mango slices during storage periods. Cogent Food Agric. 6(1):1807225. doi: 10.1080/23311932.2020.1807225.
- Dubey, A., K. Amit, and S. Pavuluri. 2021. Development and storage study of reduced calorie aloe vera (Aloe barbadensis Miller) based pineapple fruit jam. J. Food Meas. Charact. 15(1), 961–975
- Golpour, I., K. Mohammad, A. Reza, and P.F. Raquel. 2020. Optimization of infrared-convective drying of white mulberry fruit using response surface methodology and development of a predictive model through artificial neural network. Int. J. Fruit Sci. 20(sup2):S1015–S1035. doi: 10.1080/15538362.2020.1774474.
- He, X., F. Luan, Y. Yang, Z. Wang, Z. Zhao, J. Fang, M. Wang, M. Zuo, and Y. Li. 2020. Passiflora edulis: An Insight Into Current Researches on Phytochemistry and Pharmacology. Front Pharmacol. 11. doi: 10.3389/fphar.2020.00617.
- Iqbal, K., A. Khan, and M.M.A.K. Khattak. 2004. Biological significance of ascorbic acid (vitamin C) in human health-a review. Pak. J. Nutr. 3(1):5–13.
- Jain, P.K., and P.K. Nema. 2007. Processing of pulp of various cultivars of guava (Psidium guajava L.) for leather production. Agric. Eng. Int. 9
- Joy, P.P. 2010. Benefits and uses of pineapple, p. 670. Pineapple Research Station (Kerala Agricultural University), Vazhakulam.
- Kaunsar, J., and S. Pavuluri. 2018. Stability of bioactive compounds in fruit jam and jelly during processing and storage: A review. Trends Food Sci. Technol. 75:181–193. doi: 10.1016/j.tifs.2018.02.002.
- Khan, A., F.N. Shah, Q. Zeb, M. Zeeshan, H. Iqbal, and H. Noor. 2020. Preparation and development of fig fruit jam blended with different level of apple pulp. Biol. Sci-PJSIR 63(2):105–112. doi: 10.52763/PJSIR.BIOL.SCI.63.2.2020.105.112.
- Neha, P., P.A. Parimita, and V. Pal. 2019. Studies on sensory and physico-chemical assessment of health benefits of pineapple jam prepared with different levels of dark chocolate and aloe vera. Pharma Innovation J. 8(6):1253–1259.
- Ngoh Newilah, G., C. Kendine Vepowo, A. Takam Ngouno, A. Bouniol, A. Rolland‐Sabaté, V. Meli Meli, and G. Fliedel. 2020. Analysis of consumer‐oriented quality characteristics of raw and boiled plantains in Cameroon: Implication for breeding. International Journal of Food Science & Technology. 56(3): 1135–1147
- Obasi, B.C., C.M.Z. Whong, and J.B. Ameh. 2017. Nutritional and sensory qualities of commercially and laboratory prepared Orange juice. Afr. J. Food Sci. 11(7):189–199. doi: 10.5897/AJFS2015.1371.
- Ogunlade, A., and G. Oluwafemi. 2021. Production and evaluation of jam produced from plum and African Star apple blends. Food Res 5(4):93–98. doi: 10.26656/fr.2017.5(4).031.
- Ramaiya, S.D., J.B. Bujang, M.H. Zakaria, and N. Saupi. 2019. Nutritional, mineral and organic acid composition of passion fruit (Passiflora species). Food Res 3(3):231–240. doi: 10.26656/fr.2017.3(3).233.
- Samyor, D., S. Chandra, and B. Amit. 2020. Physicochemical and phytochemical properties of foam mat dried passion fruit (Passiflora edulis Sims) powder and comparison with fruit pulp. J Food Sci Technol. doi: 10.1007/s13197-020-04596-y.
- Verma, L.R. 2000. Postharvest technology of fruits and vegetables: General concepts and principles. Vol. 1. New Delhi: Indus Publishing.
- Vincente, A.R., G.A. Manganaris, C.M. Ortiz, G.O. Sozzi, and C.H. Crisosto. 2014. Nutritional quality of fruits and vegetables, p. 69–122. In: Postharvest handling. Wojciech j., Florkowski, Robert L, Shewfelt, and Stanley E., Prussia (eds.). Elsevier Inc.: Academic Press.