
ABSTRACT
The Diospyros genus contains approximately 400 to 500 species, among which D. kaki is cultivated as the edible persimmon. Knowledge about the genetic diversity of Diospyros genotypes is of high significance for breeding programs. In this research, the genetic diversity of 57 Diospyros genotypes collected from different regions of Iran was evaluated using inter simple sequence repeats (ISSR) and start codon targeted (SCoT) markers. Seven ISSR and 10 SCoT markers produced a total of 42 and 75 fragments with the averages of 6 and 7.5 fragments per primer, respectively. The average polymorphism information content (PIC) for ISSR markers was 0.3 and for SCoT markers was 0.36. The average marker index (MI) for ISSR and SCoT markers were 1.81 and 1.79, respectively. Cluster analysis based on Jaccard’s genetic similarity coefficient and UPGMA method classified 57 Diospyros genotypes into four main groups based on ISSR and SCoT markers. However, the clustering pattern based on the combination of ISSR and SCoT markers data separated the species genotypes better than each marker alone. Accordingly, groups 1 and 2 contained all D. kaki genotypes, both encompassing various subgroups, group 3 included D. lotus and group 4 included D. virginiana genotypes. Genotype distribution visualized with principal coordinate analysis (PCoA) was in accordance with the cluster analysis. Based on our results Iran is a rich source of Diospyrus germplasm, and a combination of ISSR and SCoT markers can be used as an accurate technique for evaluating genetic diversity among the Diospyros genotypes.
Introduction
Diospyros genus, belonging to Ebenaceae family, contains approximately 400 to 500 species, most of which spread widely in tropical and subtropical regions of Asia, Africa, as well as south and central America (Del Mar Naval et al., Citation2010; Du et al., Citation2009; Guan et al., Citation2020; Jing et al., Citation2013). Among the species of the Diospyros, Japanese or oriental persimmon (Diospyros kaki Thunb.), originated from China, is an edible cultivated species which is mostly hexaploid (2 n = 6x = 90) or nonaploid (2 n = 9x = 135) (Jing et al., Citation2013). Furthermore, D. virginiana L. (2 n = 6x = 90) has been cultivated for timber wood production, while D. lotus L. (2 n = 2x = 30) has been usually used as a rootstock for Japanese persimmon (Guan et al., Citation2020).
Cultivation and consumption of edible persimmon found a significant increase worldwide, with China, Japan, and Korea being the main producers and exporters of persimmon in the world (FAO, Citation2019). Although persimmon originated from East Asian countries, it is today being cultivated in different parts of the world, such as Spain, Italy, Brazil, Turkey, and Azerbaijan (Guan et al., Citation2020; Yesiloglu et al., Citation2018). These countries have investigated the persimmon breeding and have developed their own cultivars, such as ‘Lama Forte’ in Brazil or ‘Rojo Brillante’ in Spain, and recently have started to export persimmon to other countries (Yesiloglu et al., Citation2018). Persimmons have been cultivated in different regions of Iran for more than 200 years. Japanese persimmon as well as D. virginiania were probably introduced to Iran from Eastern Asia and other origins such as Europe, but the time and cultivar name are still unknown. On the other hand, D. lotus, which is used as rootstock for Japanese persimmon (Guan et al., Citation2019), is distributed in northern forests of Iran from ancient time. Persimmons are well adapted to a wide range of climate conditions in Iran, ranging from north to south areas. In spite of the wide distribution, little information is available about the genetic diversity of Iranian wild Diospyros and edible persimmons.
Genetic diversity assessment of a germplasm resource is highly important for establishment of breeding programs, improvement of new varieties and conservation efforts (Deng et al., Citation2015; Guan et al., Citation2020; Zarei and Erfani-Moghadam, Citation2021). The presence of great diversity in plant genetic resources provides opportunity for breeders to develop new cultivars with desirable traits such as high yield and resistance to biotic and abiotic stresses (Govindaraj et al., Citation2015; Houmanat et al., Citation2021). In the present study, the genetic diversity of Iranian persimmons was investigated.
Initially, the method applied for cultivar classification in fruit crops was based on the morphological traits such as leaves, flower structure, fruit shape and other important vegetative and reproductive characteristics (Zhou et al., Citation2020). The limitations of phenotypic markers led to the development of DNA-based genetic markers that have the ability of distinguishing genetic diversity and logical genetic election based on DNA analysis (Del Mar Naval et al., Citation2010; Zhou et al., Citation2020). In order to identify the persimmon cultivars and genetic relationships between Diospyros species, different molecular markers have been utilized including: AFLP (Du et al., Citation2009; Kanzaki et al., Citation2000), RFLP (Maki et al., Citation2001), RAPD (Badenes et al., Citation2003; Yamagishi et al., Citation2005), SSAP (Du et al., Citation2009); SRAP (Jing et al., Citation2013), mtDNA for non-coding regions (Hu and Luo, Citation2006), cpDNA PCR-RFLP (Hu et al., Citation2008), SSR (Guan et al., Citation2019; Guo and Luo, Citation2011), IRAP and REMAP (Du et al., Citation2009; Guo et al., Citation2006). However, the genetic relationships between Diospyros wild species and the cultivated varieties have not been completely identified (Del Mar Naval et al., Citation2010; Jing et al., Citation2013).
Inter simple sequence repeat (ISSR) molecular marker can find polymorphisms in inter-microsatellite DNA parts without any previous sequence information. In this marker, primers are designed based on a repeat sequence, often with a degenerate 3′ anchor, and amplify the sequence between two microsatellites resulting in a large number of amplification products (Uddin and Cheng, Citation2015). Start Codon Targeted (SCoT) is a new and accurate marker, which is in accordance with the translation start codon. The primers are designed on the basis of ATG codon, which is conserved by translating initial codon of the genes (Jing et al., Citation2013; Tabasi et al., Citation2020). The SCoT and ISSR markers have been used for studying genetic diversity in various plant species (Amom et al., Citation2020; Baghizadeh and Dehghan, Citation2018; Etminan et al., Citation2018; Gorji et al., Citation2011; Pakseresht et al., Citation2013; Pour-Aboughadareh et al., Citation2018; Saboori et al., Citation2020; Shen et al., Citation2020; Tabasi et al., Citation2020; Tiwari et al., Citation2016; Tyagi et al., Citation2020; Zarei and Erfani-Moghadam, Citation2021; Zhou et al., Citation2020). Accordingly, in some studies, the genetic relationships among the Diospyros species were evaluated by ISSR (Yuan et al., Citation2012) and SCoT markers (Deng et al., Citation2015; Guan et al., Citation2020; Yang et al., Citation2015).
To the best of our knowledge, there is no information with respect to the evaluation of genetic diversity of Iranian edible persimmons (D. kaki) and non-edible Diospyros germplasms (D. lotus and D. virginiania) using molecular markers. Therefore, this research was aimed (a) to identify genetic diversity levels among different genotypes of Diospyros in Iran, (b) to specify the similarity and genetic relationships between domestic and wild Diospyros genotypes and (c) to compare the efficiency of ISSR and SCoT markers for evaluation of genetic diversity in different Iranian Disopyros accessions.
Materials and Methods
Plant Materials and DNA Extraction
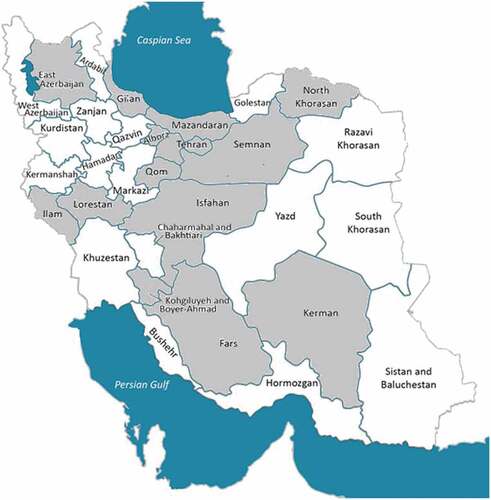
In total, 57 wild and cultivated Diospyros samples (individual genotypes), belonging to three species D. lotus (7 samples), D. kaki (48 samples) and D. virginiania (2 samples), from different geographical regions of Iran were evaluated by using 7 ISSR and 10 SCoT molecular markers ( and ). The sampling distance between the individual genotypes was at least 2000–2500 m. Young leaves from each genotype were collected in spring in 2015 and immediately transported inside the liquid nitrogen to the laboratory and stored at −80°C for subsequent DNA extraction. Genomic DNA was extracted from fresh leaves using CTAB method as described by Aras et al. (Citation2003). Isolated DNA concentration was estimated by measuring the absorbance at 260 nm using a spectrophotometer, and DNA quality was tested by electrophoresis on the 1% agarose gel (Shen et al., Citation2020). Finally, the DNAs were stored at −80°C for further analysis.
Table 1. List of 57 Iranian Diospyros genotypes (Diospyros spp.) in this study.
Figure 1. Map of Iran showing the provinces of the collection site (shown by gray color) of the 57 Diospyros genotypes used in this experiment.
PCR Amplification and Product Electrophoresis
Ten SCoT primers and 17 ISSR primers were tested on three different accessions. All of the SCoT oligos and seven ISSR primers produced reproducible polymorphic bands (), which were selected for further analysis. The PCR amplification was carried out in a final volume of 15 µl containing 3 µl DNA template (10 ng/µl), 8 µl PCR Master Mix (SinaClon BioScience Co. Iran, containing 0.2 Units/µl Taq, 1.6 mM dNTPs, 3 mM MgCl2), 1 µL primers (10 pM), and 3 µl sterile distilled water. The PCR reaction was carried out using thermo cycler (ABI, PCR System 2080, Perkin-Elmer Corp, Norwalk, CT, USA) as described by Tyagi et al. (Citation2020). The following cycling protocol was set for amplification: 4 min initial denaturation at 94°C; 35 cycle of 45 sec denaturation at 94°C, 45 sec annealing at 43.5–64.5°C, and 1 min extension at 72°C; and a final extension step of 7 min at 72°C.
Table 2. Primer sequences of ISSR and Scot markers in this experiment.
The PCR-amplified products were separated by electrophoresis (Biostep, HU20, UK) on a 2% (w/v) agarose gel in Tris-borate-EDTA (TBE) buffer. Then, the gel was stained with ethidium bromide solution and photographed with Gel Doc system. A 1 kb DNA ladder (SinaClon BioScience Co. Iran) was used as the size marker in the side lanes of each gel.
Data Analysis
Each band was scored as present (1) or absent (0), and the data obtained were analyzed and used to generate a binary data matrix. Based on the produced pattern of different ISSR (Supplementary file 1) and SCoT markers (Supplementary file 2), number of amplified bands (n), number of polymorphic bands (np), polymorphism percent, polymorphism information content (PIC) and marker index (MI) were calculated for each marker (Amom et al., Citation2020; Powell et al., Citation1996; Smith et al., Citation1997).
Genetic similarities among all the persimmon genotypes were calculated based on Jaccard’s similarity coefficient. UPGMA (unweight pair group method with arithmetic mean) method was applied to represent genetic relationships among the persimmon genotypes based on Jaccard’s genetic similarity coefficient using NTSYS software (Rholf, Citation2000). Also, bootstrap analysis containing 1000 replicates was performed to confidently validate the clustering (Rahmani et al., Citation2015).
In order to estimate the correlation between similarity matrices of the two markers, Mantel test was conducted using NTSYS-pc software ver. 2.2. In addition, Principal Coordinate Analysis was performed based on the variance covariance matrix calculated from the combined ISSR and SCoT data (Amom et al., Citation2020).
Results
Polymorphism of ISSR and SCoT Markers
In this study, seven ISSR primers generating abundant and clear bands were used to estimate the genetic diversity of 57 persimmon genotypes. The ISSR primers identified 42 genomic loci on the studied genotypes. The size of amplified fragments ranged from 150 to 2000 bp and the number of bands varied from 4 to 15 for each primer. The average polymorphism percent of these bands was 100% for all primers ().
Table 3. Polymorphisms, polymorphic information content and Marker index with ISSR marker.
Based on ISSR markers, there was a high level of polymorphism among the investigated genotypes (). PIC values ranged from 0.38 (UBC826) to 0.47 (UBC855) with an average of 0.43 (). The value of MI for the ISSR marker varied from 0.91 (UBC851) to 4.13 (UBC807) with an average of 1.81 ().
Amplification was successfully performed with 10 SCoT markers. A total of 75 bands, which all were polymorphic, were observed. The size of amplified fragments ranged from 200 bp to 3000 bp. The total number of bands scored the primers ranged from 4 (SCoT7) to 21 (SCoT6) with an average of 7.5 bands per primer set. Polymorphism percent obtained by SCoT markers was 100% for all genotypes ().
Table 4. Polymorphisms, polymorphic information content and Marker index with Scot marker.
PIC values ranged from 0.29 (SCoT2) to 0.43 (SCoT4 and SCoT7) with an average of 0.36 per primer (). MI varied between 0.82 (SCoT2) and 4.79 (SCoT6) with an average of 1.79 per primer (). Amplified fragments ranged from 200 bp to 3000 bp.
Genetic Similarity and Cluster Analysis
ISSR data analysis showed that pairwise Jaccard’s similarity coefficient among all the genotypes ranged from 9.67 to 95.83%. The highest genetic similarity was related to genotypes QQ (Japanese persimmon collected from Qom province) and KA7 (Japanese persimmon collected from Alborz province) and the lowest similarity was related to genotypes IWIl (Japanese persimmon collected from Ilam province) and KA3 (American persimmon collected from Alborz province).
Based on SCoT data analysis, the genetic similarity ranged from 11.76 to 100%. The highest genetic similarity was recorded between genotypes VT1 and VT2, both were Japanese persimmon collected from Varamin city in Tehran province, and the lowest genetic similarity was recorded between genotypes PT2 (Japanese persimmon collected from Tehran province) and KA3 (American persimmon collected from Alborz province).
The pairwise genetic similarity coefficient computed by using combined ISSR and SCoT data showed a range from 13.97 to 98.4%. The highest genetic similarity was related to genotypes VT1 and VT2, and the lowest similarity was related to genotypes KA3 (American persimmon collected from Alborz province) and KA7 (Japanese persimmon collected from Alborz province). In the case of intraspecific genetic similarity in D. kaki, the lowest genetic similarity was related to genotypes KK1 (collected from Kerman province) and RM1 (collected from Mazandaran province). In D. lotus species, the highest genetic similarity was found between RM1 and MM2 (both from Mazandran province). On the other hand, the lowest genetic similarity was observed between genotypes KA1 (from Alborz province) and NI1 (from Isfahan province). Similarity between two genotypes of D. virginiana was 60.6%.
The correlation value (r) between the genetic similarity matrixes of the ISSR and SCoT markers was 0.56, showing a high significant correlation between the two markers.
Cluster analyses obtained from ISSR, SCoT, and their combination data can be seen in , respectively. The genotypes were grouped with some differences in four dendrograms. The UPGMA dendrogram of genetic relationships among 57 persimmon genotypes using ISSR markers showed that all the genotypes were divided into four main groups (). Cluster I consisted of genotypes KA2 and KA3 that belonged to D. virginiana with small and round-shaped fruits. Cluster II included genotypes RM4, AG2, KA4, SF2, YK2, TT1, PT2, AM, DM3, DM2 and EN, all of which belonged to D. kaki; some of these genotypes contained round shaped fruits and some contained conical-shaped fruits. Cluster III included genotypes VT1, VT2, NI2, and KSI, belonging to D. kaki with round-shaped fruits. All of these genotypes were collected from Tehran and Isfahan provinces. Finally, cluster IV contained a maximum number of D. kaki genotypes, as well as all D. lotus genotypes. In this cluster, two distinct sub clusters were detected, sub cluster 1 included genotypes KA10, AG1, KL2, IWI1, KK2, KA9, BK, KL1, KA5, PT1, KA7, QQ, KA8, PT4, AG3, SS, SF1, KK1, CT, and IlIl, all of which belonged to D. kaki with round-shaped fruits, and sub cluster 2 included genotypes PT3, KA6, II1, II2, MM1, DM1, NI1, KA1, MM2, MA, RM1, YK1, KI, RM2, JE, DM4, RM3, FA, MM3, and LG; all of D. lotus genotypes and some of D. kaki genotypes were placed in this sub cluster.
Figure 2. UPGMA dendrogram of 57 Diospyros genotypes based on ISSR molecular marker. The code is the same as .
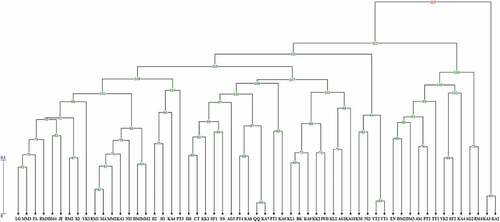
Figure 3. UPGMA dendrogram of 57 Diospyros genotypes based on Scot molecular marker. The code is the same as .
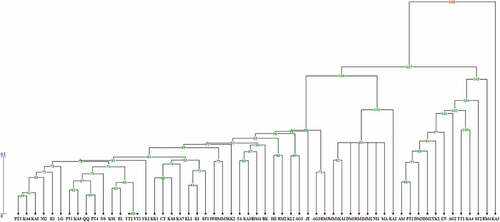
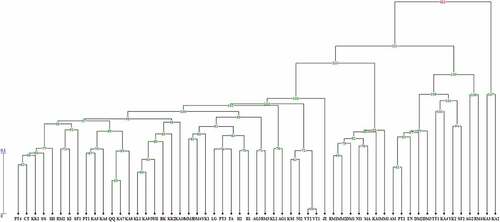
Figure 4. UPGMA dendrogram of 57 Diospyros genotypes based on ISSR and Scot molecular marker. The code is the same as .
The results of cluster analyses of the SCoT marker were slightly different from those of ISSR marker. However, similar to ISSR, the genotypes based on SCoT marker and constructed with UPGMA method were clustered into four main groups (). Cluster I consisted of genotype KA3 that belonged to D. virginiana, cluster II included genotypes RM4, SF2, KA4, TT1, AG2, EN, YK2, DM2, DM3, PT2, and AM which belonged to D. kaki, and cluster III included genotypes MA, NI1, MM2, RM1, DM1, KA1, and MM1. All of the D. lotus genotypes and genotype KA2 belonging to D. virginiana were placed in this cluster. Finally, the last cluster included genotypes RM3, AG3, JE, AG1, KL2, RM2, IlIl, BK, DM4, KA10, FA, KK2, MM3, IWI, SF1, KI, KL1, KA7, KA8, CT, KK1, YK1, VT1, VT2, II1, KSI, SS, PT4, QQ, KA9, PT1, LG, II2, NI2, KA5, KA6, and PT3; all of these genotypes, which were collected from different regions of Iran, belonged to Diospyros kaki.
UPGMA cluster analyses using genetic similarities and combined data of ISSR and SCoT markers showed that four main clusters were identified among the 57 genotypes (). In this clustering pattern, D. lotus, D. virginiana, and D. kaki genotypes were clearly separated from each other. Cluster I consisted of D. virginiana genotypes of KA2 and KA3. Cluster II included genotypes RM4, AG2, SF2, YK2, KA4, TT1, DM3, DM2, EN, PT2, and AM, all belonging to D. kaki. D. lotus genotypes including MM1, KA1, MA, NI1, DM1, MM2, and RM1 formed cluster III. Finally, cluster IV contained genotypes JE, VT1, VT2, NI2, KSI, AG1, KL2, RM3, AG3, II1, II2, FA, PT3, LG, YK1, DM4, MM3, KA10, KK2, BK, IWIl, KA9, KL1, KA8, KA7, QQ, KA6, KA5, PT1, SF1, KI, RM2, IlIl, ST, KK1, CT, and PT4, all belonging to D. kaki. In this cluster, genotype JE was clearly separated from other genotypes. Furthermore, in this cluster, genotypes VT1, VT2, NI2, and KSI were detected as distinct sub cluster.
PCoA Analysis
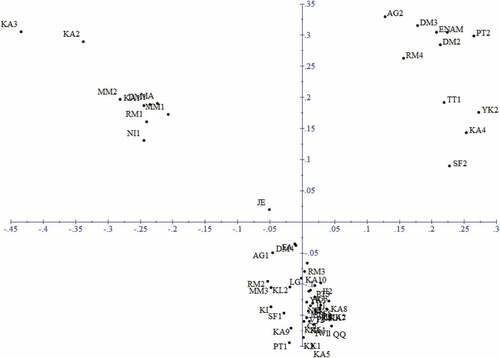
PCoA (Principal Coordinate Analysis) was performed to investigate the genetic relationships among the persimmon genotypes. showed the distribution of the studied genotypes according to the two first principal axes of variation using PCoA. The plot revealed the interspecific genetic relationships among the genotypes and confirmed the results of cluster analysis. The four main clusters on the phylogenetic tree were labeled on the plots of the PCoA, as they can be seen in . Accordingly, the genotypes from tree species were clearly separated from each other, and the genotypes of D. kaki were divided into two clearly distinct groups.
Figure 5. Two-dimensional plots of the principal coordinate analysis of 57 Diospyros genotypes based on ISSR and Scot markers along the first two coordinate axes.
Discussion
Increasing knowledge about the genetic diversity among persimmon germplasms provides baseline data for future breeding programs (Del Mar Naval et al., Citation2010; Guan et al., Citation2020). Although persimmon has been cultivated at least for two hundred years in different regions of Iran, little information is available about the genetic diversity of this fruit crop in the country. Current study revealed that there was noticeable diversity among the Iranian persimmon genotypes. According to Del Mar Naval et al. (Citation2010) considerable genetic diversity was detected among Spanish persimmon genotypes.
In this study, the efficiencies of ISSR and SCoT molecular markers in the evaluation of persimmon genetic diversity were compared. Based on the results, the rate of polymorphic band was 100% for both SCoT and ISSR markers, indicating the high efficacy of both markers in discriminating the persimmon genotypes (Amom et al., Citation2020). Similar polymorphism rate was reported by Yuan et al. (Citation2012), who analyzed genetic diversity of ‘Luotian-tianshi’ genotypes using 11 ISSR primers. Deng et al. (Citation2015) reported 96.68% polymorphism rate when analyzing genetic diversity of Diospyros genotypes using 18 SCoT primers, and Yang et al. (Citation2015) reported 94.07% polymorphism in a study on D. lotus genotypes using 11 SCoT primers.
The efficiency of a molecular marker in genetic diversity analysis is also determined by other indicators, such as number of bands per primer, PIC, and MI indices (Jing et al., Citation2013). In this study, SCoT markers produced higher number of bands per primer (7.5) than ISSR markers (6), indicating higher efficacy of the SCoT markers in the analysis of the studied genotypes. In accordance to our results SCoT markers produced higher bands per primer than ISSR markers in potato (Gorji et al., Citation2011) and bamboo (Amom et al., Citation2020) genotypes.
Maximum PIC value for the dominant markers was 0.5, and the markers with the equal distribution in the population had higher PIC value (Chesnokov and Artemyeva, Citation2015). Most of the studied markers in this research had PIC values more than 0.35 (average PIC was 0.43 for ISSR markers and 0.36 for SCoT markers). Relative high PIC values in this study revealed the informativeness and discriminating power of both markers (Amom et al., Citation2020). Yuan et al. (Citation2012) evaluated genetic diversity of Diospyros genotypes and reported only 0.2 PIC value for ISSR markers, and Tyagi et al. (Citation2020) reported 0.14 PIC value for SCoT markers in analyzing genetic diversity of Sponge gourd.
MI value determines the ability of each marker to detect the polymorphic loci among the genotypes (Etminan et al., Citation2018). In our study, the average MI values for ISSR and SCoT markers were 1.81 and 1.79, respectively. These relatively similar MI values showed that ISSR and SCoT markers have similar ability in the evaluation of genetic diversity among the persimmon genotypes. Similar MI value was also reported by Yuan et al. (Citation2012), who studied the diversity among persimmon genotypes using ISSR and IRAP markers.
Relatively high PIC and MI values observed in the present study indicated that these two markers are highly informative and would be useful for screening the persimmon genotypes. In accordance with these results, different reports on a wide range of crop species such as bamboos (Amom et al., Citation2020), date palm (Saboori et al., Citation2020), mango (Zhou et al., Citation2020), Persian walnut (Tabasi et al., Citation2020), Ziziphus jujube (Shen et al., Citation2020), Papaver bracteatum (Qaderi et al., Citation2019), Luffa cylindrica (Tyagi et al., Citation2020), Salvia spp. (Etminan et al., Citation2018), Andrographis paniculata (Tiwari et al., Citation2016), Quercus infectoria (Rahmani et al., Citation2015) and persimmon (Deng et al., Citation2015; Guan et al., Citation2020; Yang et al., Citation2015; Yuan et al., Citation2012) have shown that ISSR and SCoT markers can be successfully used for estimating genetic diversity at inter- and intra-specific levels.
Considering all the results, based on the PIC and MI values, ISSR marker was more effective than SCoT marker in the assessment of genetic diversity among the persimmon genotypes (Etminan et al., Citation2018; Pour-Aboughadareh et al., Citation2018). On the other hand, the total number of bands and the average of bands per primer in SCoT marker were higher than those of ISSR marker, indicating the higher efficiency of SCoT marker in assessing genetic diversity among the persimmon genotypes (Amom et al., Citation2020). However, clustering analysis, obtained from the dendrogram generated by ISSR data showed that D. kaki and D. lotus genotypes were not separated from each other, and also D. virginiania and D. lotus genotypes were not separated completely based on the dendrogram generated by SCoT data, while D. kaki, D. virginiania, and D. lotus genotypes as three different species were clearly separated from each other based on the dendrogram generated by combining data of the two markers (ISSR + SCoT). It seems that combination of the two markers distinguished diversity among the Diospyros genotypes better than each marker alone. Similar result was reported by Qaderi et al. (Citation2019) who studied Iranian poppy genetic variation and noted that combination of ISSR and SCoT markers data tended to generate more reliable clustering pattern than each marker alone. In line with our results, Guan et al. (Citation2020) in analyzing genetic diversity of 268 Diospyros accessions using SCoT markers reported that genotypes from different species were not separated from each other. However, in contrast with our results, Deng et al. (Citation2015) showed that D. kaki, D. oleifera, and D. lotus genotypes from Guangxi region of China were clearly separated from each other by SCoT markers.
Mantel test results showed that there was significant correlation (r = 0.56) between ISSR and SCoT markers, indicating that the rate of genetic diversity of the genotypes was approximately equal when SCoT or ISSR markers were used (Pakseresht et al., Citation2013). However, these two markers target different regions of the genome, SCoT is gene targeted marker and ISSR target mostly the non-coding regions of the genome; therefore, combined use of these two markers could amplify more loci of the genome and provide reliable results (Baghizadeh and Dehghan, Citation2018; Tyagi et al., Citation2020).
Clustering of the pooled data showed that there were four distinct clusters among the 57 Diospyros genotypes collected from the different regions of Iran. The first cluster consisted of more D. kaki genotypes arising from different parts of Iran; all of them were round shaped. The second cluster consisted of other D. kaki genotypes; some of them were round and some were conical shaped. The third and fourth clusters included D. lotus and D. virginiana genotypes, respectively. This clustering pattern is further confirmed by grouping (distribution) generated based on PCoA results. Similarity between clustering pattern of the UPGMA dendrogram and PCoA results has been reported in several genetic diversity studies (Amom et al., Citation2020; Etminan et al., Citation2018; Rahmani et al., Citation2015).
Cluster analyses based on the ISSR, SCoT, or combined data showed that all D. lotus genotypes, collected from Alborz, Isfahan, and Mazandaran provinces, were placed in the same cluster, indicating that the genotypes, regardless of their geographically origin, are not genetically spaced. This result can be explained by the fact that D. lotus has been distributed in northern forests of Iran from ancient time and since its seeds are used as rootstock for Japanese persimmon, perhaps the seeds are spread from northern forests to other parts of Iran. Regarding the genotypes studied here, which showed similar origin regardless of collection sites, it is possible that farmers share the seeds regardless of their origins (Houmanat et al., Citation2021).
In the case of D. virginiana, the genotypes were clustered together based on the ISSR data, but they were classified in different clusters based on the SCoT data. SCoT, a gene targeted functional marker, is more reliable than ISSR, which is a marker that targets the non-coding regions of the genome, so SCoT is effective technique for identifying cultivars (Amom et al., Citation2020; Tabasi et al., Citation2020). Based on the results, the D. virginiana genotypes studied here had different genotypic backgrounds probably owing to this fact that they originated from dissimilar origins (Houmanat et al., Citation2021). The origin and the date of D. virginiana introduction to Iran is unknown.
Genetic variation is essential for breeding programs and crop improvement (Govindaraj et al., Citation2015; Zarei and Erfani-Moghadam, Citation2021). Clustering analysis based on ISSR, SCoT, and combined data showed that Diospyros kaki genotypes studied here were genetically different and presented high level of genetic variation. This high level of genetic diversity can be explained by the fact that although the exact time of the introduction of edible persimmon to Iran is unknown, different genotypes have been probably introduced from different countries to Iran and spread in different parts of the country. In other scenario, although persimmon is today propagated by grafting, its seed propagation at earlier time resulted in the increase of genetic diversity due to the high heterozygosity (Guan et al., Citation2019; Yesiloglu et al., Citation2018). Exploring the exact origin and spreading process of edible persimmon in Iran merits further investigation in the future. This genetic diversity in edible persimmon in Iran has provided great opportunity for breeders to use the data for breeding programs and introducing new cultivars (Yang et al., Citation2015). Recently, the interest in this fruit has been increased in Iran (Khademi et al., Citation2010). Similarly, high genetic diversity among the D. kaki genotypes has been reported by other researchers (Badenes et al., Citation2003; Del Mar Naval et al., Citation2010; Guan et al., Citation2019).
The results of cluster analysis presented here did not show a significant correlation between the banding patterns of edible persimmon genotypes and their sampling area. For instant, the genotypes KA5, KA6, KA7, KA8, KA9, and KA10 collected from Alborz province, genotypes II1, II2, NI2, and KI collected from Isfahan province and genotype SF1 collected from Fars province were placed in the same cluster; or among the genotypes RM2, RM3, and RM4 collected from Ramsar, the genotype RM4 was clearly separated from the genotypes RM2 and RM3. The same separation was found for genotypes YK1 and YK2, which were collected from Yasouj. These results suggest that samples collected from different geographical locations may have the same origin and genetic structure. In agreement with our results, Tiwari et al. (Citation2016) in evaluation of genetic diversity of Andrographis paniculata using SCoT and ISSR markers, and Saboori et al. (Citation2020) in evaluation of genetic structure of date palm cultivars using SCoT markers did not find clear association between genotypes clustering pattern and geographical distribution.
Conclusion
Persimmon, one of the most important fruits in the world, has been cultivated in different regions of Iran for more than two hundred years, but no data has been reported regarding the genetic variation among Iranian persimmons so far. Gaining knowledge about the genetic diversity is essential for plant breeding and germplasm conservation. In this study, SCoT and ISSR molecular markers successfully assessed genetic diversity among Diospyros genotypes collected from different areas of Iran; thus, they can be used in combined form for diagnostic fingerprinting of the persimmons. The results of the current research, as the first report, indicated that Diospyros germplasm resources in Iran have rich diversities, allowing the development of strategies for preserving Diospyros germplasm and utilizing them in breeding programs.
Supplemental Material
Download MS Excel (113.1 KB)Disclosure Statement
No potential conflict of interest was reported by the author(s).
Supplementary Material
Supplemental data for this article can be accessed on the publisher’s website
Related Research Data
References
- Amom, T., L. Tikendra, N. Apana, M. Goutam, P. Sonia, A.S. Koijam, A.M. Potshangbam, H. Rahaman, and P. Nongdam. 2020. Efficiency of RAPD, ISSR, iPBS, Scot and phytochemical markers in the genetic relationship study of five native and economical important bamboos of North-East India. Phytochemistry 174:112330.
- Aras, S., A. Duran, and G. Yenilmez. 2003. Isolation of DNA for RAPD analysis from dry leaf material of some Hesperis L. specimens. Plant Mol. Biol 21:461.
- Badenes, M., A. Garcés, C. Romero, M. Romero, J. Clavé, M. Rovira, and G. Llácer. 2003. Genetic diversity of introduced and local Spanish persimmon cultivars revealed by RAPD markers. Genet. Resour. Crop Evol. 50:579–585.
- Baghizadeh, A., and E. Dehghan. 2018. Efficacy of Scot and ISSR markers in assessment of genetic diversity in some Iranian pistachio (Pistacia vera L.) cultivars. Pistachio. Health J. 1:37–43.
- Chesnokov, Y.V., and A.M. Artemyeva. 2015. Evaluation of the measure of polymorphism information of genetic diversity. Agric. Biol. 50:571–578.
- Del Mar Naval, M., E. Zuriaga, S. Pecchioli, G. Llácer, E. Giordani, and M.L. Badenes. 2010. Analysis of genetic diversity among persimmon cultivars using microsatellite markers. Tree Genet. Genomes. 6:677–687.
- Deng, L., Q. Liang, X. He, C. Luo, H. Chen, and Z. Qin. 2015. Investigation and analysis of genetic diversity of Diospyros germplasms using Scot molecular markers in Guangxi. PLOS One 10:1–13.
- Du, X.Y., Q.L. Zhang, and Z.R. Luo. 2009. Comparison of four molecular markers for genetic analysis in Diospyros L. (Ebenaceae). Plant Syst. Evol 281:171–181.
- Etminan, A., A. Pour-Aboughadareh, A. Noori, A. Ahmadi-Rad, L. Shooshtari, Z. Mahdavian, and M. Yousefiazar-Khanian. 2018. Genetic relationships and diversity among wild Salvia accessions revealed by ISSR and Scot markers. Biotechnol. Biotechnol. Equip. 32:610–617.
- FAO. 2019. FAOSTAT, FAO statistical databases. Downloaded from http://faostat.fao.org 15/4/2012.
- Gorji, A.M., P. Poczai, Z. Polgar, and J. Taller. 2011. Efficiency of arbitrarily amplified dominant markers (Scot, ISSR and RAPD) for diagnostic fingerprinting in tetraploid potato. Am. J. Potato Res. 88:226–237.
- Govindaraj, M., M. Vetriventhan, and M. Srinivasan. 2015. Importance of genetic diversity assessment in crop plants and its recent advances: An overview of its analytical perspectives. Genet. Res. Int. 2015:431487.
- Guan, C., S. Chachar, P. Zhang, C. Hu, R. Wang, and Y. Yang. 2020. Inter-and intra-specific genetic diversity in Diospyros Using Scot and IRAP markers. Hortic. Plant J. 6:71–80.
- Guan, C., P. Zhang, C. Hu, S. Chachar, A. Riaz, R. Wang, and Y. Yang. 2019. Genetic diversity, germplasm identification and population structure of Diospyros kaki Thunb. from different geographic regions in China using SSR markers. Sci. Hortic 251:233–240.
- Guo, D.L., and Z.R. Luo. 2011. Genetic relationships of the Japanese persimmon Diospyros kaki (Ebenaceae) and related species revealed by SSR analysis. Genet Mol. Res. 10:1060–1068.
- Guo, D.L., H.Q. Zhang, and Z.R. Luo. 2006. Genetic relationships of Diospyros kaki Thunb. and related species revealed by IRAP and REMAP analysis. Plant Sci. 170:528–533.
- Houmanat, K., K. Abdellah, L. Hssaini, R. Razouk, H. Hanine, S. Jaafary, and J. Charafi. 2021. Molecular diversity of Walnut (Juglans regia L.) among two major areas in Morocco in contrast with foreign varieties. Int. J. Fruit Sci 2021:1–13.
- Hu, D.C., and Z.R. Luo. 2006. Polymorphisms of amplified mitochondrial DNA non-coding regions in Diospyros spp. Sci. Hortic. 109:275–281.
- Hu, D.C., Q.L. Zhang, and Z.R. Luo. 2008. Phylogenetic analysis in some Diospyros spp (Ebenaceae) and Japanese persimmon using chloroplast DNA PCR-RFLP markers. Sci. Hortic. 117:32–38.
- Jing, Z., X. Ruan, R. Wang, and Y. Yang. 2013. Genetic diversity and relationships between and within persimmon (Diospyros L.) wild species and cultivated varieties by SRAP markers. Plant Syst. Evol 299:1485–1492.
- Kanzaki, S., K. Yonemori, A. Sato, M. Yamada, and A. Sugiura. 2000. Analysis of the genetic relationships among pollination-constant and non-astringent (PCNA) cultivars of persimmon (Diospyros kaki Thunb.) from Japan and China using amplified fragment length polymorphism (AFLP). J. Jpn. Soc. Hortic. Sci 69:665–670.
- Khademi, O., Y. Mostofi, Z. Zamani, and R. Fatahi. 2010. The effect of deastringency treatments on increasing the marketability of persimmon fruit. Acta Hortic. 877:687–691.
- Maki, S., K. Oyama, T. Kurahashi, T. Nakahira, T. Kawabata, and T. Yamada. 2001. RFLP analysis for cultivar identification of persimmons. Sci. Hortic. 91:407–412.
- Pakseresht, F., R. Talebi, and E. Karami. 2013. Comparative assessment of ISSR, DAMD and Scot markers for evaluation of genetic diversity and conservation of landrace chickpea (Cicer arietinum L.) genotypes collected from north-west of Iran. Physiol. Mol. Biol. Plants 19:563–574.
- Pour-Aboughadareh, A., J. Ahmadi, A. Mehrabi, A. Etminan, and M. Moghaddam. 2018. Insight into the genetic variability analysis and relationships among some Aegilops and Triticum species, as genome progenitors of bread wheat, using Scot markers. Plant Biosyst. 152:694–703.
- Powell, W., M. Morgante, C. Andre, M. Hanafey, J. Vogel, S. Tingey, and A. Rafalski. 1996. The comparison of RFLP, RAPD, AFLP and SSR (microsatellite) markers for germplasm analysis. Mol. Breeding. 2:225–238.
- Qaderi, A., M. Omidi, A. Pour-Aboughadareh, P. Poczai, J. Shaghaghi, A. Mehrafarin, M. Ghorbani-Nohooji, and A. Etminan. 2019. Molecular diversity and phytochemical variability in the Iranian poppy (Papaver bracteatum Lindl.): A baseline for conservation and utilization in future breeding programs. Ind. Crops Prod 130:237–247.
- Rahmani, M.S., L. Alikhani, N. Shabanian, and A. Khadivi-Khub. 2015. Genetic differentiation in Quercus infectoria from northwest of Iran revealed by different nuclear markers. Tree Genet. Genomes. 11:800.
- Rholf, F. 2000. Numerical taxonomy and multivariate analysis system: Version 2.10. Exeter Software, Setauket, NY.
- Saboori, S., Z. Noormohammadi, M. Sheidai, and S. Marashi. 2020. Scot molecular markers and genetic fingerprinting of date palm (Phoenix dactylifera L.) cultivars. Genet. Resour. Crop Evol 67:73–82.
- Shen, J., Z. Sun, S. Hou, R. Liu, Y. Wang, and P. Guo. 2020. Assessment of genetic diversity in Ziziphus jujube Mill. Cultivars derived from northern China using inter‐simple sequence repeat markers. Crop Sci. 60:320–329.
- Smith, J.S.C., E.C.L. Chin, H. Shu, and O.S. Smith. 1997. An evaluation of the utility of SSR loci as molecular markers in maize (Zea mays L): Comparisons with data from RFLPs and pedigree. Theor. Appl. Genet. 95:163–173.
- Tabasi, M., M. Sheidai, D. Hassani, and F. Koohdar. 2020. DNA fingerprinting and genetic diversity analysis with Scot markers of Persian walnut populations (Juglans regia L.) in Iran. Genet. Resour. Crop Evol. doi: 10.1007/s10722-020-00914-7.
- Tiwari, G., R. Singh, N. Singh, D.R. Choudhury, R. Paliwal, A. Kumar, and V. Gupta. 2016. Study of arbitrarily amplified (RAPD and ISSR) and gene targeted (Scot and CBDP) markers for genetic diversity and population structure in Kalmegh [Andrographis paniculata (Burm. f.) Nees]. Ind. Crops Prod 86:1–11.
- Tyagi, R., V. Sharma, A.K. Sureja, A.D. Munshi, L. Arya, D. Saha, and M. Verma. 2020. Genetic diversity and population structure detection in sponge gourd (Luffa cylindrica) using ISSR, Scot and morphological markers. Physiol. Mol. Biol. Plants 26:119–131.
- Uddin, M.S., and Q. Cheng. 2015. Recent application of biotechniques for the improvement of Mango research, p. 195–212. In: P. Poltronieri, and H. Yiguo (eds.). Applied plant genomics and biotechnology. Sawston, Cambridge, UK: Woodhead Publishing Limited.
- Yamagishi, M., S. Matsumoto, A. Nakatsuka, and H. Itamura. 2005. Identification of persimmon (Diospyros kaki) cultivars and phenetic relationships between Diospyros species by more effective RAPD analysis. Sci. Hortic. 105:283–290.
- Yang, Y., Z.B. Jing, X.F. Ruan, and J.M. Cheng. 2015. Development of simple sequence repeat markers in persimmon (Diospyros L.) and their potential use in related species. Genet. Mol. Res 14:609–618.
- Yesiloglu, T., B. Cimen, M. Incesu, and B. Yilmaz. 2018. Genetic diversity and breeding of persimmon. In: J. Soneji, and M. Nageswara-Rao (eds.). Breeding and health benefits of fruit and nut crops pp. 21–46. IntechOpen Limited, London.
- Yuan, L., Q. Zhang, D. Guo, and Z. Luo. 2012. Genetic differences among ‘Luotian-tianshi’ (Diospyros kaki Thunb.) genotypes native to China revealed by ISSR and IRAP markers. Sci. Hortic 137:75–80.
- Zarei, A., and J. Erfani-Moghadam. 2021. Scot markers provide insight into the genetic diversity, population structure and phylogenetic relationships among three Pistacia species of Iran. Genet. Resour. Crop Evol. 2021:1–19.
- Zhou, L., X.H. He, H.X. Yu, M.Y. Chen, Y. Fan, X.J. Zhang, Z.B. Fang, and C. Luo. 2020. Evaluation of the genetic diversity of Mango (Mangifera indica L.) seedling germplasm resources and their potential parents with start codon targeted (Scot) markers. Genet. Resour. Crop Evol 67:41–58.