
 ?Mathematical formulae have been encoded as MathML and are displayed in this HTML version using MathJax in order to improve their display. Uncheck the box to turn MathJax off. This feature requires Javascript. Click on a formula to zoom.
ABSTRACT
Attempts had been made to optimize nitrogen (N), phosphorus (P) and potassium (K) fertilization rates for increased fruit performance of Chinese cherry (Prunus pseudocerasus Lindl.). This study was conducted using a randomized block design (RBD) consisting of three factors and four levels, totaling to 14 treatments with each treatment repeated in triplicate. The results illustrated that the fertilization application increased the trunk, leaf, crown and new shoot growth, however, the optimal combination of N, P, and K (NPK) fertilization for growth varied among different parts of the young tree. Moreover, the fruit weight and size, internal quality, and fruit set rate (FSR) were positively affected by fertilization. Specifically, the no. 12 treatment (0.3 kg N + 0.4 kg P + 0.2 kg K) contained the optimal NPK combination for enhanced fruit size and cherry fruit set. Similarly, although the treatment is not the maximum of NPK concentration, the no. 12 treatment for mean daily values of Pn (MDVP) and the NPK concentration in leaf was significantly higher compared to other treatments. Additionally, Pearson’s correlation analysis suggests that the FSR was positively and significantly correlated with fruit weight (FW), fruit vertical diameter (FVD) and the soluble sugars (SS) in fruit. In general, the no. 12 treatment was the optimal NPK fertilization rates for young tree growth, fruit quality of Chinese cherry (Prunus pseudocerasus Lindl.) in the Karst region of southwest China.
Introduction
Chinese cherry (Prunus pseudocerasus Lindl.) is characterized by early ripening, succulence, and its richness in vitamins and antioxidants (Tian et al., Citation2019). However, the decline of fruit quality and the reduction of yield caused by unbalanced fertilization and severely inhibited commercial satisfaction, which restricts the sustainable development of Chinese cherry production.
The yield and fruit quality in fruit trees are not only cultivar-dependent but also determined by other factors such as temperature, rainfall, and cultivation method (e.g. open-air or protected cultivation) (Polat et al., Citation2005; Woznicki et al., Citation2015). Previous studies have illustrated that soil nutrient content is very importance for fruit quality and yield. For instance, Farida (Citation2005) reported that soil nitrogen (N) and phosphorus (P) had a significant and positive correlation with leaf N and P, as well as fruit quality in total soluble solids and total sugars of apple grown in Zangier block of district Baramulla Kashmir. Li et al. (Citation2015) found that the leaf nutrient status primarily depended on soil acidity and nutrition, which eventually affected the fruit quality of pummelo trees grown in the south of Fujian Province of China.
As a way to improve soil nutrition, fertilizer application plays a vital role in this process. Typically, the influence of NPK application rates on fruit yield increase had been widely illustrated in many tree species during the past decades. Quaggio et al. (Citation2002) set up in an incomplete factorial design of (1/2) 43 type and established the quantitative relationship of lemon fruit yield with N, P, K (NPK) fertilizer application ratio of N 220 kg + P 20 kg + K 310 kg per ha as the optimal treatment for maximum lemon fruit yield in Sao Paulo, Brazil. Fruit yield of two sweet orange varieties, Valencia and Pêra was markedly affected by N, P and K fertilization rate (José et al., Citation2006). The maximum yield of sweet orange cultivar Pêra and Valencia was attained, respectively, with N rates of (189 and 193) kg per ha. Moreover, previous studies have confirmed that N, P and K fertilization rate is of utmost importance for fruit quality. Sossa et al. (Citation2019) found that optimal N, P and K fertilization percentage could remarkably enhance the fruit quality of pineapple, and therefore to satisfy the European export standards and domestic consumption. Nasreen et al. (Citation2013) confirmed that application of N 300 g + P 125 g + K 225 g per tree would be economically optimum for achieving better fruit quality in citrus grown under piedmont plain soil. However, it was found that the fertilizer application sometimes but not always improved Nanguo’ Pear fruit quality attributes and fruit set, and the fertilization strategies play a pivotal role in the processing (Liu et al., Citation2013).
In Guizhou province, Chinese cherry (P. pseudocerasus) has been widely cultivated in recent years due to the high economic benefit. However, the defects of uneven fruit quality and unstable fruit yield caused by unreasonable fertilization applications negatively affect the crop. Therefore, the objective of this study was to investigate the optimization of NPK fertilization rates for tree growth, fruit quality, and yield of Chinese cherry (P. pseudocerasus) in the Karst region of southwest China.
Materials and Methods
Experimental Material
The experiment was carried out using 3-years-old cherry trees (cultivar ‘Manaohong’) during the seasons 2017 to 2018 in Liuzhi Special District (105°47′E 26°21′N), Guizhou Province, China. The orchard had a warm temperate continental monsoon climate, characterized by an average total annual precipitation of 1,045 mm and mean annual sunshine hours of 1,252.4 h as well as an average annual temperature of 14.5°C. The 3-year-old cherry trees with slender spindle shape were planted in the rows spacing 3.5 × 3.5 m and grown to a height of approximately 3.5 m. At the stage of fruit maturation (from early to mid-April), a sample of 12 randomly obtained fruits was harvested from the east, south, west and north of each tree early morning, stored in an icebox and frozen at −20°C separately until further use. The soil of the experimental field had sandy loam texture, with good water holding capacity, and well-drained with moderate soil fertility status.
Experimental Design
The experiment was carried out over a large area (667 m2) with consistently separate treatment groups without any overlap. The area was divided into three treatment plots and each replicate plot contained 14 trees, which were randomly selected having the same growth vigor. The treatments were set up as a randomized block experiment of N (urea, including N 46%), P (calcium superphosphate, including 16% P2O5), K (potassium chloride, including 50% K2O) three factors and four levels, totaling to 14 treatments (). The organic fertilizer (cattle manure) was applied at 50 kg per plant as base fertilizer in the autumn and winter. For the NPK group, 80% of the urea, 100% of calcium superphosphate, and 80% of potassium chloride were applied in late January as topdressing before flowering. In late May, 20% of the urea and 20% potassium chloride were applied as postharvest topdressing. The fertilization method was digging circular troughs on the three set placements and backfilling the soil after the fertilization. The depth of the furrows for base fertilizer and topdressing ranged from 40–50 cm and 20–25 cm, respectively. The fertilizer was evenly sprayed into the troughs.
Table 1. The N, P, K three factors and its levels.
Investigation of Tree Growth
The trunk height (TH), trunk diameter (TD) and the crown width (CW) from east to west (E→W) and south to north (S→N) were measured separately at the initial period of new shoot growth on April 10 (N1) and the end-stage on September 10 (N2). The amount of growth of the trunk and crown was calculated separately according to the below equation, with an average of three replicates. Furthermore, for each tree, the new shoot length (NSL), new shoot diameter (NSD), leaf length (LL), and leaf width (LW) were examined separately from east, south, west, and north on September 10.
Growth amount (cm) = N2 – N1
Determination of Fruit Exterior Quality and Fruit Set Rate
The fresh weight of single fruit (FW in g) was determined using an analytical balance (Mettler-Toledo AL204, China). Fruit vertical diameters (FVD in mm) and fruit horizontal diameters (FHD in mm) were measured by a Vernier caliper (Nscing Es, China). The twelve replicates for each measurement were averaged. Moreover, four branches with similar size from east, south, west, and north were tagged, and the flower bud numbers (N1) and fruit numbers (N2) of each tagged branch were examined separately before flowering and at the fruit maturation stage. The fruit set rate (FSR) was then calculated according to the following equation, with twelve replicates collected and averaged.
Detection of Fruit Internal Quality
The levels of soluble solids (SSL as %), titratable acid (TA as %), and soluble sugars (SS as %) were assessed using the juice obtained from twelve random fruits. The juice was extracted from the fruit center using the delicate automatic extractor (SamTech, Mannersdorf, Austria). The concentration of soluble solids (SSL) was determined at 20°C using a refractometer (SHGWYT-2, 0–32%, China). Titratable acidity (TA) was determined by titration with 0.05 mol/L NaOH to pH 8.2. Soluble sugar (SS) was measured through anthrone-H2SO4 colorimetry. In addition, the content of Vitamin C (Vc) was measured according to Hodges et al. (Citation1996) and was expressed in mg 100 FW/g.
Measurement of Photosynthesis, and Mineral Nutrition
At fruit ripening period, 9 leaves (the fifth to seventh leaf positions from the base of the new shoots) in the north of the canopy for each treatment were selected to assessment of their net photosynthetic rate (Pn) using a portable photosynthesis system (Li-6400 XT, Li-Cor, Inc., USA). The leaf chamber set at 25°C, 65–75% humidity, and the reference CO2 concentration maintained at 450 μmol·mol−1 during the processing. To provide more representative data, the Pn was measured hourly on sunny days from 07:30–17:30, and the mean daily values of Pn (MDVP) were taken as the average of all-day measurements. Additionally, 12 leaves of the fifth to seventh leaf positions of the just-mentioned shoots were randomly taken from the east, south, west and north of each tree and stored in an icebox and frozen at −20°C. The levels of leaf mineral nutrients were determined after dry-ashing at 450°C in a muffle oven (HEROTEC) and digestion of the ashes with 1 M HNO3. The leaf N content was determined using the Kjeldahl method (Kara et al., Citation2015). The leaf P content was assessed by the vanadomolybdate colorimetric procedure with a JENWAY 6405 UV/V spectrophotometer (Milan, Italy), and the leaf K level was tested by atomic emission spectrophotometry (JENWAY PFP7, Milan, Italy). (Pramanick et al., Citation2014)
Statistical Analysis
Differences in growth amount of cherry trees (i.e. TH, TD, CW, NSL, NSD, LL, and LD) and fruit quality (i.e. FW, FVD, FHD, and MDVP) were compared by the one-way analysis of variance (ANOVA) (p < .05). The diversity of the fruit internal qualities (i.e. SSL, TA, SS, VC, and FSR) and leaf NPK content were transformed by arcsine formula to obtain normal distribution data before analyzing with ANOVA (p < .05). Pearson’s correlation analysis (PCA) was used to evaluate the Pearson correlation coefficient between the fruit quality and leaf physiological characteristics using SPSS 22.0 statistical software. A heatmap was produced using the R package function heatmap.2 (http://cran.r-project.org/web/package-/gp-lots/index.tml).
Result
The Growth Amount of Chinese Cherry
The growth amount of cherry trees under different fertilizer treatments are presented in . The TH value of the no. 12 (49.60 cm) and no. 14 treatment (50.05 cm) were the highest compared to the rest of the treatments, followed by the no. 5 (46.33 cm). The lowest value of TH was observed in CK (23.25 cm). The highest TD value was detected in the no. 9 (9.56 cm), no. 12 (9.45 cm), and no. 14 (9.44 cm) treatments compared to the other treatments, although no obvious differences were observed among these treatments. The lowest value of TD was also observed in CK (7.45 cm). With regards to CW growth, the amount of E→W and S→N increased significantly in no. 12 (114.33 and 109.55 cm) compared to other treatments, of which the lowest values of E→W and S→N all were observed in CK (23.23 and 32.89 cm). NSL and NSD all ranked highest in the new shoot growth in no. 12 treatment (86.67 and 1.44 cm), followed by no. 3 (81.12 cm), no. 6 (81.27 cm), and no. 13 (82.91 cm) treatments for NSL and no. 7 (1.34 cm) for NSD. The NSL and NSD in CK (64.05 and 1.01 cm) were lower than that of other treatments.
Table 2. The growth amount of Chinese cherry tree under different fertilizer treatments.
Fruit Exterior Quality and Fruit Set Rate of Chinese Cherry
The fruit exterior indicators of cherry were presented in . The fertilizer application significantly increased the FW compared to CK (3.37 g). The greatest FW value was recorded under no. 12 (3.93 g) treatment, followed by no. 7 (3.82 g), and no. 14 (3.81 g). Moreover, fertilizer application differentially affected fruit size parameters (i.e. FVD and FHD). The highest value of FVD was observed under no. 7 (18.35 mm), no. 9 (18.24 mm), no. 12 (18.15 mm), and no. 14 (18.23 mm) treatments. The highest FHD value was recorded under the no. 12 (21.11 mm) treatment, while the lowest value was observed in the CK (19.17 mm) and the no. 8 treatment (19.31 mm). In addition, the estimates of FSR () indicated that the fertilizer application increased the fruit setting of cherry compared to the CK (50.34%), and the no. 7 (65.10%), no. 8 (64.15%), no. 9 (64.18%), no. 12 (64.16%), and no. 14 (64.09%) treatments marked the highest set rate, remarkably higher than other treatments.
Table 3. Fruit exterior indicators and fruit set ratio of Chinese cherry under different fertilizer treatments.
Fruit Interior Quality
The application of NPK to the soil resulted in a significant increase of SSL, SS, and VC content in the cherry fruit compared to the CK (). The highest values of SSL concentration were detected separately in no. 3 (14.44%), no. 5 (14.29%), no. 8 (14.89%), no. 10 (14.13%), and no. 12 (14.35%) treatments. The highest SS and VC content in fruit was recorded under the no. 12 treatment at 12.42 and 17.13%, respectively. Conversely, the application of fertilizer markedly reduced the TA level in fruit, with the highest TA content identified in the CK (0.61%), and the lowest TA concentration was obtained under the no. 12 treatment at 0.53%.
Table 4. Fruit internal quality of Chinese cherry under different fertilizer treatments.
The Leaf Size, Photosynthesis, and Mineral Nutrition
The leaf size, photosynthesis, and mineral nutrition were significantly influenced by the the application of NPK (). The amount of LL and LW increased notably in no. 12 (16.62 cm and 8.67 cm) compared to other treatments, of which the lowest values of LL and LW all were observed in CK (12.05 and 7.33 cm). The highest MDVP values were recorded under the no. 3 (5.80 μmol CO2·m−2·s), no. 5 (5.83 μmol CO2·m−2·s), no. 8 (5.87 μmol CO2·m−2·s), no. 12 (6.03 μmol CO2·m−2·s), and no. 14 (5.75 μmol CO2·m−2·s) treatments. Moreover, fertilizer application differentially affected the N, P, K contents in leaf. The greatest values of N and K concentrations were all detected in no. 12 treatment at 3.85% and 1.81% respectively, while the lowest values were observed in the CK at 3.36% and 1.47%, respectively. Conversely, no obvious difference was investigated among those treatments in leaf P level.
Table 5. Leaf size, photosynthesis, and mineral nutrition of Chinese cherry under different fertilizer treatments.
The Relationship between Fruit Quality and Leaf Physiological Characteristics
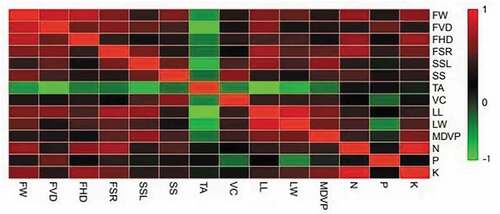
The results of the correlation analyses of fruit quality and leaf physiological characteristics are shown in . For the fruit quality, the FW value showed a significantly positive correlation with FVD (R = 0.835**), FHD (R = 0.798**), FSR (R = 0.622*) and SS (R = 0.610*). The FVD value was positively and significantly correlated with FHD (R = 0.590*), FSR (R = 0.635*) and SSL (R = 0.556*), while being negatively and significantly correlated with TA (R = −0.536*). FSR displayed a significantly positive correlation with SSL content (R = 0.606*), which was positively and significantly correlated with SS content (R = 0.577*). Moreover, obvious correlations among some leaf physiological characteristics were also found, including LL, which was positively and significantly correlated with LW (R = 0.846**) and MDVP (R = 0.603*), and the remarkable correlation between LW and MDVP (R = 0.581*); The leaf K content showed a significantly positive correlation with MDVP (R = 0.610*) and leaf N concentration (R = 0.898**). Furthermore, a significant and positive correlation between fruit quality and leaf physiological characteristics was observed. FW value was positively and significantly correlated with LL (R = 0.612*), LW (R = 0.551*), N concentration in leaf (R = 0.680*), and K level in leaf (R = 0.653*). The FVD was positively and obviously correlated with LL value (R = 0.612*) and P concentration (R = 0.549*). The FHD value was positively and significantly correlated with N content (R = 0.657*) and K level (R = 0.684**). In addition, the FSR showed a significantly positive correlation with LL (R = 0.708**), N content (R = 0.703**) and K level (R = 0.569*).
Figure 1. Pearson correlation heatmap of fruit qualities and leaf physiological characteristics. Fruit quality including fruit weight (FW), fruit vertical diameter (FVD), fruit horizontal diameter (FHD), fruit set rate (FSR), soluble solids (SSL), titratable acid (TA), soluble sugars (SS), Vitamin C (Vc). Leaf physiological characteristics including leaf length (LL), leaf width (LW), mean daily values of Pn (MDVP), and leaf N (N), leaf P (P) and leaf K(K) level. The scale runs from -1 - 1 (-1= green, 1= red), which represents correlation coefficient between the fruit qualities and leaf physiological characteristics runs from -1 - 1.
Discussion
Optimal fertilizer application significantly affects tree growth, which has been confirmed for many tree species, e.g., peach (Verma et al., Citation2017), and apple (Zhang et al., Citation2017), citrus (Wan et al., Citation2021). In this study, we found that the fertilizer application could notably improves the tree growth of Chinese cherry, among which the no. 9, no. 12 and no. 14 treatments were generally superior to other treatments regarding trunk growth. However, the optimal combination of NPK fertilizer for crown and new shoot growth was only recorded under no. 12 treatment. This suggest that the optimal combination of NPK fertilizer for overall growth varied among different parts of the tree, which was similar to the study of Mkhabela et al. (Citation2020), who illustrated the highest leaf width (29.8 cm) was achieved from plants fertilized using 7.5 tons/ha biocompost, however, the highest dry matter content (65.1%) was obtained from plants cultivated using 5.0 tons/ha biocompost.
A previous study demonstrated that fertilization affects fruit size and yield in many fruit species. For instance, Perween and Hasan (Citation2019) found that the plant height, number of fruits, average individual fruit weight, fruit size of dragon fruit has been influenced by NPK fertilization. However, Wrona (Citation2011) illustrated that the apple fruit size and yield did not depend on N fertilization at the Wilanów research farm with fertile silty loam alluvial soil. Overall, our findings demonstrated that no. 12 treatment was the optimal NPK combination for obvious enhancement of the cherry fruit size and set. Hence, we concluded that the fertilizer combination of 0.3 kg N + 0.4 kg P + 0.2 kg K (or no. 12 treatment) could enhance the soil nutrient availability for cherry fruit development in the southwest Karst region of China with sandy loam texture quality, which was similar to the results of Perween and Hasan (Citation2019), who reported that the maximum number of fruits per pillar (68.00), average individual fruit weight (222.03 g), and fruit yield (24.15 t/ha) were observed in T 5 (0.45 kg N + 0.35 kg P + 0.3 kg K/pillar). Furthermore, our observations demonstrated that the optimal NPK fertilization induced significantly increased the levels of SSL, SS, and VC. These results were similar to Nasreen et al. (Citation2013), who explicated that the application of N300P125K225 would be economically optimal for achieving higher yield and better fruit quality of citrus growing in Piedmont plain soil.
As the main organ for photosynthesis, leaf size notably affects plant photosynthesis and productivity (Mauri et al., Citation2020). In the current case, the total growth of LL, LW, and MDVP under the no. 12 treatment was significantly superior to other treatments. Interestingly, the highest content of SSL, SS, and VC was also obtained from the no. 12 treatment. The nutrients for leaf growth of a fruit tree primarily come from the soil and therefore properly managed fertilization is beneficial to leaf development and photosynthesis, providing the necessary energy not only for fruit yield but also for its quality improvement (Shunfeng et al., Citation2018). Moreover, it was found that the FSR was positively and significantly correlated with FW and FVD, which was in conformity with the results of Isa et al. (Citation2017). Also, the SS in fruit showed a positive correlation with FW, fruit size, MDVP, and FSR. The SS content in fruit was closely correlated with the photosynthetic capacity of the tree and the higher the photosynthetic capacity, the greater the accumulation of dry matter and so as the enhancement of fruit mass and FSR (Bertin et al., Citation2001).
Boughalleb et al. (Citation2011) previously showed that the percentages of N in citrus leaves were increased in proportion to the amount of N added. In the current work, however, we found that the fertilization significantly enhanced the N and K content in leaves, however, the greatest values were detected with the no. 12 treatment although it is not the maximum of N and K fertilizer application. The N and K content in the leaves likely increased with the added dose of fertilizer within a certain threshold, and when the dose exceeds the value the level declines (Quaggio et al., Citation2002). Additionally, the P level in cherry leaf did not show a significant difference among those treatments, which may be that the adequate P content is already present in the soil (Kawamura et al., Citation2011). Conclusively, the fertilizer application remarkably affects tree growth, fruit performance and yield. Generally, the no. 12 treatment was the optimal NPK fertilization rates for tree growth, fruit quality, and yield of Chinese cherry (Prunus pseudocerasus Lindl.) in the Karst region of southwest China. Further study is needed to assess the optimal fertilization treatment for older cherry tree and declare the mechanisms of tree growth and fruit performance regulated by NPK fertilizer.
Acknowledgments
The project was supported by grants from National Natural Science Foundation of China (Grant No. 32160700), and the Science and Technology Foundation of Guizhou Province, China (Grant No. [2020]1Y114, [2021]Yiban231).
Disclosure Statement
No potential conflict of interest was reported by the author(s).
Additional information
Funding
References
- Bertin, N., M. Buret, and C. Gary. 2001. Insights into the formation of tomato quality during fruit development. J. Hortic. Sci. Biotech. 76(6):786–792. doi: 10.1080/14620316.2001.11511446.
- Boughalleb, F., M. Mhamdi, and H. Hajlaoui. 2011. Response of young citrus trees to NPK fertilization under greenhouse and field conditions. Agr. Sci. 6(3):66–73. doi: 10.3923/aj.2011.66.73.
- Farida, A. 2005. Studies on relationship between fruit yield and quality with soil and leaf nutrient content in apple orchards of Zangier block of district Baramulla Kashmir. Ph.D. Thesis.
- Hodges, D.M., C.J. Andrews, D.A. Johnson, and R.I. Hamilton. 1997. Antioxidant compound responses to chilling stress in differentially sensitive inbred maize lines. J. Exp. Bot. 48(5):1105–1113. doi: 10.1093/jxb/48.5.1105.
- Isa, H.M., A.A. Manga, and M.A. Hussaini. 2017. Correlation and contribution of some growth and yield components to fruit yield of tomato (Solanum lycopersicon L.). J. Dryland Agric. 3(1):94–98. doi: 10.5897/JODA2022.0080.
- José, A.Q., D. Mattos, and H. Cantarella. 2006. Fruit yield and quality of sweet oranges affected by nitrogen, phosphorus and potassium fertilization in tropical soils. Fruits. 61:293–302. doi: 10.1051/fruits:.
- Kara, K., B. Güçlü, and E. Baytok. 2015. Comparison of nutrient composition and anti-methanogenic properties of different rosaceae species. J. Anim. Feed Sci. 24(4):308–314. doi: 10.22358/jafs/65613/2015.
- Kawamura, K., A.D. Mackay, M.P. Tuohy, K. Betteridge, I.D. Sanches, and Y. Inoue. 2011. Potential for spectral indices to remotely sense phosphorus and potassium content of legume-based pasture as a means of assessing soil phosphorus and potassium fertility status. Int. J. Remote. Sens. 32:103–124. doi: 10.1080/014311609034399-08.
- Li, Y., M.Q. Han, F. Lin, Y. Ten, J. Lin, and D.H. Zhu. 2015. Soil chemical properties, ‘guanximiyou’ pummelo leaf mineral nutrient status and fruit quality in the southern region of Fujian Province, China. J. Soil. Sci. Plant. Nut. 15:263–269. doi: 10.4067/s0718-95162015005-000029.
- Liu, X., Q. Chen, B. Wang, B. Zhang, J. Li, and L. Chen. 2013. Influences of different ratios of nitrogen supplied from manure and mineral fertilizers on ‘Nanguo’ pear growth and soil nutrient accumulation. Acta. Hortic. 984:257–262. doi: 10.17660/ActaHortic.2013.984.29.
- Mauri, R., A.A. Cardoso, M.M.D. Silva, L.A. Oliveira, F.M. Damatta, S.C.V. Martins, and F.M. DaMatta. 2020. Leaf hydraulic properties are decoupled from leaf area across coffee species. Trees. 34:1507–1514. doi: 10.1007/s00468-020-01983-y.
- Mkhabela, S.N., C.S. Mavuso, M.T. Masarirambi, and P.K. Wahome. 2020. The effects of different organic fertilizers on the vegetative growth and fruit yield of baby marrow (Cucurbita pepo L.) in Luyengo, Eswatini. Pediatr Qual Saf 9:49–67.
- Nasreen, S., R. Ahmed, M.A. Ullah, and M.A. Hoque. 2013. Effect of N, P, K, and Mg application on yield and fruit quality of mandarin (Citrus reticulata). Bangladesh J. Agri. Res. 38(3):425–433. doi: 10.3329/bjar.v38i3.16969.
- Perween, T., and A. Hasan. 2019. Growth, yield and quality of dragon fruit as influenced by NPK fertilization. Indian. J. Hortic 76(1):180–186. doi: 10.5958/0974-0112.-2019.00026.4.
- Polat, A.A., C. Durgac, and O. Caliskan. 2005. Effect of protected cultivation on the precocity, yield and fruit quality in loquat. Sci. Hortic 104(2):189–198. doi: 10.1016/j.sc-ienta.2004.08.018.
- Pramanick, B., K. Brahmachari, A. Ghosh, and S. Zodape. 2014. Effect of seaweed saps on growth and yield improvement of transplanted rice in old alluvial soil of West Bengal. Bangl. J. Bot. 43(1):53–58. doi: 10.3329/bjb.v43i1.19746.
- Quaggio, J.A., D. Mattos, H. Cantarella, E.L.E. Almeida, and S.A.B. Cardoso. 2002. Lemon yield and fruit quality affected by NPK fertilization. Sci. Hortic 96(1–4):151–162. doi: 10.1016/S0304-4238(02)00121-8.
- Shunfeng, G.E., Z. Zhu, L. Peng, Q. Chen, and Y. Jiang. 2018. Soil nutrient status and leaf nutrient diagnosis in the main apple producing regions in China. Horti. Plant J. 4(3):89–93. doi: 10.1016/j.hpj.2018.03.009.
- Sossa, E.L., C.E. Agbangba, G. Dagbenonbakin, R. Tohoun, P. Tovihoudji, and G. Amadji. 2019. Organo-mineral fertilization enhances the acceptability of smooth Cayenne pineapple fruit (Ananas comosus (L.) merrill) for European export and domestic consumption in Benin. Agriculture 9(3):65–79. doi: 10.3390/agriculture9030065.
- Tian, T., G. Qiao, B. Deng, Z. Wen, X. Wen, and X. Wen. 2019. The effects of rain shelter coverings on the vegetative growth and fruit characteristics of Chinese cherry (prunus pseudocerasus Lindl.). Sci. Horti. 254:228–235. doi: 10.1016/j.scienta.2019.04.030.
- Verma, P., J.S. Chandel, N.C. Sharma, and Y. Thakur. 2017. Effect of fertigation on growth, yield, fruit quality and fertilizer-use efficiency of peach. J. Hill Agri. 8(2):181–186. doi: 10.5958/2230-7338.2017.00033.7.
- Wan, L.J., Y. Tian, M. He, Y.Q. Zheng, L. Qiang, R.J. Xie, -Y.-Y. Ma, L. Deng, and S.-L. Yi. 2021. Effects of chemical fertilizer combined with organic fertilizer application on soil properties, citrus growth physiology, and yield. Agriculture. 11:1207–1222. doi: 10.3390/agriculture11121207.
- Woznicki, T.L., O.M. Heide, A. SNsteby, A.B. Wold, and S.F. Remberg. 2015. Yield and fruit quality of black currant (ribes nigrum L.) are favoured by precipitation and cool summer conditions. Acta. Agri. Scand 65(8):702–712. doi: 10.1080/09064710.2015.1052093.
- Wrona, D. 2011. The influence of nitrogen fertilization on growth, yield and fruit size of ‘jonagored’ apple trees. Ogrodnictwo 10(2):3–10.
- Zhang, W., N.S. Zhang, J.J. Zhao, Y.P. Guo, Z.Y. Zhao, and L.X. Mei. 2017. Potassium fertilization improves apple fruit (Malus domestica borkh. cv. fuji) development by regulating trehalose metabolism. J. Hortic. Sci. Biotech. 92(5):1–11. doi: 10.1080/142316.2017.1304165.