
ABSTRACT
Optical instruments were proposed to assess the nitrogen (N) concentration of the leaves of wild lowbush blueberries (Vaccinium angustifolium Ait.). The objectives were to assess the effects of NPK fertilizer rates on leaf N concentrations and optical measurement values and to examine the relationship between leaf N concentration and optical measurements. Four rates of ammonium sulfate (0 to 90 kg N ha−1), two rates of P (0 and 20 kg P2O5 ha−1) and four rates of K (0 to 90 kg K2O ha−1) were applied in the spring of the sprout year. Leaf sampling and optical measurements were conducted four times during the sprout year. Optical measurements were made with a SPAD-502 meter (Minolta) and a Dualex3 meter (Force-A). Leaf N concentrations decreased during the growing season while SPAD and Dualex3 values increased, although SPAD values dropped at the end of the season. N rates increased leaf N concentrations and SPAD values on all sampling dates while decreasing Dualex3 values. The best estimate of leaf N concentration was obtained with SPAD measurements and with the SPAD/Dualex3 ratio carried out at the end of July (r2 > 0.73). However, as optical measurements depend on the sites, reference plots are needed to standardize the values.
Introduction
Wild lowbush blueberry (Vaccinium angustifolium Ait.) fields total almost 35,000 ha in Quebec (Ministère de l’agriculture, des pêcheries et de l’alimentation du Québec (MAPAQ), Citation2016). They are characterized by podzolized sandy soils, which are very well drained, acidic and nutrient poor (Raymond et al., Citation1965). Wild blueberries require a two-year management cycle. The first year consists of the vegetative growth of the plant and the formation of flower buds, and the second year consists of the fruit set and fruit production. Fertilizer and pesticide applications are carried out during the sprout year. Nevertheless, crop fertilization must be well integrated into an effective weed control system because the wild blueberry plant is not very competitive in using the nutrients available in the soil compared with other plants present (Marty et al., Citation2019; Penney and McRae, Citation2000). Several studies have shown that complete fertilizers (nitrogen (N), phosphorus (P) and potassium (K)) increased crop productivity (Eaton and Nams, Citation2006; Eaton et al., Citation2009; Percival and Sanderson, Citation2004). However, some studies have indicated that the application of P did not improve crop productivity, despite low soil P content (Lafond and Ziadi, Citation2013; Sanderson and Eaton, Citation2008). The increases in fruit yields related to K applications are poorly documented because the studies were carried out with complete fertilizers. Recent works have indicated that K has little or no effect on fruit yields (Lafond, Citation2020; Maqbool et al., Citation2016). Thus, crop productivity increases are mainly associated with N fertilization (Lafond and Ziadi, Citation2011; Lafond, Citation2010, Citation2020; Maqbool et al., Citation2016). Limited P and K applications may be necessary to reach optimal P and K in the leaves (Lafond, Citation2009). Wild blueberry fertilization is adjusted according to leaf analysis results which are compared with reference values from the literature (Lafond, Citation2009, Citation2013). Fertilization adjustments are made for the next production cycle and sometimes during the production year (Lafond, Citation2010) if necessary to maintain crop productivity, profitability and sustainability.
Sampling of leaves in the field is time consuming and must be done at the appropriate stage of plant growth (Lafond, Citation2009). Analysis costs are high, and it also takes a long time to analyze results. Consequently, it would be relevant to develop quick methods for wild blueberry production, leaving the leaves intact, to assess the leaf N status – the main indicator of plant health. For example, estimates of chlorophyll concentration in leaves using the SPAD-502 optical meter (measurements of the transmittance by leaves at two wavelengths: 650 and 940 nm) (Soil Plant Analysis Development, Minolta Camera Co. Ltd, Tokyo, Japan) have been shown to be effective in determining the N status of a number of crops such as apples, grapes and corn (Neilsen et al., Citation1995; Porro et al., Citation2001; Zebarth et al., Citation2002; Ziadi et al., Citation2008). However, measurements may be less effective in the case of perennial crops given the complexity of the relationships between the sources and storage of N in the plant (Wood et al., Citation1993), leaf position and crop development stage at the time of sampling (Neilsen et al., Citation1995). Finally, leaf thickness is another factor to be considered in the interpretation of estimated N concentrations taken by chlorophyll measurements (Peng et al., Citation1992). Apple and grape trials have indicated that the relationship between chlorophyll measurement values and leaf N concentration is better at the beginning of the season than at the end, which suggests that corrections are possible during the season (Porro et al., Citation2001). On the other hand, some limitations have been observed with chlorophyll measurements taken with optical meters because they were influenced by environmental conditions and cultivars of the same crop (Porro et al., Citation2001; Tremblay et al., Citation2010).
Concentrations of polyphenolic compounds in the leaves, measured by the optical meter (Dualex3, Force-A, Orsay, France), which measure the ultraviolet (375 nm) absorption by the leaf epidermis due to flavonol presence), have also been identified as an indicator of the plant’s N status (Cartelat et al., Citation2005; Tremblay et al., Citation2009). Unlike chlorophyll, polyphenolic compound concentrations increase with a leaf N concentration decrease, indicating a N deficiency in the plant and a state of stress (Cartelat et al., Citation2005; Tremblay et al., Citation2007). The synthesis of these compounds is in response to biotic stress (diseases, insects) and abiotic stress (nutrient availability, UV radiation) (Schreiner, Citation2005). Measurements of these polyphenolic compounds are also dependent on year, cultivar and site, as are chlorophyll measurements (Tremblay et al., Citation2010). They are also affected by the phenological stage of the plant (Louis et al., Citation2009). Few studies have been conducted with perennial crops compared with annual crops, but the same factors should be considered in interpreting the results (Cerovic et al., Citation2015; Louis et al., Citation2009). For example, in grapes, leaf N sufficiency have been successfully evaluated by optical measurements by SPAD and Dualex3 at different stage but measurements should be refined for more phenological stages, sites, cultivars and year to year variability (Cerovic et al., Citation2015). In addition, the ratio of chlorophyll to polyphenolic compound measurements has been proposed as a very sensitive indicator of the N status of crops compared with individual measurements (Cartelat et al., Citation2005; Tremblay et al., Citation2010). This ratio has been better correlated with the N content of the crop compared with the measurement of chlorophyll concentration alone under experimental conditions (Cerovic et al., Citation2015; Padilla et al., Citation2014).
Wild blueberry growers have few tools to quickly assess the nutritional status of their crops. Indeed, no information on the use of Dualex3 with this crop is currently available. However, SPAD was used to estimate leaf tissue chlorophyll content in wild blueberry but without correlating leaf N concentrations during the growing season (Gumbrewicz and Calderwood, Citation2022). It is thus relevant to validate the performance of SPAD and Dualex3 to assess the crop’s N status and determine the best time to take a reading. The objectives of this project were therefore: (i) to assess the effect of N rates on leaf N concentrations during the growing season and on optical readings; and (ii) to establish relationships between the leaf N concentration and optical measurements at different sampling dates.
Materials and Methods
Fertilizer trials were conducted from 2009 to 2012 in four wild blueberry fields located in the Saguenay – Lac-St-Jean region in Quebec, Canada. In these four blueberry fields, six sites were established to evaluate the effect of NPK application on crop and soils. These sites are characterized by acidic soils with low nutrients availability. In the top soil layer (0–5 cm) for the different sites, pHwater varied from 4 to 5.4 and P and K content (Mehlich III extractant) from 14 to 63 and 47 to 177 mg kg−1, respectively. Soil organic matter content varied from 75 to 198 g kg−1 according to the sites. The average precipitations for the period from May to August are 344 mm with an average temperature of 14.1°C (Environment Canada, Citation2022). In 2009 and 2011, precipitations were close to the normal whereas in 2010, July and August were under the normal.
The management methods were described in a publication issued in 2020 (Lafond, Citation2020). The impacts of fertilization on pH, major elements in the soil and productivity parameters were also introduced and discussed. Briefly, the fertilizer trials included four rates of N (0, 30, 60 and 90 kg N ha−1 of ammonium sulfate), two rates of P (0 and 20 kg P2O5 ha−1 of triple super phosphate) and four rates of K (0, 30, 60 and 90 kg K2O ha1 of potassium sulfate). The number of treatments, including all combinations of factors was 32, arranged in four random complete blocks. The dimensions of the plots were 2.5 m by 5 m.
During the growing seasons, leaf samples were taken four times: in early July, end of July, mid-August and end of August. The first sampling date was set when the leaf size was more than 5 mm in diameter, which is the size necessary in order to use optical devices. Approximately 200 g of fresh material was collected per plot from 25 randomly selected stems. On the same leaf sampling dates, measurements were made with SPAD-502 and Dualex3. These measurements were carried out in the morning, from 9:00 am to 11:00 am, on dry leaves. For SPAD, 20 readings per plot were made on the adaxial face of leaves per plot. For Dualex3, 20 readings were carried out on both sides of the leaf (adaxial and the abaxial faces) and the sum of the measurements was calculated (Cartelat et al., Citation2005). All readings were taken on the leaves in the middle of the stem.
Leaf samples were dried at 55°C and ground to 1 mm thereafter. Nitrogen concentrations were determined after wet digestion (sulfuric acid-peroxide-selenious acid) (Isaac and Johnson, Citation1976) by a salicylate-type colorimetric method (Lachat Instruments, Quickchem Method 13-107-06-2-E).
Statistical analyses were conducted at all six sites using the SAS MIXED procedure (SAS Institute, Inc, Citation2012) for each of the four sampling dates. In the statistical model, N, P and K rates, sites and all possible interactions were considered as fixed factors and blocks as random factors. The normality of the data distribution was determined by the Shapiro – Wilks and kurtosis tests. The homogeneity of the variance was verified by residue analysis by means of graphical analysis. Linear and quadratic contrasts were used to compare treatment averages (Little and Hills, Citation1978). Regression equations were developed using the SAS REG procedure (SAS Institute, Inc, Citation2012) to describe the relationship between leaf N concentration and the optical measurement values for each sampling date.
Results and Discussion
Leaf N Concentration During the Season
During the growing season, leaf N concentrations decreased by an average of 45% for all sites (). In early July, mean N concentrations were at their highest level of 22.1 mg g1 gradually falling to 17.8, 15.9 and 15.2 mg g−1, respectively, for the second, third and fourth sampling dates. The evolution of the leaf N concentration was also monitored in Maine, USA, (Trevett et al., Citation1968), and they had measured the same decrease. The decrease in N concentrations over time would be attributable to the growth of the plant that produces additional biomass, which ultimately may have caused an N dilution effect in the various organs (Trevett et al., Citation1968). In addition, the effect of N fertilizer on leaf N concentrations was measured starting from the first sampling in early July (; ). Significant increases in leaf N concentrations were noted for all sites, but the increase was not necessarily similar from site to site as indicated by the significant interaction between the two factors. On average, leaf N concentrations rose from 20.3 mg g1 to 23.9 mg g−1, up 3.6 mg g−1. Depending on the site, increases in concentration ranged from 2.2 mg g−1 to 4.3 mg g−1.
Figure 1. Effect of nitrogen (N) fertilizer on leaf N concentration during the growing season (average for sites). The dotted lines indicate the minimum and maximum values of optimal concentrations (Lafond, Citation2009). L: linear effect of N rates for a given date: ***, significant at P < .0001.
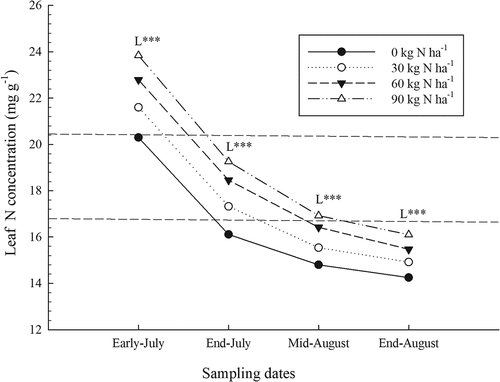
Table 1. Analysis of variance (probability value) for the effects of sites and rates of nitrogen (N), phosphorus (P) and potassium (K) on the leaf N concentrations, and on the values of SPAD and Dualex3 according to the different sampling times.
On the second, third and fourth sampling dates, significant increases in leaf N concentrations were also measured for all sites (). The interaction between sites and N rates was also significant for the second and fourth sampling dates indicating again that the increase in leaf N concentration was not the same for all sites. Increases in N concentrations were 3.15, 2.12 and 1.85 mg g−1 for the second, third and fourth sampling dates, respectively. Nevertheless, at the end of August, despite N fertilizer, N concentrations were below the minimum reference concentration of 16.4 mg g−1 (Lafond, Citation2009).
In addition, P rates had no significant effect on leaf N concentrations at all sites and for different sampling dates (). The interaction between N and K rates was only significant at the mid-August sampling date (). It indicated that the effect of K fertilizer on increases in leaf N concentration was greater when N inputs were low (data not shown). For example, leaf N concentration increased from 1.40 to 1.54% when 90 kg ha−1 of K was applied without N while with 90 kg N ha−1, K application had no effect (1.71 to 1.70%). This positive interaction between N and K on the leaf N concentration has also been previously determined (Percival and Sanderson, Citation2004).
A number of studies have reported the same positive effect of N fertilizer on leaf N concentration, but their results were limited to the second sampling date (Lafond and Ziadi, Citation2011; Lafond, Citation2010, Citation2020; Maqbool et al., Citation2016, Citation2017). The results of the present study have demonstrated that the positive effect of N fertilizer is measurable rapidly and continues throughout the wild blueberry growing season although, for synergism between N and K, it was observed only for the last two sampling dates. This evolution over time of the leaf N concentration, regardless of N fertilizer, has demonstrated the importance of sampling at the right time, because these measured values will not be comparable to the reference concentrations that were established at the tip dieback stage of the crop, i.e., at the end of July (Lafond, Citation2009).
Estimating Chlorophyll by SPAD Measurements
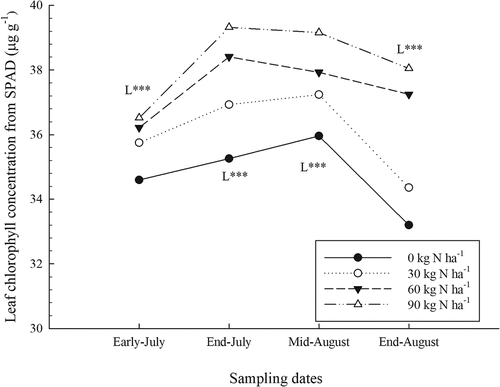
The SPAD measurement values rose rapidly during the growing season, but they dropped at the last sampling carried out at the end of August (). Changes in SPAD values during the season were also observed in a study conducted in Maine in the context of the foliar application of fertilizers and mulch (Gumbrewicz and Calderwood, Citation2022; Tasnim et al., Citation2022). Chlorophyll concentrations were also estimated by SPAD measurements with the equation calculated from Cerovic et al. (Citation2012) (). As the chlorophyll values are derived from the SPAD measurements, the results from statistical analyses (data not shown) carried out on chlorophyll data indicated the same effects as those obtained with SPAD values (). The findings in the present study are also consistent with increases in chlorophyll concentrations measured in wild blueberry leaves during the growing season in a study conducted in Nova Scotia (Glass et al., Citation2005). However, SPAD values can be affected by various factors such as water stress, disease and nutrient deficiencies. The wild blueberry plant is characterized by narrow and thick leaves, which makes it well adapted to both climatic and edaphic adverse conditions. As the leaves developed during the season, their thickness increased, which positively influenced SPAD values. Work on apple crops has indicated that the effects of chlorophyll concentration and leaf thickness on SPAD readings can lead to confusion (Neilsen et al., Citation1995). The drop in SPAD values at the end of August is related to leaf senescence, resulting in a drop in chlorophyll concentration (Percival et al., Citation2012).
Figure 2. Effect of nitrogen (N) fertilizer on SPAD values obtained during the growing season (average of sites). L: linear effect of N rates for a given date: ***, significant at P < .0001.
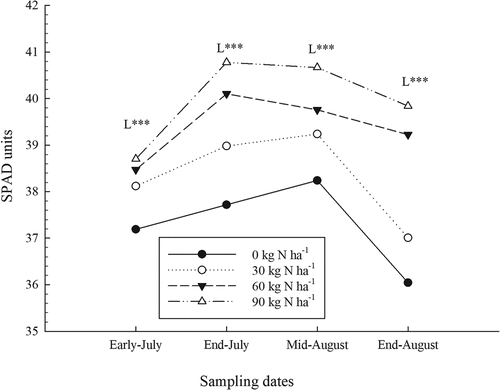
Figure 3. Effect of nitrogen (N) fertilizer on leaf chlorophyll concentration during the growing season (average for sites). L: linear effect of N rates for a given date: ***, significant at P < .0001.
Nitrogen fertilizer significantly increased SPAD measurement values and chlorophyll concentrations starting from early July and also for all other sampling dates (; ). However, the interaction between N rates and the sites was also significant for all sampling dates, indicating that the scope of the response to fertilization was not the same at all sites. These site variations were also measured in wheat trials (Tremblay et al., Citation2010), as well as in apple and grape trials (Porro et al., Citation2001). Mean SPAD values measured for the sites ranged from 36.1 to 41.4, while the increases related to N fertilization ranged from 0.70 to 6.84 depending on the sampling sites and dates (data not shown). Previous studies in wheat and corn crops have also shown that SPAD measurements are sensitive to increases in N fertilizer (Cartelat et al., Citation2005; Tremblay et al., Citation2007, Citation2010) as well as in apple crops (Neilsen et al., Citation1995). Phosphate and K fertilizers had no significant effect on SPAD measurements () even if leaf P and K concentrations increased significantly (Lafond, Citation2020).
Estimating Polyphenolic Compounds by Dualex3 Measurements
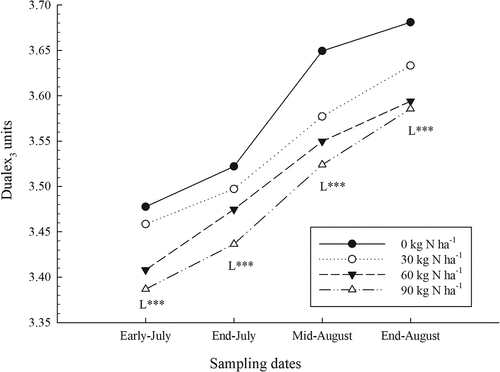
The Dualex3 measurement values rose rapidly during the season (), related to the lower leaf N concentration (Cartelat et al., Citation2005). Although the Dualex3 measurement values were influenced by the phenological stages of the plant (Louis et al., Citation2009), the estimates of the concentration of polyphenolic compounds in the leaves were correctly reflected in the N status of the plant. Measurements with Dualex3 were also significantly lower when N fertilizer was higher for all sampling dates (; ). However, the interaction between N rates and sites was also significant, indicating that the scope of the response to fertilizer was not the same at all sites. On average, Dualex3 measurement values ranged from 3.16 to 3.71 depending on the site and decreased with the increase in N fertilizer from 0.022 to 0.248 depending on the dates and sites (data not shown). Variations in Dualex3 values between sites were also observed in wheat trials (Tremblay et al., Citation2010). The effect of N fertilizer on the decrease in Dualex3 values was also measured in corn and broccoli crops (Tremblay et al., Citation2007, Citation2009). Phosphate and K fertilizers had no significant impact on Dualex3 measurements ().
Figure 4. Effect of nitrogen (N) fertilizer on Dualex3 values obtained during the growing season (average of sites). L: linear effect of N rates for a given date: ***, significant at P < .0001.
The ratios of SPAD/Dualex3 and chlorophyll/Dualex3 values increased significantly with N inputs for all sampling dates (P < .0001; data not shown). As the Dualex3 values increased in an almost linear manner over time, the SPAD/Dualex3 and chlorophyll/Dualex3 ratios reflected the same changes as the SPAD values and chlorophyll concentrations (), similarly to previous findings (Tremblay et al., Citation2010). The effect of N fertilizer on the ratio was the same as on the SPAD measurements, as previously suggested by Tremblay et al. (Citation2010). The interaction between N rates and sites was also significant (P < .01) indicating that not all increases related to N fertilizer were similar from site to site. Depending on the dates, average increases ranged from 0.148 to 2.580, while for sites the average values ranged from 9.78 to 13.15 (data not shown). Phosphate and K fertilizers had no significant effect on the SPAD/Dualex3 and chlorophyll/Dualex3 ratios.
Relationship Between Leaf N and Chlorophyll Concentrations, SPAD and Dualex3 Measurements
Regression lines were established between SPAD values, chlorophyll concentrations estimated by SPAD measurements, Dualex3 values, the SPAD/Dualex3 ratio, the chlorophyll/Dualex3 ratio and the leaf N concentration on the various sampling dates for all sites (). On all the sampling dates, the relationship between SPAD values, chlorophyll and leaf N concentrations was significant and positive, but the highest regression coefficient (r2 = 0.75) was measured on the second sampling date, i.e., at the end of July, corresponding to the tip dieback stage of the plant. The identification of the sampling date is all the more noteworthy because it corresponds to the same date as that recommended for leaf sampling in order to determine the optimal concentrations in the leaves (Lafond, Citation2009). Using the regression equation established at the end of July to estimate the minimum and maximum leaf N concentrations, the SPAD values should have been between 38 and 42 respectively. Estimates of leaf N concentrations have also been obtained for many types of crops (Cerovic et al., Citation2015; Padilla et al., Citation2014; van den Berg and Perkins, Citation2004; Zebarth et al., Citation2002). Regression coefficients determined between the Dualex3 values and leaf N concentrations were less than 0.50 for all sampling dates, indicating a weak relationship between the two parameters. This weaker relationship, compared with SPAD measurements, was also observed in grapes (Cerovic et al., Citation2015). In addition, higher regression coefficients were obtained (r2 = 0.73 and 0.71) between the SPAD/Dualex3 ratio in the second and fourth samplings. The estimation of leaf N concentration using the ratio was more efficient than the Dualex3 measurements alone but comparable to that of SPAD measurements, as also observed by Cerovic et al. (Citation2015) in a study carried out in the grapes. The SPAD/Dualex3 ratio should be between 10.70 and 12.50 in order to reach the sufficiency threshold according to the reference values proposed for Quebec (Lafond, Citation2009). The estimation of leaf N concentration using chlorophyll/Dualex3 ratio was comparable to SPAD/Dualex3 ratio. Therefore, the second sampling date at the end of July, corresponding to the tip dieback stage of blueberry plants, was identified as one of the appropriate times to make the measurements.
Table 2. Regression equations between leaf N concentrations and chlorophyll concentrations (Chl) and the SPAD, and Dualex3 values for the different sampling times (average for sites).
The sufficiency thresholds proposed for the SPAD values and the SPAD/Dualex ratio could be used as reference criteria to be calibrated and validated with remote sensing techniques in crop N management. Multispectral images taken from drones have been taken to develop different vegetation indices and significant correlations were obtained with SPAD and SPAD/Dualex ratio in corn, soybean and wheat (Fan et al., Citation2022; Guo et al., Citation2022; Yue et al., Citation2020). In addition, vegetation indices from multispectral images were developed in wild blueberry and were significantly correlated with canopy characteristics (Marty et al., Citation2022). Therefore, it would be possible to correlate these vegetation indices and optical measurements to assess leaf N status.
Conclusions
Diagnosing the N status of blueberry crops during the growing season is particularly useful for adjusting fertilizer if deficiencies are identified. In addition, diagnosis can be used to make N fertilizer recommendations for the next production cycle. All the optical measurements made it possible to correctly assess the fertility gradient provided by the various rates of N from the first sampling date in early July. The N status of leaves was relatively well assessed with SPAD meter and to a lesser degree with Dualex3 meter. The SPAD/Dualex3 value ratio also estimated the N status of the plant fairly accurately, but two measurements were required to do so. The best sampling date was determined to be at the tip dieback stage of the plant (end of July)—the recommended crop stage to carry out the sampling of leaves for the analysis and evaluation of the nutrient status of the crop. On that date, the SPAD measurements and SPAD/Dualex3 provided the best estimate of the N status of the plants. Minimum and maximum SPAD and SPAD/Dualex3 values have been identified and have made it possible to define an interval corresponding to leaf N concentrations to be reached. Nevertheless, as optical measurements are significantly site-dependent, these values can be considered approximate thresholds to be achieved when taking readings. To circumvent this limitation, reference plots fertilized beyond the needs of the crop (e.g., 70 kg N ha−1 in the case of blueberries) should be established and used for comparison of the relative value.
Acknowledgements
The author would like to thank Denis Bourgault for technical assistance in the field and Isabelle Morasse for laboratory analyses, as well as Bernard Gagnon and Maxime Paré for their suggestions on the preliminary version.
Disclosure statement
No potential conflict of interest was reported by the author(s).
Additional information
Funding
References
- Cartelat, A., Z.G. Cerovic, Y. Goulas, S. Meyer, C. Lelarge, J.L. Prioul, A. Barbottin, M.H. Jeuffroy, P. Gata, G. Agati, et al. 2005. Optically assessed contents of leaf polyphenolics and chlorophyll as indicators of nitrogen deficiency in wheat (Triticum aestivum L.). Field Crops Res. 91(1):35–49. doi: 10.1016/j.fcr.2004.05.002.
- Cerovic, Z.G., N. Ben Ghozlen, C. Milhade, M. Obert, S. Debuisson, and M. Le Moigne. 2015. Nondestructive diagnostic test for nitrogen nutrition of grapevine (Vitis vinifera L.) based on Dualex leaf-clip measurements in the field. J. Agric. Food Chem. 63(14):3669–3680. doi: 10.1021/acs.jafc.5b00304.
- Cerovic, Z.G., G. Masdoumierd, N. Ben Ghozlen, and G. Latouche. 2012. A new optical leaf-clip meter for simultaneous non-destructive assessment of leaf chlorophyll. Physiol. Plant. 146(3):251–260. doi: 10.1111/j.1399-3054.2012.01639.x.
- Cerovic, Z.G., G. Masdoumier, N.B. Ghozlen, and G. Latouche. 2012. A new optical leaf-clip meter for simultaneous non-destructive assessment of leaf chlorophyll and epidermal flavonoids. Physiol. Plant. 146(3):251–260. doi: 10.1111/j.1399-3054.2012.01639.x.
- Eaton, L.J., and V.O. Nams. 2006. Second cropping of wild blueberries —effects of management practices. Can. J. Plant Sci. 86(4):1189–1195. doi: 10.4141/P05-134.
- Eaton, L.J., K.R. Sanderson, and S.A.E. Fillmore. 2009. Comparison of consecutive and alternate fertilizer applications in wild blueberry production. Can. J. Plant Sci. 89(1):93–98. doi: 10.4141/CJPS08068.
- Environment Canada. 2022. Historical climate data [online]. Available from [accessed Aug. 2022]. https://climate.weather.gc.ca/
- Fan, K., F. Li, X. Chen, Z. Li, and D.J. Mulla. 2022. Nitrogen balance index prediction of winter wheat by canopy hyperspectral transformation and machine leaning. Remote Sens. 14(14):3504. doi: 10.3390/rs14143504.
- Glass, V.M., D.C. Percival, and J.T.A. Proctor. 2005. Tolerance of lowbush blueberries (Vaccinium angustifolium Ait.) to drought stress. II. Leaf gas exchange, stem water potential and dry matter partitioning. Can. J. Plant Sci. 85(4):919–927. doi: 10.4141/P03-028.
- Gumbrewicz, R., and L. Calderwood. 2022. Comparison of wood mulch particle sizes for wild blueberry management in a changing climate. Int. J. Fruit Sci. 22(1):551–567. doi: 10.1080/15538362.2022.2070577.
- Guo, Y., S. Chen, X. Li, M. Cunha, S. Jayavelu, D. Cammarano, and Y. Fu. 2022. Machine learning-based approaches for predicting SPAD values of maize using multi-spectral images. Remote Sens. 14(6):1337. doi: 10.3390/rs14061337.
- Isaac, R.A., and W.C. Johnson. 1976. Determination of total nitrogen in plant tissue, using a block digestor. J. Assoc. off. Anal. Chem. 59(1):98–100. doi: 10.1093/jaoac/59.1.98.
- Lafond, J. 2009. Optimum leaf nutrient concentrations for wild lowbush blueberry in Quebec. Can. J. Plant Sci. 89(2):341–347. doi: 10.4141/CJPS08142.
- Lafond, J. 2010. Fractionnement de la fertilisation azotée dans la production du bleuet nain sauvage et suivi de l’azote du sol. Can. J. Soil Sci. 90(1):189–199. doi: 10.4141/CJSS09012.
- Lafond, J. 2013. Boundary-line approach to determine minimum and maximum leaf micronutrient concentrations in wild lowbush blueberry in Quebec, Canada. Int. J. Fruit Sci. 13(3):345–355. doi: 10.1080/15538362.2013.748377.
- Lafond, J. 2020. Nitrogen, phosphate and potassium fertilization in the production of wild lowbush blueberry. Can. J. Soil Sci. 100:99–108.
- Lafond, J., and N. Ziadi. 2011. Fertilisation azotée et phosphatée dans la production du bleuet nain sauvage au Québec. Can. J. Plant Sci. 91(3):535–544. doi: 10.4141/cjps10133.
- Lafond, J., and N. Ziadi. 2013. Biodisponibilité de l’azote et du phosphore dans les sols de bleuetières du Québec. Can. J. Soil Sci. 93(1):33–44. doi: 10.4141/cjss2011-106.
- Little, T.M., and F.J. Hills. 1978. Agricultural experimentation Design and analysis. John Wiley and Sons, New York NY. p. 350.
- Louis, J., S. Meyer, F. Maunoury-Danger, C. Freneau, E. Meudec, and Z.G. Cerovic. 2009. Seasonal changes in optically assessed epidermal phenolic compounds and chlorophyll contents in leaves of sessile oak (Quercus petraea): Towards signatures of phenological stage. Funct. Plant Biol. 36(8):732–741. doi: 10.1071/FP09010.
- Maqbool, R., D. Percival, Q. Zaman, T. Astatkie, S. Adl, and D. Buszard. 2016. Improved growth and harvestable yield through optimization of fertilizer rates of soil-applied Nitrogen, Phosphorus, and Potassium in Wild Blueberry (Vaccinium angustifolium Ait.). Hort. Science 51(9):1092–1097. doi: 10.21273/HORTSCI08204-16.
- Maqbool, R., D. Percival, Q. Zaman, T. Astatkie, S. Adl, and D. Buszard. 2017. Leaf nutrients ranges and berry yield optimization in response to soil-applied nitrogen, phosphorus and potassium in wild blueberry (Vaccinium angustifolium Ait.). Eur. J. Hortic. Sci. 82(4):166–179. doi: 10.17660/eJHS.2017/82.4.2.
- Marty, C., S. Khare, S. Rossi, J. Lafond, M. Boivin, and M.C. Paré. 2022. Detection of management practices and cropping phases in wild lowbush blueberry fields using multispectral UAV data. Can. J. Rem. Sens. 48(3):469–480. doi: 10.1080/07038992.2022.2070144.
- Marty, C., J.A. Lévesque, R.L. Bradley, J. Lafond, M.C. Paré, and S. Saia. 2019. Contrasting impacts of two weed species on lowbush blueberry fertilizer nitrogen uptake in a commercial field. PLoS ONE 14(4):e0215253. doi: 10.1371/journal.pone.0215253.
- Ministère de l’agriculture, des pêcheries et de l’alimentation du Québec (MAPAQ). 2016. Monography of the blueberry industry. Quebec, Canada: Government of Quebec. p. 22. ISBN 978-2-550-75899-0
- Neilsen, D., E.J. Hogue, G.H. Neilsen, and P. Parchomchuk. 1995. Using SPAD-502 values to assess the nitrogen status of apple trees. Hort. Science 20(3):508–512. doi: 10.21273/HORTSCI.30.3.508.
- Padilla, F.M., M.T. Peña-Fleitas, M. Gallardo, and R.B. Thompson. 2014. Evaluation of optical sensor measurements of canopy reflectance and of leaf flavonols and chlorophyll contents to assess crop nitrogen status of muskmelon. Eur. J. Agron. 58:39–52. doi: 10.1016/j.eja.2014.04.006.
- Peng, S., F. Garcia, R. Laza, and K.G. Cassman. 1992. Leaf thickness affects the estimation of leaf N using a chlorophyll meter. Int. Rice Res. Newsl. 17:19–20.
- Penney, B.G., and K.B. McRae. 2000. Herbicidal weed control and crop-year NPK fertilization improves lowbush blueberry (Vaccinium angustifolium Ait.) production. Can. J. Plant Sci. 80(2):351–361. doi: 10.4141/P99-080.
- Percival, D., J. Kaur, L.J. Hainstock, and J.P. Privé. 2012. Seasonal changes in photochemistry, light use efficiency and net photosynthetic rates of wild blueberry (Vaccinium angustifolium Ait.). Can. J. Plant Sci. 92(6):1135–1143. doi: 10.4141/cjps2011-205.
- Percival, D., and K.R. Sanderson. 2004. Main and interactive effects of vegetative-year applications of nitrogen, phosphorus and potassium fertilizers on the wild blueberry. Small Fruit Rev. 3(1–2):105–121. doi: 10.1300/J301v03n01_11.
- Porro, D., C. Dorigatti, M. Stefanini, and A. Ceschini. 2001. Use of SPAD meter in diagnosis of nutritional status in apple and grapevine. Acta Hort. 564(564):243–252. doi: 10.17660/ActaHortic.2001.564.28.
- Raymond, R., A. Mailloux, and A. Dubé. 1965. Pedology of the Lac-Saint-Jean region. Ministère de l’agriculture et de la colonisation du Québec, Québec, QC. Bull. Tech. 11:157.
- Sanderson, K.R., and L.J. Eaton. 2008. Wild blueberry response to phosphorus applied to Prince Edward Island soils. Can. J. Plant Sci. 88(2):363–366. doi: 10.4141/CJPS07060.
- SAS Institute, Inc. 2012. SAS user’s guide: Statistics Version 9.3. SAS Institute Inc, Cary, NC.
- Schreiner, M. 2005. Vegetable crop management strategies to increase the quantity of phytochemicals. Eur. J. Nutr. 44(2):85–94. doi: 10.1007/s00394-004-0498-7.
- Tasnim, R.S., L. Calderwood, B. Tooley, L. Wang, and Y.J. Zhang. 2022. Are foliar fertilizers beneficial to growth and yield wild lowbush blueberries? Agronomy 12(2):470. doi: 10.3390/agronomy12020470.
- Tremblay, N., C. Bélec, S. Jenni, É. Fortier, and R. Mellgren. 2009. The Dualex- a new tool to determine nitrogen sufficiency in broccoli. Acta Hort. 824(824):121–131. doi: 10.17660/ActaHortic.2009.824.13.
- Tremblay, N., Z. Wang, and C. Bélec. 2007. Evaluation of the Dualex for the assessment of corn nitrogen status. J. Plant Nutr. 30(9):1355–1369. doi: 10.1080/01904160701555689.
- Tremblay, N., Z. Wang, and C. Bélec. 2010. Performance of Dualex in spring wheat for crop nitrogen status assessment, yield prediction and estimation of soil nitrate content. J. Plant Nutr. 33(1):57–70. doi: 10.1080/01904160903391081.
- Trevett, M.F., P.N. Carpenter, and R.E. Durgin. 1968. Seasonal trend and interrelation of mineral nutrients in lowbush blueberry leaves. Maine Agr. Exp. Stat. Bull 665:68.
- van den Berg, A.K., and T.D. Perkins. 2004. Evaluation of a portable chlorophyll meter to estimate chlorophyll and nitrogen contents in sugar maple (Acer saccharum Marsh.) leaves. For. Ecol. Manage. 200(1–3):113–117. doi: 10.1016/j.foreco.2004.06.005.
- Wood, C.W., D.W. Reeves, and D.G. Himelrick. 1993. Relationship between chlorophyll meter readings and leaf chlorophyll concentration, N status, and crop yield: A review. Proc. Agron. Soc. N. Z. 23:1–9.
- Yue, J., H. Feng, Q. Tian, and C. Zhou. 2020. A robust spectral angle index for remotely assessing soybean canopy chlorophyll content in different growing stages. Plant Meth. 16(1):104. doi: 10.1186/s13007-020-00643-z.
- Zebarth, B.J., M. Younie, J.W. Paul, and S. Bittman. 2002. Evaluation of leaf chlorophyll index for making fertilizer nitrogen recommendations for silage corn in a high fertility environment. Commun. Soil Sci. Plant Anal. 33(5–6):665–684. doi: 10.1081/CSS-120003058.
- Ziadi, N., M. Brassard, G. Bélanger, A. Claessens, N. Tremblay, A.N. Cambouris, M.C. Nolin, and L.É. Parent. 2008. Chlorophyll measurements and nitrogen status nutrition index for the evaluation of corn nitrogen status. Agron. J. 100(5):1264–1273. doi: 10.2134/agronj2008.0016.