
ABSTRACT
Botrytis fruit rot (BFR) causes significant losses in-field and postharvest in strawberries and is mainly managed by fungicides. Strategically applying fungicides only during wet and cool periods would reduce fungicide resistance development and grower costs. A survey of BFR levels in field-grown strawberries with and without fungicide applications was conducted in Santa Maria, California. Weather data were collected to calculate the BFR risk factor using Florida’s Strawberry Advisory System (StAS). There were no significant differences between fungicide and no-fungicide treatments for in-field and postharvest BFR incidence in 2021 and in-field BFR incidence in 2022, while the no-fungicide treatment showed higher postharvest BFR incidence in 2022. Average in-field BFR incidence for fungicide and no-fungicide treatments was 2.6% and 2.5% for 2021 and 3.0% and 3.7% for 2022. Average postharvest BFR incidence for fungicide and no-fungicide treatments was 1.8% and 2.0% for 2021 and 0.6% and 1.5% for 2022. BFR risk factor was significantly associated with BFR incidence in 2021, but not in 2022. StAS predicted a 50% and 44% fungicide application reduction in 2021 and 2022 compared to grower standard treatments. These results indicate the potential of reducing fungicide use without compromising BFR control in California strawberry production.
Introduction
California is the major strawberry producer for the United States with 1.08 million tons of production in 2020 valued at $2.0 billion and accounting for 89% of Strawberry production in the United States (CSC, Citation2022). Strawberry production in California is mostly done in conventional outdoor fields. Strawberry Botrytis fruit rot (BFR), caused by Botrytis cinerea, causes significant preharvest and postharvest yield losses. It is known as the most important and widespread strawberry disease in California and worldwide (Koike and Bolda, Citation2016).
Botrytis cinerea is a necrotrophic fungus that tends to kill the host and can grow on damaged, senescing, or dead tissue. It produces sclerotia as survival structures and produces mycelia and numerous conidia during conducive environmental conditions (Dewey and Grant-Downton, Citation2016). Conidia and mycelia are dispersed by wind, rain, splashing water or physical activity and infect plant tissues through wounds or natural openings. Primary infections of BFR occur when B. cinerea infects at the flowering stage (Mertely et al., Citation2002). It may colonize the flowers or stay quiescent and become active when the fruit develops (Bristow et al., Citation1986). Optimum temperature and free moisture are critical environmental factors for infection. A minimum of 4 hours of free moisture at 15–22°C was required to initiate flower infection. A combination of 20°C and 24 hours of wetness resulted in nearly 100% flower infection (Bulger et al., Citation1987).
Botrytis fruit rot is controlled by both cultural and chemical methods. Applying fungicides remains the most common and effective method of managing BFR. Captan, pyraclostrobin, cyprodinil, fludioxonil, and boscalid were the most frequently applied fungicides (Cosseboom et al., Citation2019). Applications during flowering showed the highest efficacy (Mertely et al., Citation2002). Since strawberry production has multiple flowering cycles through the season, protection against B. cinerea should be continuous during California’s long harvest season. In conventional strawberry fields in California, fungicides are typically applied every 14 to 21 days (Bolda et al., Citation2021; Cosseboom et al., Citation2019). Frequent fungicide applications exert strong selection pressure for the development of resistant B. cinerea populations. Fungicide resistance tends to increase as the season progresses and is common throughout all the growing districts in California (Cosseboom et al., Citation2019).
The Strawberry Advisory System (StAS), a BFR disease prediction system designed to assist fungicide application decisions, is widely used in Florida and is currently available in other states such as Maryland, North Carolina, and South Carolina (Borisova et al., Citation2014). StAS uses site-specific environmental data such as leaf wetness duration and temperature to predict B. cinerea infection in strawberry. Using StAS, fungicide applications were reduced to half the number or less than the grower standard without compromising yields (MacKenzie and Peres, Citation2012). The StAS system determines the following risk levels: low (<13-h leaf wetness duration), moderate (a combination of 17–25°C and >14-h leaf wetness duration), and high (a combination of 17–25°C and >18-h leaf wetness duration) (Peres, personal communication).
Botrytis fruit rot is an important disease to the California strawberry industry. Current chemical management of BFR is compromised by fungicide resistance. Limiting fungicide applications to wet and cool periods by using the StAS prediction model could potentially preserve fungicide efficacy by reducing fungicide resistance development and grower costs. To understand the frequency of BFR and the effectiveness of fungicide applications in California strawberry, this study aims to (1) compare levels of in-field and postharvest BFR between growers’ actual fungicide application program and no fungicide application in growers’ fields; (2) evaluate site-specific weather data using StAS to compare the actual and predicted number of fungicide applications.
Materials and Methods
Field Sites
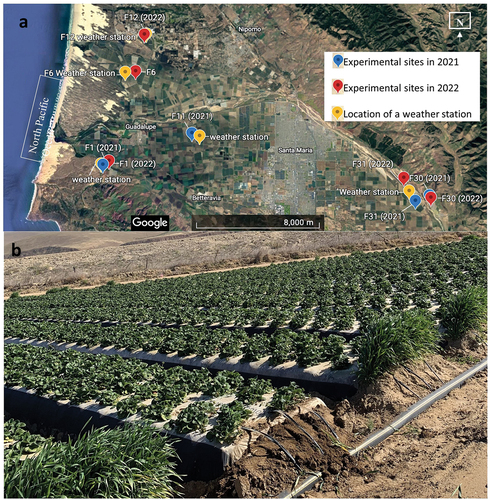
The study was conducted at four and five commercial strawberry fields in 2021 and 2022, respectively, in Santa Maria Valley, California. In 2021, Fields 1, 11, and 31 were farmed using conventional practices, and Field 30 was farmed organically. In 2022, Fields 1, 6, 12, and 31 were farmed using conventional practices, and Field 30 was farmed organically. The distance of the field to the Pacific Ocean was 6 km, 6 km, 11 km, 6 km, 29 km, and 32 km for Fields 1, 6, 11, 12, 31, and 30, respectively (). Standard grower practices for the Santa Maria Valley were used for field preparation (Strand, Citation2008). Raised beds (162 cm between bed centers and 35 cm high) were prepared and covered with plastic mulch which was black on the sides and clear on the top at Fields 1, 11, 12, and 31, covered with black plastic mulch at Field 6, and gray plastic mulch at Field 30. Bare-root transplants of “Monterey” were planted 41 cm between plants within a plant line into four offset rows spaced 30 cm per bed. Each bed had three lines of drip tape laying 3 cm beneath the soil surface with one drip tape laid between each pair of plant lines.
Figure 1. (a) Locations of experimental sites and weather stations in 2021 and 2022. (b) Typical strawberry production system in Santa Maria Valley showing 64-inch beds spacing, four lines of plants per bed, and three drip irrigation lines per bed.
Fungicide Treatments
At each site, seven consecutive beds approximately 82 to 94 meters in length (~809 m2) were not sprayed with any fungicide labeled for use against BFR. For the fungicide treatment, the grower standard fungicide spray program was applied to the rest of the field. At the organic farm (Field 30), there was only fungicide treatment in 2021, but there were both fungicide and no-fungicide treatments in 2022.
Weather Monitoring
Weather data including temperature, precipitation, humidity, and atmospheric pressure were obtained using an ATMOS 41 all-in-one weather station (METER group, Inc., Pullman, WA) and data were collected at 15-min intervals using a ZL6 data logger (METER group, Inc., Pullman, WA). Leaf wetness data were also collected from two PHYTO 31 sensors (METER group, Inc., Pullman, WA),which were placed 45.7 cm above the ground, oriented 30 degrees northward. The weather stations were within 1.5 km of each field.
The BFR risk factor was adapted from MacKenzie and Peres (Citation2012) based on a model by Bulgar, Ellis, and Bulger et al. (Citation1987) which uses leaf wetness duration and the mean temperature during the wetness interval to determine the risk of BFR occurring. If there was a conflict of wetness data between two sensors, the period was considered wet when the relative humidity exceeded 95% (MacKenzie and Peres, Citation2012).
Data Collection
Data collection started when the harvest twice per week for fresh fruit production began (i.e., 3-May for 2021 and 4-April for 2022). As is typical of California strawberry production, the fresh market season length varied based on a combination of fruit quality and market conditions that dictate a change to harvest for fruit processing market such as for juice (Strand, Citation2008). Two fruit evaluations were made at each sampling time: in-field and postharvest. For the in-field fruit evaluation, four representative fixed sample areas within the treated or non-treated beds were selected. A total of 200 fruits were collected weekly from the four sample areas (50 fruits per area). All mature fruit were harvested, the calyx removed, and each fruit was assessed for the presence or absence of BFR. For the postharvest assessment, two commercially harvested trays of fruit with eight clamshells per tray (3.6 kg fruit/tray) were collected weekly from the treated and non-treated beds one day after the in-field evaluation. After harvesting, fruits were stored at 4°C for 7 days in an environment monitored walk-in cooler after which the calyx was removed and the number of fruit with BFR lesions was counted.
Due to a perceived difference in plant size in 2022, the plant canopy diameter was measured on 17-May 2022 at five fields. Ten plants were measured from the four fixed sample areas in the treated and non-treated beds. Plant canopy diameter was measured using a measuring tape at two perpendicular dimensions and averaged for each plant.
Fungicide use records were obtained from the agricultural commissioner offices of San Luis Obispo and Santa Barbara Counties, California. The fungicide use interval was calculated using the method described by Cosseboom et al. (Citation2019). Briefly, the number of days between the first and last fungicide application was divided by the sum of all fungicide applications from the same field.
Statistics Analysis
Statistical analyses were performed using JMP statistical software (SAS Institute Inc., Cary, NC). The incidence of BFR was calculated as the percentage of diseased fruit in the total number of fruit harvested. BFR incidence was square root transformed, to normalize distribution across treatments. Linear regression models were used with selected factors (selected from field site, month, risk factor, rainfall, and fungicide or no-fungicide treatments) as explanatory variables, and with transformed BFR incidence as response variables. An interaction of two factors was kept in the model if it was statistically significant. Rainfall and risk factor represent the average amount of rainfall and average risk factor for the previous 7 days before the fruit sampling date. After fitting the regression model, significant differences between means of fungicide and no-fungicide treatment were evaluated using the Student’s t-test at p < .05.
Results
Effect of Fungicide, Microclimate, Risk Factor, and Field Site on BFR Incidence in 2021
There were no significant differences in the mean of both in-field and postharvest BFR incidence between fungicide and no-fungicide treatment in each field (; ).
Figure 2. (a) In-field botrytis fruit rot (BFR) incidence and (b) Postharvest BFR incidence for weekly evaluations at Field 1 in 2021. The vertical arrows (↓) indicate the date on which fungicides were applied (see ). The horizontal dashed line indicates 2% incidence. (c) Leaf wetness duration (vertical bars) in continuous hours per day, average temperature during leaf wetness period (dotted line) and BFR risk factor (solid line). The two horizontal dashed lines indicate risk factors of 0.5 and 0.7, respectively. Processing fruit production started on 27-sep.
Table 1. Number of fungicide applications, application interval, average leaf wetness duration (LWD), LDW average temperature, and average botrytis fruit rot (BFR) incidence at each field in 2021 and 2022 seasons.
Located closer to the ocean, Field 1 had longer periods of leaf wetness duration which resulted in higher risk factors and average in-field BFR incidence than Field 11 and 31. The in-field BFR incidence of the no-fungicide plot was an average of 4.8% in Field 1, an average of 1.4% in Field 11, and an average of 0.7% in Field 31 (). Average leaf wetness duration was 15 ± 0.4 h, 4 ± 0.5 h, 7 ± 0.5 h, and 8 ± 0.4 h at Fields 1, 11, 31, and 30, respectively. Due to technical issues, leaf wetness duration and risk factor data were only available from 1-May to 24-Jul at Field 11 (). The average temperature during the leaf wetness periods was 13 ± 0.1°C, 11 ± 0.6°C, 11 ± 0.5°C, and 12 ± 0.5°C at Field 1, 11, 31, and 30, respectively. Shorter leaf wetness duration and higher daily air temperature were shown at Field 30/31 (). Less than 10 mm precipitation was observed at all fields for the season (). Leaf wetness duration indicated mostly dew events and indicated a small amount of precipitation in September. Field 30, an organic farm, showed low BFR incidence both in-field and postharvest as a result of less leaf wetness duration and was reflected in the low risk factor and small plant canopy (). The weather conditions favored by the disease on 19-May to 26-May reflected the high postharvest BFR incidence in Field 11 ().
Figure 3. (a) In-field botrytis fruit rot (BFR) incidence and (b) Postharvest BFR incidence for weekly evaluations at field 11 in 2021. The vertical arrows (↓) indicate the date on which fungicides were applied (see ). The horizontal dashed line indicates 2% incidence. Processing fruit production started on 14-sep. (c) Leaf wetness duration (vertical bars) in continuous hours per day, average temperature during leaf wetness period (dashed line) and BFR risk factor (solid line). The two horizontal dashed lines indicate risk factors of 0.5 and 0.7, respectively. Due of technical issues, leaf wetness duration and risk factor data were not available from 25-jul to 14-sep.
Figure 4. (a) In-field botrytis fruit rot (BFR) incidence and (b) Postharvest BFR incidence for weekly evaluations at field 31 in 2021. The vertical arrows (↓) indicate the date on which fungicides were applied (see ). The horizontal dashed line indicates 2% incidence. Processing fruit production started on 29 Jun. (c) Leaf wetness duration (vertical bars) in continuous hours per day, average temperature during leaf wetness period (dashed line) and BFR risk factor (solid line). The two horizontal dashed lines indicate risk factors of 0.5 and 0.7, respectively.
Regression models were built consisting of average risk factor over 7 days before sampling, field site, sampling month, and fungicide or no-fungicide treatments as explanatory variables and transformed BFR incidence as response variables for the three conventional farms. Risk factor effect was significantly associated with both in-field BFR incidence (p = .03) and postharvest BFR incidence (p = .04). Field site was significantly associated with in-field BFR incidence (p < .0001), but not postharvest BFR incidence (p = .27) (). Mean comparisons for the three field sites were made by post-hoc Tukey test at p < .05 for in-field BFR incidence, Field 1 showed higher incidence than Field 11 and 31 ().
Table 4. Growers’ standard fungicide treatments for control of botrytis fruit rot with their respective trade name, active ingredient, and dates of application at each field in 2021 during fresh fruit production and number of days between first and last fungicide application.
Table 5. Growers’ standard fungicide treatments for control of botrytis fruit rot with their respective trade name, active ingredient, and dates of application at each field in 2022 during fresh fruit production and number of days between first and last fungicide application.
Table 2. P-value of selected explanatory variables to predict in-field or postharvest BFR incidence.
Table 3. Effect of field site on BFR incidence.
Number of Fungicide Applications and Application Interval in 2021
Fungicide applications were made throughout the season at four fields for fresh fruit production (). The growers generally followed biweekly, calendar-based applications with additional applications before and after significant rainfall events. A lower number of fungicide applications were predicted at Field 11, 31, and 30. An average of five fungicide applications were made during the sampling period among the four fields, while an average of 2.5 fungicide applications was suggested from StAS with moderate risk threshold. Field 1, which had a more conducive environment for BFR, showed no differences in actual and predicted fungicide applications. An average application interval of 16 days and 32 days were found for grower’s practices and StAS, respectively ().
Effect of Fungicide, Microclimate, Risk Factor, and Field Site on BFR Incidence in 2022
For the mean of in-field BFR incidence, there were no significant differences between the fungicide and no-fungicide treatments in each field (). However, the mean of postharvest BFR incidence of the no-fungicide treatment was significantly higher than that of the fungicide treatment in Fields 1 and 12 ().
Compared to 2021, 2022 had a longer leaf wetness duration in each field (; ). Average leaf wetness duration was 17 ± 0.8 h, 14 ± 0.7 h, 13 ± 0.3 h, and 11 ± 0.3 h at Fields 1, 6, 12, and 31/30, respectively. Due to technical issues of the weather monitoring equipment in Field 6, leaf wetness duration and risk factor data were only available from 13-Apr to 15-Jun (data not shown). The average temperature during leaf wetness period was 13 ± 0.2°C, 12 ± 0.2°C, 13 ± 0.2°C, and 15 ± 0.2°C at Fields 1, 6, 12, and 31/30, respectively. One rainfall event was observed on 22-Apr with 17.8 mm, 6.3 mm, 10.4 mm, and 6.1 mm precipitation at Fields 1, 6, 12, and 31/30, respectively (). The leaf wetness that occurred was mostly caused by dew. Shorter leaf wetness duration and higher daily air temperature were measured at Field 30/31 ().
Figure 5. (a) In-field botrytis fruit rot (BFR) incidence and (b) Postharvest BFR incidence for weekly evaluations at Field 1 in 2022. The vertical arrows (↓) indicate the date on which fungicides were applied (see ). The horizontal dashed line indicates 2% incidence. (c) Leaf wetness duration (vertical bars) in continuous hours per day, average temperature during leaf wetness period (dashed line) and BFR risk factor (solid line). The two horizontal dashed lines indicate risk factors of 0.5 and 0.7, respectively.
Figure 6. (a) In-field botrytis fruit rot (BFR) incidence and (b) Postharvest BFR incidence for weekly evaluations at field 12 in 2022. The horizontal dashed line indicates 2% incidence. (c) Leaf wetness duration (vertical bars) in continuous hours per day, average temperature during leaf wetness period (dashed line) and BFR risk factor (solid line). The two horizontal dashed lines indicate risk factors of 0.5 and 0.7, respectively.
Figure 7. (a) In-field botrytis fruit rot (BFR) incidence and (b) Postharvest BFR incidence for weekly evaluations at field 31 in 2022. The vertical arrows (↓) indicate the date on which fungicides were applied (see ). The horizontal dashed line indicates 2% incidence. Processing fruit production started on 22 Jun. (c) Leaf wetness duration (vertical bars) in continuous hours per day, average temperature during leaf wetness period (dashed line) and BFR risk factor (solid line). The two horizontal dashed lines indicate risk factors of 0.5 and 0.7, respectively.
Regression models were built consisting of average risk factor over 7 days before sampling, field site, sampling month, and fungicide or no-fungicide treatments as explanatory variables and transformed BFR incidence as response variables. Risk factor effect was not associated with either in-field BFR incidence (p = .62) or postharvest BFR incidence (p = .21). Field site was significantly associated with both in-field BFR incidence (p < .0001) and postharvest BFR incidence (p < .0001) (). Mean comparisons for the five field sites were made by post-hoc Tukey test at p < .05. For in-field BFR incidence, Field 12 showed higher incidence than Fields 31, 6, and 30. Field 31 showed higher incidence than Fields 6 and 30. For postharvest BFR incidence, Fields 12 and 31 showed higher incidence than Fields 6 and 30 ().
Field 31, located 30 km from the coastline, showed high BFR incidence both in-field and postharvest (), although this field had less leaf wetness duration and resulted in a lower risk factor compared to Fields 1, 6 and 12 (). Significantly larger canopy and plant height were observed in Field 31 compared to Field 1, 6, and 30 (data not shown).
Field 12, located 6 km from the coastline, showed high BFR incidence in-field compared to Fields 1 and 6 which were a similar distance from the coastline (). A similar or lower level of leaf wetness duration and risk factor were observed at Field 12 compared to Fields 1 and 6 (). Significantly bigger canopy size and greater plant height were observed in Field 12 than Fields 1 and 6 (data not shown).
Number of Fungicide Applications in 2022
Fungicide applications were made throughout the season at five fields for fresh fruit production (). A lower number of fungicide applications were predicted from the StAS for Field 6, 12, and 30. An average of five fungicide applications were made during the sampling period among the four fields, while an average of 2.8 fungicide applications was suggested from the StAS with a moderate risk threshold. An average application interval of 11 days and 21 days were found for grower’s practices and StAS, respectively ().
Discussion
Results from this study show that effective management of BFR on fall-planted strawberry in California could be potentially achieved with fewer fungicide applications, especially when the weather conditions are less favorable for disease development. Fungicide and no-fungicide treatments showed no differences in average in-field and postharvest BFR incidence at three conventional fields in 2021. This is likely due to overall low disease levels and not due to ineffective fungicides. This was consistent with a study by Swett et al. (Citation2020) in Maryland showing no differences of in-field BFR among a non-treated control, a calendar-based program, and a model-based program under non-conducive conditions in 2016. However, in 2022, the no-fungicide treatment in this study showed higher postharvest BFR incidence in Fields 1 and 12 where the environmental conditions were conducive for BFR (Field 1) and where the plant canopy was larger (Field 12). Plant canopy size affects microclimatic factors of humidity, airflow, and fruit contact. Legard et al. (Citation2000) showed that tighter plant spacing resulted in higher BFR incidence. Cultural management for BFR should include choosing a cultivar with a small canopy, avoiding vigorous vegetative growth by manipulating transplant chilling hours or adjusting nitrogen fertilization (Koike and Bolda, Citation2016; Petrasch et al., Citation2019).
Although the fungicide vs. no-fungicide treatments showed significant effect on postharvest BFR incidence in 2022, postharvest BFR incidence was low in all fields in both 2021 and 2022. The overall postharvest BFR levels were below 2% (the US No. 1 grade of strawberries by United States Department of Agriculture standard) in both fungicide and no-fungicide treatments. Low postharvest BFR incidence was also shown in a statewide survey of postharvest BFR incidence in 2020. In this 2020 survey, a median of 0.4% postharvest BFR incidence was measured in 195 samples from 12 farms (Wang et al., Citation2021).
The reduction of BFR levels from the coast to inland fields in 2021 can be attributed to shorter periods of leaf wetness and precipitation. B. cinerea is favored by extended periods of leaf wetness when the temperature is between 17 and 25°C. Bulger et al. (Citation1987) showed that infection of flowers increased significantly from 4 to 24 h of free moisture duration. Therefore, shorter periods of leaf wetness at fields located further inland would reduce infection by Botrytis cinerea. Precipitation is also critical for the dispersal and spore production of B. cinerea. Xiao et al. (Citation2001) showed that more BFR infections occurred in the field than under plastic tunnels as the plants were protected from splashing rain. In our study, rainfall was low in all fields in both years. However, there was one rainfall event coinciding with high postharvest BFR incidence in 2021.
The number of predicted applications from the StAS was lower in both years when comparing with actual fungicide applications. StAS has been evaluated in areas other than Florida, such as the mid-Atlantic region in the US (Hu et al., Citation2021). Maryland (Swett et al., Citation2020), Ohio (Cordova et al., Citation2018), and South Carolina (Cordova et al., Citation2017), and showed effective performance with 18–55% fewer fungicide applications compared to the grower standard. A similar potential fungicide application reduction of 50% in 2021 and 44% in 2022 was shown in this study. Fungicide application reduction may vary greatly depending on conditions present during a given year (Cordova et al., Citation2017; Hu et al., Citation2021; Swett et al., Citation2020). Cosseboom et al. (Citation2019) reported the average interval between BFR fungicide applications in California was 12 days. In this study in 2021, grower-applied fungicides had an average interval of 16 days, and the average StAS predicted application interval was 32 days. As multi-fungicide resistance is widespread in California (Cosseboom et al., Citation2019), use of a disease prediction system may also reduce selection of resistant B. cinerea populations by strategically applying fungicides when needed most. The BFR risk factor from StAS was significantly associated with actual BFR incidence in 2021 but not in 2022. This may be due to the effect of large plant canopy and vigorous vegetative growth in field 31 in 2022, since the StAS risk factor was measured near the field but not in the plant canopy. Field 31 is located inland with less conducive weather conditions for BFR, but it had the same level of in-field BFR incidence as Field 1 and the same level of postharvest BFR incidence as Fields 1 and 12. Using StAS for making fungicide use decisions in California fields should be investigated further.
In California’s central coast region (Santa Cruz and Monterey County), fungicides are often combined with insecticides with applications made every 12 to 16 days through March and 20 to 25 days from March to September with a total cost of around $3,833 per hectare (Bolda et al., Citation2021). This study with two years of data is an initial attempt to evaluate the fungicide application need in growers’ fields, and it shows that growers may be able to save fungicide application costs during periods when weather conditions are unfavorable for BFR development. During a dry year in 2021 with low BFR levels, this study showed that the number of fungicide applications could be reduced without affecting BFR levels. During a slightly wetter year in 2022, low levels of BFR were still found in both fungicide and no-fungicide treatments. These results indicate the potential to reduce fungicide use in California strawberries.
Acknowledgments
This work was supported by the California Strawberry Commission and Central West Produce. The authors acknowledge technical support from Miriam Mendez and Joseph Ramirez. Yu-Chen Wang was affiliated with California Polytechnic State University, San Luis Obispo at the time the study was conducted and is currently affiliated with University of California, Cooperative Extension.
Disclosure statement
No potential conflict of interest was reported by the author(s).
Additional information
Funding
References
- Bolda, M.P., J. Murdock, B. Goodrich, and D.A. Sumner. 2021. Sample costs to produce and harvest strawberries. University of California Division of Agriculture and Natural Resources, Davis, CA. <https://coststudyfiles.ucdavis.edu/uploads/pub/2022/01/04/strawberrycentralcoastfinaldraft-121321.pdf>.
- Borisova, T., Z. Guan, E. Vorotnikova, N. Peres, and J. Vansickle. 2014. Florida strawberry producers’ experiences with anthracnose and botrytis fruit rot, and producers’ use of the strawberry advisory system. FE957UF/IFAS Extension. <https://edis.ifas.ufl.edu/pdf/FE/FE95700.pdf>
- Bristow, P.R., R.J. Mcnicol, and B. Williamson. 1986. Infection of strawberry flowers by Botrytis cinerea and its relevance to grey mould development. Ann. Appl. Biol. 109(3):545–554. doi: 10.1111/j.1744-7348.1986.tb03211.x.
- Bulger, M.A., M.A. Ellis, and L.V. Madden. 1987. Influence of temperature and wetness duration on infection of strawberry flowers by Botrytis cinerea and disease incidence of fruit originating from infected flowers. Phytopathology 77(8):1225–1230. doi: 10.1094/Phyto-77-1225.
- Cordova, L.G., M.A. Ellis, L.L. Wilson, and N.A. Peres. 2018. Evaluation of the Florida strawberry advisory system for control of botrytis and anthracnose fruit rots in ohio. Plant Health. Prog. 19(2):182–187. doi: 10.1094/PHP-10-17-0062-RS.
- Cordova, L.G., L.V. Madden, A. Amiri, G. Schnabel, and N.A. Peres. 2017. Meta-analysis of a web-based disease forecast system for control of anthracnose and botrytis fruit rots of strawberry in southeastern United States. Plant Dis. 101(11):1910–1917. doi: 10.1094/PDIS-04-17-0477-RE.
- Cosseboom, S.D., K.L. Ivors, G. Schnabel, P.K. Bryson, and G.J. Holmes. 2019. Within-season shift in fungicide resistance profiles of Botrytis cinerea in California strawberry fields. Plant Dis. 103(1):59–64. doi: 10.1094/PDIS-03-18-0406-RE.
- CSC. 2022. National berry report. California Strawberry Commission, Watsonville, CA. <https://calstrawberry1.sharepoint.com/sites/IndustryPortal-Landing/SitePages/MD-National-Berry-Report.aspx>.
- Dewey, F.M., and R. Grant-Downton. 2016. Botrytis-biology, detection and quantification, p. 17–34. In: S. Fillinger and Y. Elad (eds.). Botrytis-the fungus, the pathogen and its management in agricultural systems. Springer, Dordrecht, The Netherlands.
- Hu, M., S.D. Cosseboom, A. Schoeneberg, C.S. Johnson, N.A. Peres, and J. Lea-Cox. 2021. Validation of the strawberry advisory system in the mid-Atlantic region. Plant Dis. 105(9):2670–2679. doi: 10.1094/PDIS-10-20-2162-RE.
- Koike, S.T., and M.P. Bolda. 2016. Botrytis fruit rot of strawberry. California strawberry commission production guildeline. <https://ucanr.edu/blogs/strawberries_caneberries/blogfiles/37846.pdf>.
- Legard, D.E., C.L. Xiao, J.C. Mertely, and C.K. Chandler. 2000. Effects of plant spacing and cultivar on incidence of botrytis fruit rot in annual strawberry. Plant Dis. 84(5):531–538. doi: 10.1094/PDIS.2000.84.5.531.
- MacKenzie, S.J., and N.A. Peres. 2012. Use of leaf wetness and temperature to time fungicide applications to control anthracnose fruit rot of strawberry in florida. Plant Dis. 96(4):522–528. doi: 10.1094/PDIS-03-11-0181.
- Mertely, J.C., S.J. MacKenzie, and D.E. Legard. 2002. Timing of fungicide applications for Botrytis cinerea based on development stage of strawberry flowers and fruit. Plant Dis. 86(9):1019–1024. doi: 10.1094/PDIS.2002.86.9.1019.
- Petrasch, S., S.J. Knapp, J.A.L. van Kan, and B. Blanco-Ulate. 2019. Grey mould of strawberry, a devastating disease caused by the ubiquitous necrotrophic fungal pathogen Botrytis cinerea. Mol. Plant Pathol. 20(6):877–892. doi: 10.1111/mpp.12794.
- Strand, L.L. 2008. Integrated pest management for strawberries. 2nd ed. Publ No. 3351. University of California Press, Oakland, CA.
- Swett, C.L., B.B. Butler, N.A. Peres, E.E. Koivunen, E.M. Hellman, and J.R. Beaulieu. 2020. Using model-based fungicide programing to effectively control botrytis and anthracnose fruit rots in mid-Atlantic strawberry fields and co-manage strawberry sap beetle (Stelidota geminate). Crop Prot. 134. doi: 10.1016/j.cropro.2020.105175.
- Wang, Y.C., S.S. Hewavitharana, and G.J. Holmes. 2021. Botrytis fruit rot incidence in commercially harvested strawberries throughout California. (Abstr.) Phytopath. 111:S2.103.
- Xiao, C.L., C.K. Chandler, J.F. Price, J.R. Duval, J.C. Mertely, and D.E. Legard. 2001. Comparison of epidemics of botrytis fruit rot and powdery mildew of strawberry in large plastic tunnel and field production systems. Plant Dis. 85(8):901–909. doi: 10.1094/PDIS.2001.85.8.901.