
 ?Mathematical formulae have been encoded as MathML and are displayed in this HTML version using MathJax in order to improve their display. Uncheck the box to turn MathJax off. This feature requires Javascript. Click on a formula to zoom.
ABSTRACT
Exogenous gibberellic acid was applied to regulate fruit growth of grapes to acquire high quality seedless berries. The vascular bundles provide the pathway of water and nutrient transport into the fruit and play an important role in berry growth and sugar accumulation. Therefore, changes in berry size and quality are closely related to the structure and function of the vascular tissue. In this study, 10-year-old “Shine Muscat” grape vines were treated with GA3 in grapevine production. Based on previous research and experimental environmental conditions, four treatments were applied: elongating cluster(5 mg L−1 GA3 on Apr. 28)+ seedless(25 mg L−1 GA3 on May. 24)+ expanding(50 mg L−1 GA3 on Jun. 7) (T1), seedless(25 mg L−1 GA3 on May. 24)+ expanding(50 mg L−1 GA3 on Jun. 7) (T2), expanding(50 mg L−1 GA3 on Jun. 7) (T3) and water (CK). Compared to CK, all fruits treated with GA3 had greater berry size. In addition, GA3 treated grapes had greater vascular bundle areas, including the areas of both phloem and xylem, as well as a greater number of vessels compared to control fruit. During the first rapid growth stage, water transport into the grape was rapid and did not differ among treatments. During veraison, the water transport rate among the four treatments differed, and the rank of speed was T2>T3>CK>T1. Therefore, we found that GA3 treatment can significantly promote the differentiation of vascular tissues and improve water transport capacity and phloem sugar unloading; T2 promoted the development of vascular bundles, enhanced water transport speed and phloem sugar unloading of fruit after veraison, and increased berry size.
Introduction
Grape is one of the most widely grown fruit species in the world and is therefore one of the most economically important crops. Grapes are used fresh, dried, and processed in food and beverage industries. Large berry size for table grapes is desired by consumers, and therefore, fruit size is increased with the use of gibberellic acid (GA3) applications during production (Harrell and Williams, Citation1987).
Endogenous gibberellins mediate many physiological processes in plants regulating plant growth and development including seed germination, internode elongation, flower and berry development, leaf extension, and xylem cell differentiation (Davière et al., Citation2008; Sun, Citation2011; Sun and Gubler, Citation2004; Vera-Sirera et al., Citation2016). As early as the middle of the last century, gibberellins were found to induce the expansion of seedless grapes. With the progress of science, technology, and the modernization of agriculture, gibberellins started to be widely used to elongate the inflorescence prior to anthesis (Gao et al., Citation2020). Application to grapes near or at bloom causes pollen and ovule abortion resulting in seedlessness (Coombe, Citation1960). Gibberellins can induce endogenous auxin production, promote nutrient absorption, strengthen fruit competition with shoots, and promote berry expansion (Teszlák et al., Citation2005; Ben-Tal, Citation1990; Li et al., Citation2003; Pérez and Gómez, Citation2000).
Fruit expansion requires the consumption of large amounts of nutrients and increased energy metabolism. Vascular bundles in the grape are channels for the transport of water, hormones, and various nutrients(Xie et al., Citation2012). Understanding the structural and functional changes in the fruit vascular system during fruit development can provide new insights for advancing our understanding of the hormonal regulation of grape growth. It can also provide additional insights into the use of hormones in grape production.
The vascular system of plants consists of two main tissues, the xylem and phloem, which are important channels for the transport of water, minerals, and photosynthetic products (Dettmer et al., Citation2009). Studies have shown that the expansion of the grape berry is related to the uptake of water, which occurs through the vascular bundles that change as the fruit develops (Coombe and Bishop, Citation1980; Delrot et al., Citation2001; Tyerman et al., Citation2004). Bian et al. (Citation2015) proposed that the vascular bundle area is coordinated with berry cell growth by comparing their development. Vascular tissue development is a complex process that is affected by many factors. Recently, the relationship between plant hormones and vascular tissue development has received considerable attention. However, the effects of GA3 on the development and function of grape vascular tissue were rarely reported. Wang et al. (Citation2015) found that GA3 treatment promoted xylem development in carrot roots. Guzmán et al. (Citation2021) found that spraying “Superior Seedless” grapes with IBA and GA3 at full bloom increased berry size and, therefore, bunch weight. The above studies provide the theoretical basis and methodology for this study to investigate the water transport function of grape vascular bundles. Recent research on GA3 treatments focused primarily on the effect and mechanism of berry seedlessness and expansion. However, few studies have been conducted on the structure and function of vascular bundle, the conduit of water and nutrients in the grape. Whether GA3 affects the transport function of berries by affecting the vascular bundle structure has not yet been reported.
In this paper, we investigate the changes in the structure and function of grape vascular bundles by observing the morphological structure of vascular tissues and the transport of extracellular dyes in vascular bundles among different GA3 treatments.
Materials and Methods
Plant Materials
The experiment was conducted in 2021 at the Shandong Fruit Research Institute at the base of Jinniu Mountain (36.127 N, 117.004 E). The whole vineyard was sheltered from rain, and ten-year-old “Shine Muscat” grapevines were trained on a V-shaped trellis on their own roots (row spacing 1 m, north-south direction).
Thirty healthy grapevines were selected. Randomly selected branches with moderate vigor and a consistent number of leaves were chosen; one inflorescence on each branch was left and selected as the test object. Each inflorescence was trimmed one week before flowering to comprise only 5 cm of the apex. Trimmed inflorescences were assigned to one of three treatments or one control.
Three GA3 treatment schemes were applied to the trimmed inflorescences (). In treatment 1 (T1), GA3 was applied approximately 20 d before bloom when the rachis was elongating, 1 d after full bloom, and 14 d after bloom. In treatment 2 (T2), GA3 was applied 1 d after full bloom and 14 d after bloom. In treatment 3 (T3), GA3 was applied 14 d after bloom. The control check (CK) was dipped in water at the same time as T1.
Table 1. Experimental design of different gibberellin treatments.
During the treatment at the time of elongating rachis, inflorescences of the same size were randomly selected, and the inflorescences were quickly dipped in 5 mg L−1 GA3 aqueous solution. After bloom the inflorescences were dipped in 25 mg L−1 GA3 aqueous solution and at fruit expansion the inflorescences were dipped in 50 mg L−1 GA3 aqueous solution. For each of the four treatments, 30 inflorescences were treated.
Berry Growth Measurements
Berries were sampled at the second rapid growth stage (84 days after flowering; DAF) and taken back to the laboratory in an ice box immediately after harvest for index determination. For each treatment, 30 berries with uniform size were randomly selected, and the vertical and horizontal diameters of each berry was measured with vernier calipers (accurate to 0.01 mm). Berry shape index was calculated according to EquationEquation (1)(1)
(1) .
Thirty berries were randomly selected from each treatment, and the berry volume was measured by the difference in water level when the berry was immersed in water. The mass of single berries was measured using an electronic balance (accurate to 0.01 g), and the content of soluble solids and total acid of berries were measured by a hand-held sugar acidity meter (ATAGO PAL-1, Atago, Tokyo). Ten randomly selected berries from each treatment were used to measure firmness with a durometer (ATAGO GY-4, Atago, Tokyo) with a 3.5 mm probe.
Paraffin Section
Grape berries were sampled at the first rapid growth stage (34 DAF), veraison (54 DAF) and the second rapid growth stage(84 DAF) by selecting representative berries at the middle and outer edges of the bunch. Sampled berries were cut into 1 cm × 1 cm × 1 cm pieces with a blade from the middle of the berry and immediately fixed with FAA. Fixed materials were selected according to Hardie et al. (Citation1996) to make paraffin sections. Slice thickness was 8–10 μm, stained with safranine and fast green, sealed with neutral gum, and photographed under an optical microscope.
Distribution and Transportation of Berry Vascular Bundles
Dye tracing was introduced in vitro according to the methods of Bondada et al. (Citation2005) and Rogiers et al. (Citation2001) with modification. The dye preparation method used 5 ml of 10% Na2S2O4 solution mixed with 100 ml of 0.5% basic fuchsin solution. “Shine Muscat” berries were sampled at the first rapid growth stage, veraison, and the second rapid growth stage. At each sampling time, 15 representative berries were selected from the middle and outer edges of the bunch for each treatment and immediately returned to the laboratory. The base of the peduncle was submerged under water and then inserted into the prepared solution. After 8 hours, the berries were taken out of the solution, peeled and the stained part of the berry vascular bundle was observed. Photos were taken.
During the dyeing, two of the berries per treatment were taken every hour for peeling and observations, and the staining length of the main veins of the peripheral vascular bundle and the central vascular bundle was measured with linen tape, and the staining rate was calculated according to the staining time. After staining, the remaining berries were peeled and observed, and the number of staining strips of peripheral vascular bundles and the main veins of peripheral vascular bundles of each berry was recorded and photos were taken.
Xylem Hydraulic Conductivity
To estimate the frequency distribution of receptacle xylem vessels size classes and their potential contribution to the area-specific hydraulic conductivity (K, kg m−1 MPa−1 s−1), xylem region(s) were selected in the cross-sectional images of the central and peripheral vascular bundles using ImageJ. Their corresponding area (Ac-xylem, µ m2), vessel number (n), and density (VD, n mm−2) were then calculated. Using hand-drawn ellipses in ImageJ (Schneider et al., Citation2012), semi-major (a1, µm) (half of Feret diameter) and semi-minor (b1, µm) (half of minimum-Feret) axes were determined for the single xylem vessel in the corresponding xylem area. Idealized vessel diameter (d1, µm), as the equivalent circle diameter for the lumen, was obtained using EquationEquation (2)(2)
(2) (White and Majdalani, Citation2006).
Assuming the selected xylem region(s) used for the image segmentation was representative of each cross-sectional xylem vessel, the potential area-specific hydraulic conductivity (K, kg m−1 MPa−1 s−1) of total vessels and each vessel size class (i.e., 2 µm class interval in d1) were estimated according to the Hagen-Poiseuille equation, EquationEquation (3)(3)
(3) (Tyree and Ewers, Citation1991), and then the percentage of K for each vessel size class was determined,
where η is the viscosity of water (1.002 × 10⁻⁹ MPa s) and ρ is the density of water (998.2 kg m−3), both at 20°C.
Sugar Unloadin
The “New Berry Cup” was prepared according to the method of (Wang et al., Citation2006). At veraison (August 19th) and at the second rapid growth stage (September 28th) of “Shine Muscat” grapes, a randomly selected berry was sampled from a randomly selected cluster with consistent berry development for each treatment. A 1 cm cut was gently made at the equator of the berry with a dissecting knife, with the depth of the cut not cutting the flesh tissue of the berry. The peel was gently removed to the base of the berry using ophthalmic forceps, and then the peel was dissected using scissors and rinsed with a prepared Mes buffer consisting of 5 mmol L−1 Mes (2- (N-morpholine) ethane sulfonic acid), 2 mol L−1 CaCl2, 100 mmol/L mannitol (D-mannitol), and 0.2% (w/v) polyvinyl pyrrolidone (PVPP). The peeled grape was carefully placed into a 20 mm infusion tube, which was pre-filled with Mes buffer. The opening of the tube was sealed with parafilm and the berry cup was attached to the cluster. Finally, aluminum foil was wrapped on the outer layer of the “Berry Cup” to prevent excessive changes in heat inside the cup from affecting the test results and extending the service life of the “Berry Cup.” The experiment started at 9:30 and collected buffer solution for 0.5 hours, followed by another collection every 2 hours until 18:00, during which time the buffer solution was discharged from the cup and then replaced with fresh buffer using a syringe. The collected buffer solution was then immediately frozen in liquid nitrogen at −80°C for later determination of glucose, fructose, and sucrose.
Statistical Analysis
SPSS 26.0 software was used for the statistical analysis of the test data. A single-factor ANOVA was conducted for each factor, and Duncan’s new multiple-range tests were used for multiple comparisons, with a significance level of p < .05.
Results
Berry Ripening
Effect of GA3 Treatments on Fruit External Quality
The shape of “Shine Muscat” grapes is naturally long and elliptical (berry shape index > 1). The GA3 treatments increased the longitudinal diameter of the berry, but there was no significant difference in the transverse diameter. The longitudinal diameter of fruit subjected to T2 (31.04 ± 0.92 mm) was significantly higher than the other GA3 treatments (mean of the others = 28.95 ± 1.17 mm), which was 12.2% higher than the control (CK) (). In addition, the berry shape index was the highest under T2 (1.3 ± 0.04) ().
Figure 1. Berry longitudinal diameter (a) and shape index (b) of ‘Shine Muscat’ fruit subjected to different GA3 treatments. Different lower-case letters indicate significant differences among treatments (n= 3, Duncan’s test, p<.05).
The GA3 treatments increased the berry size of the grape. By comparing the berry weight and volume between the different treatments, it was found that T2 treated fruit had significantly higher berry weight (12.05 ± 0.98 g) than the other GA3 treatments (mean of the others = 9.85 ± 0.24 g), which was 142.8% of the control (). At the same time, the berry volume of T2 grapes (10.63 ± 0.25 cm3) was significantly higher than that of T1 grapes and control (CK) fruit ().
Figure 2. Berry weight (a) and volume (b) of ‘Shine Muscat’ fruit subjected to different GA3 treatments. Different lower-case letters indicate significant differences among treatments (n= 3, Duncan’s test, p<.05).
Effects of GA3 Treatments on Fruit Internal Quality
During the second rapid growth stage, the total soluble solids (TSS) content of T2 fruit was the highest (18.97 ± 0.86%), and no significant difference in TSS content was found between T3 and control fruit (). In addition, there was little difference in the sugar/acid ratio () and firmness () between GA3 and control treatments.
Figure 3. TSS (a) and the sugar/acid (b) of ‘Shine Muscat’ fruit subjected to GA3 treatments. Different lower-case letters indicate significant differences among treatments (n = 3, Duncan’s test, p <.05).
Figure 4. Firmness of ‘Shine Muscat’ fruit subjected to GA3 treatments. Different lower-case letters indicate significant differences among treatments (n= 3, Duncan’s test, p <.05).
Anatomical Structure
Density of Flesh Cell
GA3 treatments significantly reduced the vessel density of flesh cells (). The vessel density of flesh cells in the control fruit was highest (84 ± 6 vessels mm−2), and the vessel density of flesh cells in the T2 fruit was lowest (62 ± 4 vessels mm−2). The vessel density of flesh cells T1 and T3 fruit were similar (71 ± 5 vessels mm−2). Therefore, the T2 treatment was most effective in increasing flesh cell expansion.
Figure 5. Berry cell density in grapes subjected to GA3 treatments. Different lower-case letters indicate significant differences among treatments (n= 3, Duncan’s test, p <.05).
Anatomical Structure of the Vascular Bundle
Paraffin sectioning was performed on the equatorial part of “Shine Muscat” berries during the first rapid growth stage, at veraison, and during the second rapid growth stage to observe the cross-sectional microstructure of the central () and peripheral () vascular bundles. The vascular bundle structure of “Shine Muscat” grapes was similar under different treatments. The xylem vessels and parenchyma cells in the vascular bundles were regularly distributed and arranged radially. The shape of the peripheral vascular bundle was nearly oval, and the parenchyma cells were less damaged by lateral expansion so the boundary between vascular tissues and flesh tissues was obvious, and the structure was nearly complete (). The shape of the central vascular bundle was oval. The expansion of the parenchyma cells distorted the central vascular bundle, resulting in damage or even breaking of the vascular bundle structure (). The area of the single peripheral vascular bundles was about 1/4–1/3 of that of the central vascular bundles. The areas of the vascular bundle, phloem, and xylem were significantly greater in GA3 treated fruit compared to control fruit (). The area of the central vascular bundle (Av), phloem (Ap), and xylem (Ax) were largest in the T2 treated fruit, which were significantly larger than those of the T3 fruit and the control. At the first rapid growth stage, the T2 treatment resulted in a small difference in the area of the vascular bundle compared to that of the T1 treated fruit, which was about twice that of the control. By veraison, the difference in the area of the vascular bundle, phloem, and xylem between each treatment decreased. At the second rapid growth stage, the area of the vascular bundle, phloem, and xylem in the equatorial of berries under T2-treated was greatest (Av: 5 5273 ± 3571 μm2, Ap: 2 6149 ± 97 μm2, Ax: 1 8602 ± 208 μm2). The vascular bundle area of berries in three stages of growth was analyzed, and it was found that the vascular bundle area was largest at the second rapid growth stage, and the vascular bundle area in the first rapid growth stage was similar to that at veraison.
Figure 6. Cross-sectional microstructure of central vascular bundles (e-h) of ‘Shine Muscat’ grapes under CK (a-c), T1 (d-f), T2 (g-i) and T3 (j-l) treatments at the first rapid growth stage、veraison and the second rapid growth stage. X: xylem; P: phloem; V: vessel; Scale bar =100 μm.
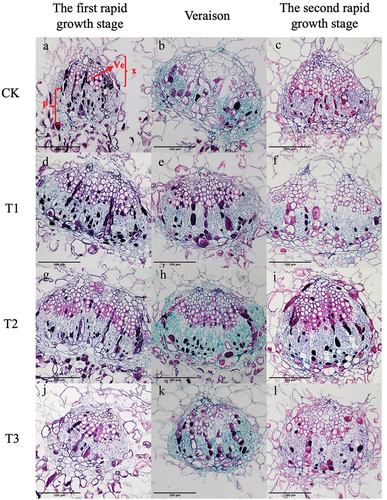
Figure 7. Areas of the central vascular bundle (Cvb) of ‘Shine Muscat’ grapes under different treatments during three stages of growth.Av: vascular bundles area, Ap: phloem area, Ax: xylem area. Different lower-case letters indicate significant differences among treatments (n= 3, Duncan’s test, p <.05).
Figure 8. Cross-sectional microstructure of peripheral vascular bundles (e-h) of ‘Shine Muscat’ grapes under CK (a-c), T1 (d-f), T2 (g-i) and T3 (j-l) treatments at the first rapid growth stage (a、d、g、j)、veraison(b、e、h、k) and the second rapid growth stage (c、f、i、l). (X: xylem; P: phloem; Ve: vessel) Scale bar =100 μm.
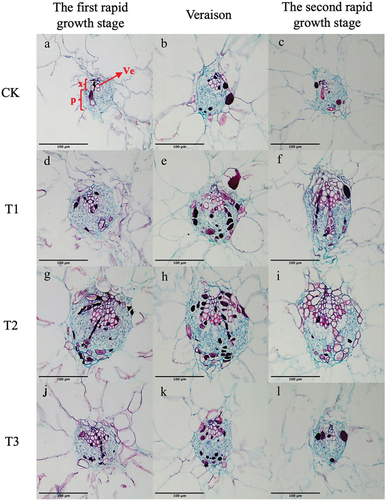
During the first rapid growth stage of the fruit, the area of the equatorial vascular bundle and phloem in T1-treated fruit was significantly higher than that of other treatments (Av: 60174 ± 525 μm2; Ap :4,225 ± 2059 μm2) (). At this point, the maximum area of the xylem in fruit under T2-treated was 9431 ± 2316 μm2. At veraison, there was a small difference in the area of the equatorial vascular bundle and phloem of berries under gibberellin treatment, which was significantly higher than that of the control. At this time, the vascular bundle subjected to the T2 treatment was the largest, and the area of the equatorial xylem was significantly higher than that of the other three treatments (7910 ± 973 μm2). At the second rapid growth stage, there was a small difference in the area of the equatorial phloem and xylem subjected to gibberellin treatment, which remained significantly higher than that of the control. By analyzing the area of peripheral vascular bundles in the three periods, it was found that they were different from the central vascular bundles.
Figure 9. Areas of the peripheral vascular bundles (pvb) of ‘Shine Muscat’ grapes under different treatments during three stages of growth.Av: vascular bundles area, Ap: phloem area, Ax: xylem area. Different lower-case letters indicate significant differences among treatments (n = 3, Duncan’s test, p <.05).
The number of vessels in the vascular bundles of fruit at the first rapid growth stage, veraison, and the second rapid growth stage treated with gibberellin was significantly higher than the control, with the number of vessels being greatest in fruit subjected to T2, with T2>T1>T3>CK ().
Figure 10. Number of vessels in the xylem of the central vascular bundles (Cvb) and peripheral vascular bundles (Pvb) of ‘Shine Muscat’ under different treatments during three stages of growth. Different lower-case letters indicate significant differences among treatments (n = 3, Duncan’s test, p <.05).
Water Transport
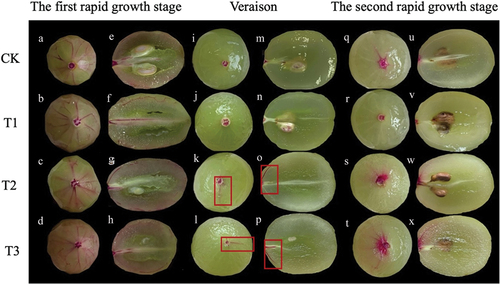
Water absorption of berries at different stages could be seen by observing the distribution of dye in the berry vascular bundles (). Almost all the main veins and branches of all peripheral vascular bundles under GA3-treated and control fruit were stained during the first rapid growth stage of “Shine Muscat” grapes, and the central vascular bundles and some of the embryonic vascular bundles were also stained; this indicated that water could be transported to the stained cells (). During veraison, the staining area of peripheral vascular bundles was significantly reduced in all treatments. Only a small part of some peripheral vascular bundles’ main veins were stained in T2 and T3 fruit (), and only part of the central vascular bundles were stained in T3 fruit (). The dye transport in fruit subjected to the T1 treatment and the control (CK) only reached the pedicel (). During the second rapid growth stage, the staining of vascular bundles was less than during the first rapid growth stage but higher than during veraison. The main veins of peripheral vascular bundles were stained in control, T2, and T3 fruit ().
Figure 11. Dye transport distribution in ‘Shine Muscat’ grapes in the first rapid growth stage (A-H), veraison (I-P), and the second rapid growth stage (Q-X) subjected to CK(a、e、i、m、q、u)、T1(b、f、j、n、r、v)、T2(c、g、k、o、s、w) and T3(d、h、l、p、t、x) treatments.
The vessel diameters were divided into 6 classes from 0–12 μm using 2 μm intervals. The central vascular bundles’ xylem area-specific hydraulic conductivity (K), derived from the Hagen-Poiseuille equation, demonstrated that a significant proportion of K could be attributed to xylem vessels in the 8–10 µm diameter classes in control, T2 and T3 fruit, while the 10–12 µm diameter class of xylem vessels contribute more to K than other classes in T1-treated fruit during the first rapid growth stage (). During veraison, a significant proportion of K could be attributed to xylem vessels in the 8–10 µm diameter classes in fruit subjected to T2. The significant proportion of K under other treatments is mainly concentrated in 10–12 µm (). And a significant proportion of K could be attributed to xylem vessels in the 8–10 µm diameter classes in control fruit and those subjected to the T1-treated. In fruit from the T2 and T3-treated, a significant proportion of K was mainly concentrated in vessels with a diameter of 10–12 µm during the second rapid growth stage ().
Figure 12. Relative abundance (white bars) of vessels in five diameter classes in the central vascular bundles of “Shine Muscat” grapes subjected to the CK, T1, T2, and T3 treatments and their relative correlation to the potential area-specific hydraulic conductivity (K, in percentage, black bars) at the first rapid growth stage (a), veraison (b) and the second rapid growth stage (c). Different lower-case letters indicate that there are differences in vessel abundance of different classes, and different upper-case letters indicate that there are differences in K (n = 3, Duncan’s test, p < .05).
Then, the predominant vessel classes under each treatment were statistically analyzed, based on the significant proportion of K, it was found that the abundance of vessels in vessel diameter was CK>T3>T1>T2 under the significant proportion of K in the equatorial part of the central vascular bundle during the first rapid growth stage. During veraison, the abundance of vessels in the diameter class was T1>T2>T3>CK under the significant proportion of K in the equatorial part of the central vascular bundle. At the second rapid growth stage, it was T1>CK>T2>T3.
During the first rapid growth stage, a significant proportion of K could be attributed to xylem vessels in the 10–12 µm diameter class in the control fruit and those subjected to T3. The significant proportion of K is mainly concentrated in both the 6–8 µm and 8–10 µm diameter classes for fruit subjected to T1. Under T2, the significant proportion of K was mainly concentrated in the 6–8 µm diameter class (). In control, T2- and T3-treated fruit, a significant proportion of K could be attributed to xylem vessels in the 6–8 µm diameter classes, while the 8–10 µm diameter class of xylem vessels contribute more to K than other classes under T1-treated fruit during veraison (). During the second rapid growth stage, a significant proportion of K could be attributed to xylem vessels in the 6–8 µm diameter classes in control, T1, and T3 fruit, while the 8–10 µm diameter class of xylem vessels contribute more to K than other classes in fruit subjected to the T2 treatment ().
Figure 13. Relative abundance (white bars) of five vessel diameter classes in the peripheral vascular bundles of “Shine Muscat” grapes subjected to CK, T1, T2, and T3 and their relative correlation to the potential area-specific hydraulic conductivity (K, in percentage, black bars) at the first rapid growth stage (A), veraison (B) and the second rapid growth stage (C). Different lower-case letters indicate that there are differences in vessel abundance of different classes, and different upper-case letters indicate that there are differences in K (n = 3, Duncan’s test, p < .05).
Then, the predominant vessel classes under each treatment were statistically analyzed, based on the significant proportion of K, it was found that the abundance of vessels in the diameter classes was T1>T2>T3>CK under the significant proportion of K in the equatorial part of the peripheral vascular bundles during the first rapid growth stage and veraison. At the second rapid growth stage, it was T2>T3>CK>T1.
Sugar Unloading
During veraison, a large amount of fructose and glucose began to accumulate in the “Shine Muscat” grapes, with fructose content higher than glucose content (). At this time, there was still a small amount of sucrose. After gibberellin treatments, the changes of fructose and glucose unloading in the fruit phloem showed a bimodal curve across the five time periods (9:30–10:00,11:30–12:00,13:30–14:00,15:30–16:00,17:30–18:00). In the morning, the fruit unloading rapidly increased to a peak at 12:00, roughly in sync with the increase in photosynthetic rate. Afterward, it rapidly decreased to a bottom at 14:00, and then sugar unloading increased again. At 16:00, it reached a small peak again and decreased again with sunset. The unloading volume is large in the morning, with a peak of about 1.1 times that of the afternoon peak. Unlike the gibberellin treatments, the control treatment showed a single peak curve, with a rapid increase in fruit unloading in the morning and reaching its peak at 14:00, followed by a rapid decrease. From different time periods, the highest fructose unloading amount (3.89 ± 0.04 mg g−1) was observed in berries subjected to the T3 treatment from 9:30 to 10:00, which was significantly higher than that of control fruit (3.51 ± 0.02 mg g−1). The highest fructose unloading amount (4.21 ± 0.06 mg g−1) was observed in T1-treated berries from 11:30 to 12:00, and the highest fructose unloading amount was observed in control fruit from 13:30 to 14:00. From 15:30 to 16:00 and 17:30 to 18:00, the highest fructose unloading amount was observed in T2-treated berries, 3.89 ± 0.00 mg g−1 and 3.30 ± 0.03 mg g−1 respectively. In addition, the glucose unloading amounts of T3-treated berries were the highest at 9:30–10:00 and 11:30–12:00, respectively, at 2.98 ± 0.04 mg g−1 and 3.11 ± 0.01 mg g−1, similar to fructose during the 13:30–14:00 time period. The maximum glucose unloading amount in control fruit was 3.20 ± 0.03 mg g−1 and the highest glucose unloading amount was still observed in fruit subjected to T3 (3.11 ± 0.04 mg g−1) from 15:30–16:00, and T2 (2.91 ± 0.04 mg g−1) from 17:30–18:00. Fructose and glucose unloading in fruit subjected to each treatment during the five time periods was greatest during veraison, with fruit from the T2 treatment having the highest fruit sugar unloading amount (32.25 ± 0.27 mg g−1).
Figure 14. Sugar offloading of “Shine Muscat” grapes during veraison and the second rapid growth stage subjected to different gibberellin treatments. Different lower-case letters indicate that there are significant differences (n = 3, Duncan’s test, p < .05).
Analysis of the components of the sugar unloading solution of nondetached fruit during the second rapid growth stage revealed that a large amount of fructose and glucose was still accumulated in the “Shine Muscat” grapes, and was similar to the rate at veraison, with fructose content higher than glucose content (). At this time, the main sugars present in the “Shine Muscat” berries were fructose and glucose, with trace amounts of sucrose. The sugar unloading curve of grapes under different treatments during the second rapid growth stage presents a single peak curve. The fruit unloading amount reached its peak at 10:00 in the morning, then slowly decreased to the bottom at 14:00. Afterward, with the increase of photosynthetic rate, sugar unloading increased again, reaching a small peak at 16:00, and then decreasing at sunset. The unloading volume in the morning is higher than in the afternoon, with the highest value being about twice that of the afternoon. The highest amount of fructose unloading was observed in the first four time periods in fruit subjected to T2. From 17:30 to 18:00, the highest amount of fructose unloading was observed in fruit subjected to T3 (3.35 ± 0.03 mg g−1). In addition, the maximum glucose unloading amounts of berries subjected to T2 were 3.09 ± 0.04 mg g−1, 2.92 ± 0.00 mg g−1, and 2.72 ± 0.03 mg g−1 at 9:30–10:00, 13:30–14:00, and 17:30–18:00, respectively. During the time periods of 11:30–12:00 and 15:30–16:00, the glucose unloading amounts in fruit subjected to T3 were 2.91 ± 0.07 mg g−1 and 3.03 ± 0.03 mg g−1, respectively. Fructose and glucose unloading under each treatment during the five time periods were found to be highest during the ripening period in fruit subjected to T2 (31.26 ± 0.46 mg g−1).
Discussion
GA3, as one of the most widely applied plant growth regulators, can elongate rachis, induce seedlessness, improve fruit set, and promote fruit expansion (Aya et al., Citation2009; Mullins et al., Citation1992). There are many factors affecting the growth of grape berries and different cultivars have different sensitivities to GA3 treatments. At present, GA3 is applied to “Kyoho” (Lee et al., Citation2013), “Centennial Seedless” (Pires et al., Citation1997), “Shiraz” (Xie et al., Citation2022), “Thompson Seedless” (Kasimatis et al., Citation1979) and many other grape varieties to improve berry quality and marketability. In this paper, we investigated the changes in the berry quality of “Shine Muscat” grapes subjected to three different GA3 treatments. It was found that the best berry expansion and elongation effects were evident in T2-treated fruit (). In addition, the differences in sugar-acid ratio and firmness of berries after GA3 treatment were small compared to that of control fruit, which suggests that GA3 treatment did not affect the flavor of berries.
The growth of berries is closely related to the material transport channel, so the vascular bundle of fruit under each treatment was studied. Vascular bundles of grape berries are mainly responsible for transporting water, inorganic salts, and organic matter, which play an important role in berry growth and quality formation. Dye tracing studies of plant vascular bundle transport have been reported since the 1960s. Bondada et al. (Citation2005) used basic fuchsin to observe the changes in water transport in the vascular bundle of grapes at different development stages. Davière et al. (Citation2004) used 1% acid fuchsin to observe the changes in xylem functionality in apple fruit. Bian et al. (Citation2015) used red ink to observe the distribution of vascular bundles in jujube. In our study, the distribution of vascular bundles was found to be the same in all treatments by dye tracing, with the central vascular bundle of the berry consisting of 4–6 vascular bundles and about 2 vascular bundles extending from the peduncle to the top of the berry. The peripheral vascular bundles are distributed in a network within the exocarp and mesocarp, with connections distributed within the mesocarp. The central vascular bundles at the top of the berry are aggregated and connected with the peripheral vascular bundle, so the vascular bundle system in grape berry is integrated, and the transport efficiency can be improved based on this kind of structure.
The differentiation and growth of the vascular system are controlled by hormones (Aloni, Citation1987). Gibberellin treatment has a facilitative effect on vascular tissues differentiation, which may be related to gibberellin’s ability to promote cell division and elongation (Bleecker et al., Citation1986; Stamm and Kumar, Citation2013; van der Knaap et al., Citation2000). In this paper, we found that the area of the vascular bundles, xylem, and phloem of the berry was significantly increased after GA3 treatment compared with the control by counting the area of vascular bundles through sectional observation (). Guo et al. (Citation2015) used toluidine blue staining on the birch hypocotyl base and found that GA3 treatment affected differentiation in the xylem of the hypocotyl and promoted xylem development. Wang et al. (Citation2015) found that exogenous gibberellin could promote the increase of xylem in carrots; Tokunaga et al. (Citation2006) showed that GA played an important role in the xylem vessel origination of zinnias. In addition, GA can change the growth and development of phloem by promoting the elongation of primary phloem fibers and decreasing the thickness of phloem cell walls in Coleus blumei Benth (Aloni, Citation1979).
The dye tracing method revealed that the vascular bundle transport capacity of the fruit was the highest at the first rapid growth stage, and the transport speed of each treatment showed CK>T3>T2>T1. At veraison, the vascular bundle transport capacity of the fruit decreased but increased at the second rapid growth stage. The transport rates between different treatments showed T2>T3>CK>T1 (). We found that the water transport rate is highest in the control fruit, which further focuses on water transport to the vessel water transport. Currently, the significant proportion of K under water treatment has the highest vessel abundance in vessel diameter (). Therefore, during the first rapid growth stage, water is mainly transported through the central vascular bundle xylem. Ollat et al. (Citation2002) found that entering the second rapid growth period, the central vascular bundle becomes blocked, and water and sugar can only be transported into the berry through the peripheral vascular bundle. At veraison, although GA treatment can significantly increase the diameter of the vessels (Nishijima et al., Citation2005), Bondada et al. (Citation2005) showed that the structure and function of the xylem in the grape are lost after transformation. At this time, fruit subjected to T2 has the highest water transport rate, and the area and number of vessels in the vascular bundle, xylem, and phloem are highest, however, under the significant proportion of K, the largest vessel abundance in the diameter class was observed in the fruit subjected to T1 (), indicating that the water transport capacity of the vessel decreased at veraison, mainly through the phloem. During the second rapid growth period, fruit subjected to T2, only the significant proportion of K in the middle and lower parts of the peripheral vascular bundle was found to have the highest vascular abundance at the diameter class. The transportation capacity of the peripheral vascular bundle was higher than that of the central vascular bundle at this time (). Xie et al. (Citation2012) showed that after veraison, the xylem vessels of the peripheral vascular bundle of grapes ruptured, and during the second rapid growth period, water was mainly transported to the berry through the phloem pathway (Choat et al., Citation2009). Therefore, during the second rapid growth period, water transportation to the berry was mainly completed by the peripheral vascular bundle phloem. During this stage, the accumulation of sugar in the fruit increased, and the osmotic regulation ability of the fruit improved. Under T2, the content of sugar unloading in the fruit was highest (), which further promoted water to enter the berry through the phloem.
Conclusion
GA3 treatment can significantly promote the differentiation of vascular tissues and improve water transport capacity and sugar unloading, thereby improving berry quality. T2 can promote the development of vascular bundles and phloem, enhance the water transport capacity of fruit after entering veraison, and promote berry expansion. During the second rapid growth stage, water transport was mainly completed by the phloem of peripheral vascular bundles.
Disclosure Statement
No potential conflict of interest was reported by the author(s).
Additional information
Funding
References
- Aloni, R. 1979. Role of auxin and gibberellin in the differentiation of primary phloem fibers. Plant Physiol. 63(4):609–614. doi: 10.1104/pp.63.4.609.
- Aloni, R. 1987. Differentiation of vascular tissues. Annu. Rev. Plant Biol. 38(1):179–204. doi: 10.1146/annurev.pp.38.060187.001143.
- Aya, K., M. Ueguchi-Tanaka, M. Kondo, K. Hamada, K. Yano, M. Nishimura, and M. Matsuoka. 2009. Gibberellin modulates another development in rice via the transcriptional regulation of GAMYB. Plant Cell 21(5):1453–1472. doi: 10.1105/tpc.108.062935.
- Ben-Tal, Y. 1990. Effects of gibberellin treatments on ripening and berry drop from Thompson seedless grapes. Am. J. Enol. Vitic. 41(2):142–146. doi: 10.5344/ajev.1990.41.2.142.
- Bian, Y., L. Di, D.H. Li, and X.G. Li. 2015. Vascular anatomy of Chinese jujube fruit. Guoshu. Xuebao. 32:448–452.
- Bleecker, A.B., J.L. Schuette, and H. Kende. 1986. Anatomical analysis of growth and developmental patterns in the internode of deepwater rice. Planta 169(4):490–497. doi: 10.1007/BF00392097.
- Bondada, B.R., M.A. Matthews, and K.A. Shackel. 2005. Functional xylem in the post-veraison grape berry. J. Exp. Bot. 56(421):2949–2957. doi: 10.1093/jxb/eri291.
- Choat, B., G.A. Gambetta, K.A. Shackel, and M.A. Matthews. 2009. Vascular function in grape berries across development and its relevance to apparent hydraulic isolation. Plant Physiol. 151(3):1677–1687. doi: 10.1104/pp.109.143172.
- Coombe, B.G. 1960. Relationship of growth and development to changes in sugars, auxins, and gibberellins in the fruit of seeded and seedless varieties of Vitis vinifera. Plant Physiol. 35(2):241. doi: 10.1104/pp.35.2.241.
- Coombe, B.G., and G.R. Bishop. 1980. Development of the grape berry. II. Changes in diameter and deformability during veraison. Aust. J. Agri. Res. 31(3):499–509. doi: 10.1071/ar9800499.
- Davière, L., A. Lang, A.J. Hall, R.K. Volz, and P.E. Jameson. 2004. Causes and effects of changes in xylem functionality in apple fruit. Ann. Bot. 93(3):275–282. doi: 10.1093/aob/mch040.
- Davière, J.M., M.D. Lucas, and S. Prat. 2008. Transcriptional factor interaction: a central step in DELLA function. Curr. Opin. Genet. Dev. 18(4):295–303. doi: 10.1016/j.gde.2008.05.004.
- Delrot, S., S. Picaud, and J.P. Gaudillere. 2001. Water transport and aquaporins in grapevine, In: Molecular biology & biotechnology of the grapevine. Springer, Dordrecht. pp. 241–262. doi: 10.1007/978-94-017-2308-4_10.
- Dettmer, J., A. Elo, and Y. Helariutta. 2009. Hormone interactions during vascular development. Plant Mol. Biol. 69(4):347–360. doi: 10.1007/s11103-008-9374-9.
- Gao, X.T., M.H. Wu, D. Sun, H.Q. Li, W.K. Chen, H.Y. Yang, F.Q. Liu, Q.C. Wang, Y.Y. Wang, J. Wang, et al. 2020. Effects of gibberellic acid (GA3) application before anthesis on rachis elongation, berry quality, aroma, and flavor compounds in Vitis vinifera L. ‘Cabernet Franc’ and ‘Cabernet Sauvignon’ grapes. J. Sci. Food Agric. 100(9):3729–3740. doi: 10.1002/jsfa.10412.
- Guo, H.Y., Y.C. Wang, H.Z. Liu, P. Hu, Y.Y. Jia, C.R. Zhang, Y.M. Wang, S. Gu, C.P. Yang, and C. Wang. 2015. Exogenous GA3 application enhances xylem development and induces the expression of secondary wall biosynthesis related genes in Betula platyphylla. Int. J. Mol. Sci. 16(9):22960–22975. doi: 10.3390/ijms160922960.
- Guzmán, Y., B. Pugliese, C.V. González, C. Travaglia, R. Bottini, and F. Berli. 2021. Spray with plant growth regulators at full bloom may improve the quality for storage of Superior Seedless table grapes by modifying the vascular system of the bunch. Postharvest Biol. Technol. 176:111522. doi: 10.1016/j.postharvbio.2021.111522.
- Hardie, W.J., T.P. O’Brien, and V.G. Jaudzems. 1996. Morphology, anatomy and development of the pericarp after anthesis in grape, Vitis vinifera L. Aust. J. Grape Wine Res. 2(2):97–142. doi: 10.1111/j.1755-0238.1996.tb00101.x.
- Harrell, D.C., and L.E. Williams. 1987. The influence of girdling and gibberellic acid application at Fruitset on ruby seedless and Thompson seedless grapes. Am. J. Enol. Vitic. 38(2):83–88. doi: 10.5344/ajev.1987.38.2.83.
- Kasimatis, A.N., F.H. Swanson, E.P. Vilas, W.L. Peacock, and G.M. Leavitt. 1979. The relation of bloom-applied gibberellic acid to the yield and quality of Thompson seedless raisins. Am. J. Enol. Vitic. 30(3):224–226. doi: 10.5344/ajev.1979.30.3.224.
- Lee, B., Y. Kwon, Y. Park, and H.S. Park. 2013. Effect of GA3 and Thidiazuron on seedlessness and fruit quality of ‘Kyoho’ grapes. Hortic Sci. Technol. 31(2):135–140. doi: 10.7235/hort.2013.12065.
- Li, X., S. Li, and J.X. Lin. 2003. Effect of GA3 spraying on lignin and auxin contents and the correlated enzyme activities in bayberry (Myrica rubra Bieb.) during flower-bud induction. Plant Sci. 164(4):549–556. doi: 10.1016/s0168-9452(03)00004-9.
- Mullins, M.G., A. Bouquet, and L.E. Williams. 1992. Biology of the grapevine. Cambridge: Cambridge University Press.
- Nishijima, T., H. Sugii, N. Fukino, and T. Mochizuki. 2005. Aerial tubers induced in turnip (Brassica rapa L. var. Rapa (L.) Hartm.) by gibberellin treatment. Sci. Hortic. 105(4):423–433. doi: 10.1016/j.scienta.2005.02.005.
- Ollat, N., J.P. Carde, J.P. Gaudillère, F. Barrieu, P. Diakou, and A. Moing. 2002. Grape berry development: A review. OENO One 36(3):109–131. doi: 10.20870/oeno-one.2002.36.3.970
- Pérez, F.J., and M. Gómez. 2000. Possible role of soluble invertase in the gibberellic acid berry-sizing effect in Sultana grape. Plant Growth Regul. 30(2):111–116. doi: 10.1023/A:1006318306115.
- Pires, E.J., M.M. Terra, C.V. Pommer, and I.R. Passos. 1997. Improvement of cluster and berry quality of Centennial Seedless grapes through gibberellic acid. Acta Hortic. (526):293–302. doi: 10.17660/actahortic.2000.526.31
- Rogiers, S.Y., J.A. Smith, R. White, M. Keller, B.P. Holzapfel, and J.M. Virgona. 2001. Vascular function in berries of Vitis vinifera (L) cv. Shiraz. Aust. J. Grape Wine Res. 7(1):47–51. doi: 10.1111/j.1755-0238.2001.tb00193.x
- Schneider, C.A., W.S. Rasband, and K.W. Eliceiri. 2012. NIH image to ImageJ: 25 years of image analysis. Nat. Methods 9(7):671–675. doi: 10.1038/nmeth.2089
- Stamm, P., and P.P. Kumar. 2013. Auxin and gibberellin-responsive Arabidopsis SMALL AUXIN UP RNA36 regulate hypocotyl elongation in the light. Plant Cell Rep. 32(6):759–769. doi: 10.1007/s00299-013-1406-5
- Sun, T.P. 2011. The molecular mechanism and evolution of the GA–GID1–DELLA signaling module in plants. Curr. Biol. 21(9):338–345. doi: 10.1016/j.cub.2011.02.036
- Sun, T., and F. Gubler. 2004. Molecular mechanism of gibberellin signaling in plants. Annu. Rev. Plant Biol. 55(1):197. doi: 10.1146/annurev.arplant.55.031903.141753
- Teszlák, P., K. Gaál, and M.S.P. Nikfardjam. 2005. Influence of grapevine flower treatment with gibberellic acid (GA3) on polyphenol content of Vitis vinifera L. wine. Anal. Chim. Acta 543(1–2):275–281. doi: 10.1016/j.aca.2005.04.013
- Tokunaga, N., N. Uchimura, and Y. Sato. 2006. Involvement of gibberellin in tracheary element differentiation and lignification in Zinnia Elegans xylogenic culture. Protoplasma 228(4):179–187. doi: 10.1007/s00709-006-0180-4
- Tyerman, S.D., J. Tilbrook, C. Pardo, L. Kotula, W. Sullivan, and E. Steudle. 2004. Direct measurement of hydraulic properties in developing berries of Vitis vinifera L. cv Shiraz and Chardonnay. Aust. J. Grape Wine Res. 10(3):170–181. doi: 10.1111/j.1755-0238.2004.tb00020.x
- Tyree, M.T., and F.W. Ewers. 1991. The hydraulic architecture of trees and other woody plants. New Phytol. 119(3):345–360. doi: 10.1111/j.1469-8137.1991.tb00035.x
- van der Knaap, E., J.H. Kim, and H. Kende. 2000. A novel gibberellin-induced gene from rice and its potential regulatory role in stem growth. Plant Physiol. 122(3):695–704. doi: 10.1104/pp.122.3.695
- Vera-Sirera, F., M.D. Gomez, and M.A. Perez-Amador. 2016. DELLA Proteins, a group of GRAS transcription regulators that mediate Gibberellin signaling- ScienceDirect. pp. 313–328. Plant Transcription Factors. Academic Press. doi: 10.1016/b978-0-12-800854-6.00020-8
- Wang, Z.P., C. Alain, and D. Alain. 2006. A new method for consecutively measuring the accumulation of sugar in grape fruit. Guoshu. Xuebao. 23(5):770–773. doi: 10.3969/j.issn.1009-9980.2006.05.026
- Wang, G.L., F. Que, Z.S. Xu, F. Wang, and A.S. Xiong. 2015. Exogenous gibberellin altered morphology, anatomic and transcriptional regulatory networks of hormones in carrot root and shoot. BMC Plant Biol. 15(1):1–12. doi: 10.1186/s12870-015-0679-y
- White, F.M., and J. Majdalani. 2006. Viscous fluid flow. McGraw-Hill: New York, pp. 433–434.
- Xie, Z.S., H.M. Cao, B. Li, W.F. Li, W.P. Xu, and S.P. Wang. 2012. Changes of water transportation in berry vascular bundle at different developmental phases of Kyoho grape berry. Zhongguo. Nong. Ye. Ke. Xue. 45(1):111–117.
- Xie, S., Y. Liu, H.W. Chen, B.W. Yang, M.S. Ge, and Z.W. Zhang. 2022. Effects of gibberellin applications before flowering on the phenotype, ripening, and flavonoid compounds of Syrah grape berries. J. Sci. Food Agric. 102(13):6100–6111. doi: 10.1002/jsfa.11962