
Abstract
The autophagy-related proteins ATG12 and ATG5 form a covalent complex essential for autophagy. Here, we demonstrate that ATG12 has distinct functions from ATG5 in pro-opiomelanocortin (POMC)-expressing neurons. Upon high-fat diet (HFD) consumption, mice lacking Atg12 in POMC-positive neurons exhibit accelerated weight gain, adiposity, and glucose intolerance, which is associated with increased food intake, reduced ambulation, and decreased LEP/leptin sensitivity. Importantly, although genetic deletion of either Atg12 or Atg5 renders POMC neurons autophagy-deficient, mice lacking Atg5 in POMC neurons do not exhibit these phenotypes. Hence, we propose nonautophagic functions for ATG12 in POMC neurons that counteract excessive weight gain in response to HFD consumption.
Abbreviations:
- AGRP, agouti-related peptide
- BAC, bacterial artificial chromosome
- BafA, bafilomycin A1
- BMD, bone mineral density
- CLAMS, Comprehensive Lab Animal Monitoring System
- DEXA, dual energy X-ray absorptiometry
- HBSS, Hank's balanced salt solution
- HFD, high-fat diet
- LC3-II, phosphatidylethanolamine conjugated isoform of microtubule-associated protein 1 light chain 3
- LEP, leptin
- MAP1LC3, microtubule-associated protein 1 light chain 3
- MEFs, mouse embryonic fibroblasts
- NBR1, neighbor of BRCA1 gene 1
- NPY, neuropeptide Y
- PBS, phosphate-buffered saline
- PE, phosphatidylethanolamine
- pSTAT3, phosphorylated form of signal transducer and activator of transcription 3 (acute-phase response factor)
- POMC/ACTH, pro-opiomelanocortin-α (in mice), proopiomelanocortin (in humans)
- SQSTM1/p62, sequestosome 1
- SV40Tag, simian virus 40 T antigen
- UBL, ubiquitin-like molecule
Introduction
Macroautophagy (hereafter called autophagy) is an evolutionarily conserved lysosomal degradation process crucial for cellular homeostasis and adaptation to stress; it is tightly controlled by highly conserved molecules, called autophagy-related proteins or ATGs.Citation1 Several core ATGs are required for 2 ubiquitin-like conjugation pathways that mediate autophagosome formation. The first involves the ubiquitin-like molecule (UBL), ATG12, which is activated by the E1-like enzyme ATG7, transferred to the E2-like enzyme, ATG10, and ultimately conjugated to ATG5.Citation2 In the second pathway, the UBL Atg8 (for which, MAP1LC3 [microtubule-associated protein 1 light chain 3] is a chief mammalian ortholog), is conjugated to the lipid phosphatidylethanolamine (PE) by ATG7, and the E2-like enzyme ATG3.Citation3 Notably, the ATG12–ATG5 complex provides an E3-like activity that mediates the efficient PE-lipidation of ATG8.Citation4,5 Importantly, genetic deletion of any of the individual ATGs in these pathways renders a cell or organism autophagy-deficient.Citation6-8
Although the ATGs in these conjugation pathways are essential for autophagy, recent evidence indicates these proteins may also mediate autophagy-independent functions.Citation9,10 For example, although the principal substrate for the UBL ATG12 is ATG5, resulting in the ATG12–ATG5 complex required for autophagy, recent work demonstrates that ATG12 is also conjugated to ATG3. Notably, disruption of ATG12 conjugation to ATG3 does not impact starvation-induced autophagy; rather, loss of ATG12–ATG3 affects mitochondrial morphology and homeostasisCitation11 Furthermore, the unconjugated form of ATG12 can bind and inactivate BCL2 via an unique BH3 like motif, which directly promotes mitochondrial apoptosis.Citation12 Together, these studies implicate ATG12 in cellular functions other than its canonical role in autophagosome formation.Citation13
To further dissect the functions of ATG12 in vivo, we generated complete and conditional Atg12-deletion mice. Similar to atg5 deficiency, complete atg12-null animals die on postnatal d 1, corroborating an essential role for the ATG12–ATG5 complex and autophagy during the neonatal period. Because Atg12 transcripts were highly enriched in the developing hypothalamus and pituitary, we compared the effects of Atg12 versus Atg5 genetic deletion in cells expressing POMC/ACTH (pro-opiomelanocortin-α) that reside in the hypothalamus and pituitary. In the brain, POMC-derived anorexigenic neuropeptides inhibit food intake and increase energy expenditure in response to circulating hormones, such as LEP/leptin.Citation14,15 Loss of POMC function in both rodents and humans results in severe hyperphagia and obesity, as does genetic deletion of POMC neurons in mice, emphasizing the importance of POMC in energy balance.Citation16,17 Here, we demonstrate that ATG12 and ATG5 are both essential for autophagy in POMC neurons, yet the loss of ATG12 in POMC neurons uniquely affects diet-induced obesity. Mice lacking Atg12 in POMC neurons (Atg12ckoPomc-Cre+ mice) have exacerbated HFD-induced obesity arising from hyperphagia and reduced energy expenditure. In contrast, mice lacking Atg5 in POMC neurons (Atg5ckoPomc-Cre+) do not exhibit accelerated body weight gain or impaired LEP sensitivity in response to HFD. Based on these results, we propose nonautophagic functions for ATG12 in POMC neurons that prevent excessive weight gain in animals upon HFD challenge.
Results
Mice lacking Atg12 exhibit neonatal lethality
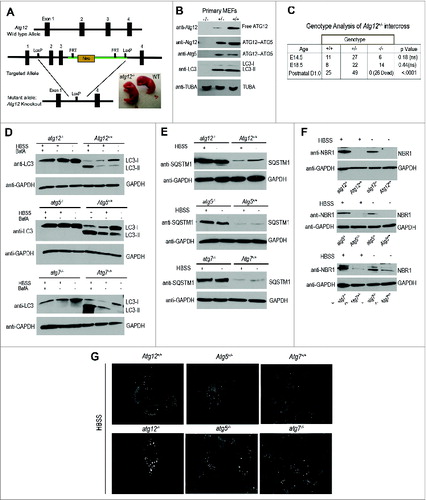
We generated mice with loxP recombination sites flanking exons 2 and 3 of mouse Atg12 in order to conditionally target the sequence encoding the ATG12 protein (). These animals were interbred with a ubiquitously expressed Cre transgenic strain (Zp3-Cre)Citation18 to excise the floxed allele, and subsequently, bred to homozygosity to create mice that were completely null for Atg12 (atg12-/-). Primary mouse embryonic fibroblasts (MEFs) derived from atg12-/- animals lacked both free ATG12 and the ATG12–ATG5 complex (). Furthermore, atg12-/- cells were autophagy-deficient as evidenced by the complete absence of the PE-lipidated form of MAP1LC3 (MAP1LC3-II/LC3-II). Similar to atg5-/- mice,Citation6 atg12-/- mice were present in Mendelian ratios during the late stages of embryonic development and were born morphologically normal (), but subsequently, all of the atg12-/- neonates rapidly died on postnatal d 1 (). Similar to atg5-/- and atg7-/- MEFs, SV40Tag-immortalized atg12-/- MEFs displayed a complete block in autophagic flux, both at baseline and in response to starvation with Hank's buffered saline solution (HBSS), evidenced by the lack of LC3-II, as well as the accumulation of SQSTM1/p62 and NBR1, 2 autophagy cargo receptors selectively degraded via autophagy (). In addition, atg12-/- cells exhibited increased SQSTM1 aggregation following HBSS starvation (). These findings confirm an essential role for ATG12 in autophagy as well as for the ATG12–ATG5 complex in neonatal survival.
Figure 1. Generation of Atg12 gene-targeted mice. (A) Schematic representation of the targeting vector and the targeted allele of the atg12 gene. The coding exons are depicted in black boxes. Right: Photograph of a representative atg12-/- neonate and Atg12+/+ (WT) littermate. (B) Immunoblotting with antibodies against ATG12, ATG5, and LC3 in protein lysates derived from primary MEFs from the indicated genotypes. (C) Genotyping of animals produced from intercrosses of Atg12+/- mice. (D–F) SV40Tag-immortalized MEFs of the indicated genotypes were starved with HBSS for 3 h, lysed, and subjected to immunoblotting with antibodies against LC3 (D), SQSTM1 (E), NBR1 (F), and GAPDH as a loading control. When indicated, cells were treated with 10 nM bafilomycin A1 (BafA) for 30 min prior to lysis in order to assess LC3-II turnover in the lysosome. (G) SV40Tag-immortalized MEFs of the indicated genotypes were HBSS starved for 4 h, fixed and immunostained with anti-SQSTM1 antibody. TUBA, tubulin.
POMC-specific genetic deletion of Atg12 or Atg5 does not impact body weight of mice fed a regular diet
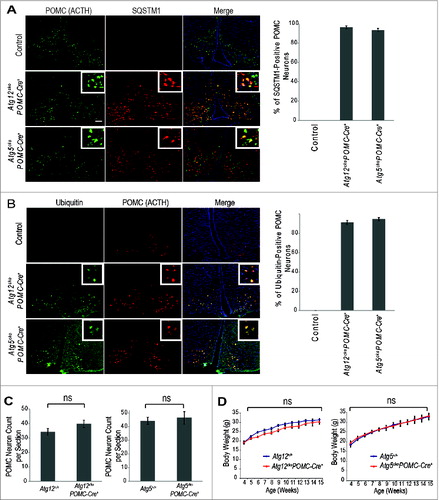
In situ hybridization analyses at E13.5 and E18.5 indicated that Atg12, but not Atg5 transcripts, were highly enriched in the pituitary and hypothalamus (Fig. S1). To further ascertain the functions of ATG12 vs. ATG5 in these tissues, we deleted Atg12 or Atg5 in Pomc-expressing cells. We confirmed hypothalamic Pomc neuron-specific, Cre-mediated recombination in Atg12ckoPomc-Cre+ and Atg5ckoPomc-Cre+ mice coexpressing an RFP reporter for Cre-mediated excision (R26-LSL-tdRFP) (Fig. S2A).Citation19 Moreover, in the absence of Pomc-Cre, Atg12f/f and Atg5f/f mice did not exhibit evidence of impaired autophagy in the hypothalamus (Fig. S2B). Upon Pomc-specific, Cre-mediated recombination, expression of the respective Atg isolated from total hypothalamic tissue was reduced by approximately 60% in both Atg12ckoPomc-Cre+ and Atg5ckoPomc-Cre+ mice (Fig. S2C). Upon deletion of either Atg, we confirmed accumulation of both SQSTM1 and ubiquitin in 95% to 100% of POMC neurons in the hypothalamus, corroborating the specific and complete loss of autophagy in the POMC neurons of both Atg12ckoPomc-Cre+ and Atg5ckoPomc-Cre+ animals (). Nonetheless, Atg12ckoPomc-Cre+ and Atg5ckoPomc-Cre+ mice displayed similar hypothalamic POMC neuron numbers as wild-type autophagy-competent controls ().
Figure 2. Effects of POMC-specific Atg12 and Atg5 deletion on body weight in mice fed a normal chow diet. (A) Accumulation of SQSTM1 (red) in POMC (ACTH, green) positive neurons confirms defective autophagy in hypothalamic POMC neurons of Atg12ckoPomc-Cre+ and Atg5ckoPomc-Cre+ mice. Bar = 500 μm Right: Quantification of the percentage of POMC neurons positive for SQSTM1 accumulation (n=4 for each genotype). (B) Accumulation of ubiquitin (green) in POMC (ACTH, red) positive neurons in hypothalamic POMC neurons of Atg12ckoPomc-Cre+ and Atg5ckoPomc-Cre+ mice. Bar = 500 μm Right: Quantification of the percentage of POMC neurons positive for ubiquitin accumulation (n=4 for each genotype). (C) POMC neuron quantification in Atg12+/+ vs. Atg12ckoPomc-Cre+ mice (n=5 for each genotype), and Atg5+/+ vs. Atg5ckoPomc-Cre+ mice (n=6 for each genotype). Sections from the arcuate nucleus of 15-wk-old mice were quantified. (D) Body weight curves for Atg12+/+ (n=14 ) vs. Atg12ckoPomc-Cre+ mice (n=10 ), and Atg5+/+ (n=10 ) vs. Atg5ckoPomc-Cre+ mice (n=8 ) maintained on normal chow. For all experiments, control mice are Pomc-Cre-expressing wild-type littermates (Atg12+/+ or Atg5+/+). n.s., nonsignificant. Data represent the means ± SEM.
Multiple studies recently showed that Atg7 deletion in POMC neurons causes increased body weight due to hyperphagia.Citation20-22 In contrast, we did not observe any changes in body weight (), fat mass and adiposity (percent body fat), lean mass, bone mineral density (BMD), and nose-to-anus length (Fig. S2D to G) in Atg12ckoPomc-Cre+ and Atg5ckoPomc-Cre+ mice fed a normal chow diet. Moreover, we observed similar body weight gain in both male and female Atg12ckoPomc-Cre+ and Atg5ckoPomc-Cre+ mice on normal chow (Fig. S2H). Pituitary corticotrophs express Pomc, the cleavage of which yields mature POMC that promotes the synthesis of glucocorticoids (corticosterone in mice) from the adrenal. Since pomc-null mice have undetectable plasma corticosterone concentrations,Citation23 we measured plasma corticosterone as a proxy measure of corticotroph POMC function. We detected no differences in morning (circadian trough) corticosterone concentrations in unstressed Atg12ckoPomc-Cre+ and Atg5ckoPomc-Cre+ mice when compared to respective control littermates and no differences in pituitary Pomc expression (Fig. S2I to K), suggesting corticotroph POMC function was globally intact.
High-fat diet promotes adiposity and reduces energy expenditure in Atg12ckoPomc-Cre+ mice, but not Atg5ckoPomc-Cre+ mice
To evaluate the effects of Pomc-specific Atg12 or Atg5 deletion on the development of diet-induced obesity, we placed mice on a HFD for 10 wk. Although Atg12ckoPomc-Cre+ and Atg5ckoPomc-Cre+ mice on HFD both showed defective autophagy in hypothalamic POMC neurons, as evidenced by SQSTM1 accumulation (Fig. S3A), POMC-specific Atg12 deletion distinctly impacted HFD-induced obesity. Atg12ckoPomc-Cre+ mice gained body weight more rapidly than control littermates (), exhibiting 40% more body weight after 10 wk on HFD (). This body weight gain was reflected in greater fat mass and adiposity () without any effects on lean mass (), BMD (Fig. S3B) or nose-to-anus length (Fig. S3C). Accordingly, Atg12ckoPomc-Cre+ mice were more glucose intolerant () than controls, but they did not show significant changes in whole-body insulin resistance (Fig. S3D). The weight gain of Atg12ckoPomc-Cre+ animals fed HFD was associated with increased food intake (20% increase) and lower ambulatory activity (30% decrease) in the dark cycle (), while oxygen consumption (VO2) and carbon dioxide elimination (VCO2) remained unchanged (). In stark contrast, Atg5ckoPomc-Cre+ mice fed a HFD showed no alterations in any of these parameters when compared to control littermates ( and S3B and C).
Figure 3. High fat diet promotes greater adiposity in Atg12ckoPomc-Cre+, but not Atg5ckoPomc-Cre+, mice. (A) Images of the indicated genotypes at 12 wk of age on a HFD. (B) Body weight curves for Atg12+/+ (n=10 ) vs. Atg12ckoPomc-Cre+ mice (n=7 ), and Atg5+/+ (n=13 ) vs. Atg5ckoPomc-Cre+ mice (n=11 ). (C) DEXA analysis for % fat in Atg12ckoPomc-Cre+ mice vs. Atg12+/+ mice (left, n=5 for each genotype), and Atg5+/+ vs. Atg5ckoPomc-Cre+ mice on HFD (right, n=7 for each genotype) on HFD for 8 wk. (D) DEXA analysis for lean mass in Atg12ckoPomc-Cre+ or Atg5ckoPomc-Cre+ mice on HFD for 8 wk. (E) Glucose tolerance tests for Atg12ckoPomc-Cre+ vs. Atg12+/+ mice (left, n = 7 for each genotype) and Atg5ckoPomc-Cre+ vs. Atg5+/+ (right, n=7 for each genotype) on HFD. GTT was analyzed at 8 wk of age. (F) CLAMS analysis of food intake during the light and dark cycle in 15-wk-old in Atg12+/+ (n = 5) and Atg12ckoPomc-Cre+ (n = 5) mice and Atg5+/+ (n=5 ) vs. Atg5ckoPomc-Cre+ (n=5 ) mice on HFD for 10 wk. (G) CLAMS analysis of total movement during the light and dark cycle of Atg12+/+ vs. Atg12ckoPomc-Cre+ mice, and Atg5+/+ vs. Atg5ckoPomc-Cre+ mice on HFD for 10 wk. (H, I) CLAMS analysis of oxygen consumption (VO2) and carbon dioxide elimination (VCO2) during the light and dark cycle of Atg12+/+ vs. Atg12ckoPomc-Cre+ mice, and Atg5+/+ vs. Atg5ckoPomc-Cre+ mice on HFD. Values were normalized to lean body mass. For all experiments, control mice are Pomc-Cre-expressing wild-type littermates (Atg12+/+ or Atg5+/+). n.s., nonsignificant. Data represent mean ± SEM.
Atg12 deletion in POMC neurons impairs LEP/leptin sensitivity and Pomc expression in HFD-fed mice
The anorexegenic functions of POMC neurons in vivo are partly controlled by LEP released in proportion to body energy levels, resulting in reduced appetite and body weight.Citation24,25 To ascertain differences in LEP sensitivity between Atg12ckoPomc-Cre+ and Atg5ckoPomc-Cre+ mice, mice were first fed a HFD for 2 wk, a time point prior to any weight divergence between genotypes; thereafter, they were subject to acute LEP treatment. In POMC neurons, LEP activates the JAK-STAT3 pathway; hence, we quantified the phosphorylation of STAT3 (pSTAT3) in POMC neurons to assess LEP sensitivity.Citation26-28 Atg12ckoPomc-Cre+ mice displayed 2-fold fewer pSTAT3+ POMC neurons compared to both autophagy-competent wild-type controls and autophagy-deficient Atg5ckoPomc-Cre+ mice after LEP treatment (). Importantly, blood LEP concentrations following 2 wk of HFD (and prior to acute LEP injection) were equivalent between control, Atg12ckoPomc-Cre+ and Atg5ckoPomc-Cre+ mice (). Thus, ATG12 deletion in POMC neurons reduced LEP sensitivity in mice acutely fed a HFD for 2 wk.
Figure 4. Atg12 deletion in POMC neurons impairs LEP sensitivity and Pomc expression in HFD-fed mice. (A) Control, Atg12ckoPomc-Cre+ mice and Atg5ckoPomc-Cre+ mice were fed a HFD for 2 wk and treated with LEP (3 mg/kg i.p. in PBS) for 45 min. LEP-induced STAT3 phosphorylation in POMC neurons was analyzed by immunofluorescence using anti-phospho-STAT3 (Tyr705) (red, pSTAT3) and anti-POMC/ACTH (green) to detect POMC neurons. Bar = 100 μm. (B) Percentage of POMC neurons positive for pSTAT3 was quantified from the indicated cohorts (n=4 for each genotype). (C) Blood LEP levels in the indicated mice (n=4 for each genotype) following 2 wk HFD (D) mRNA expression of Pomc, Agrp and Npy in the hypothalamus of Atg12+/+ (n=4 ), Atg12ckoPomc-Cre+ (n=4 ) and Atg5+/+ (n=5 ), and Atg5ckoPomc-Cre+ mice (n=6 ) fed HFD for 10 wk. (E) mRNA expression of Pomc, Agrp and Npy in the hypothalamus of mice fed HFD for 2 wk (n=4 for each genotype). (F) Quantification of POMC neurons in Atg12+/+ (n=5 ), Atg12ckoPomc-Cre+ (n=5 ) and Atg5+/+ (n=5 ) and Atg5ckoPomc-Cre+ mice (n=5 ). Mice fed HFD for 10 wk were analyzed. n.s., nonsignificant. Data represent the means ± SEM.
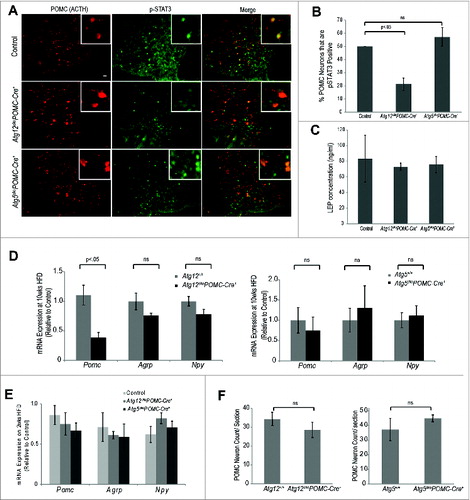
Cellular LEP resistance results in decreased LEP-stimulated Pomc expression over extended time periods.Citation29 Thus, we evaluated how HFD affected Pomc mRNA expression in Atg12ckoPomc-Cre+ mice over time. When mice were fed a HFD for 10 wk, we found 3-fold lower Pomc mRNA expression in the hypothalamus of Atg12ckoPomc-Cre+ mice, but no differences in mRNA expression of the orexigenic neuropeptides Agrp and Npy (). In contrast, Pomc expression differences were not found in mice fed a HFD for only 2 wk (). Moreover, Pomc mRNA expression in Atg5ckoPomc-Cre+ mice was similar to controls at both 2 and 10 wk of HFD (). Notably, these Pomc mRNA changes were not attributable to reduced POMC neuron number () or associated with increased cleaved CASP3 as an indicator of apoptosis in POMC neurons (Fig. S4). Thus, unlike cortical neurons where autophagy-deficiency predisposes to cell death,Citation30,31 the deletion of Atg12 or Atg5 does not compromise the survival of POMC neurons in mice, including animals on a HFD. Rather, upon initial challenge with a HFD, Atg12-deficient POMC neurons exhibit lower LEP sensitivity, thereby abrogating an important signal to prevent excessive weight gain. Over longer periods of HFD feeding, reduced hypothalamic Pomc expression in Atg12-deficient POMC neurons contributes to increased body weight and adiposity.
Discussion
Here, we demonstrate that the genetic deletion of Atg12 in POMC neurons accelerates body weight gain, disrupts energy balance, and reduces LEP sensitivity in animals challenged with a HFD. Notably, our results exhibit certain similarities with previous reports of POMC-specific Atg7 deletion; for example, one study found increased weight gain and adiposity in HFD-fed animals, while another reported reduced LEP-induced STAT3 activation upon Atg7 deletion in POMC neurons.Citation21,22 Nonetheless, in mice fed normal chow, our results using both Atg5ckoPomc-Cre+ and Atg12ckoPomc-Cre+ animals starkly contrast with these previous studies demonstrating that Atg7 deletion in POMC neurons causes increased body weight and adiposity.Citation20-22 Rather, we find that the genetic deletion of either Atg12 or Atg5 in POMC neurons does not promote weight gain or adiposity in mice on a normal diet, despite the fact that these neurons exhibit robust and complete autophagy ablation. Because ATG7 serves as the E1-like enzyme mediating ATG12 conjugation to ATG5, these phenotypic differences suggest that ATG7 function in POMC neurons may be independent of its established role in the formation of the ATG12–ATG5 complex required for autophagy. Although all of these previous studies construed that impaired autophagy in POMC neurons was responsible for increased body weight and adiposity, these conclusions were all drawn from the singular analysis of ATG7. In the absence of any comparisons to other ATGs, these studies would be unable to parse whether these changes in hypothalamic energy balance were due to autophagic versus nonautophagic functions for ATG7 in POMC neurons. Notably, nonautophagic functions have been described for ATG7 similar to ATG12; during nutrient starvation, ATG7 promotes TRP53 (TP53 in humans)/p53-dependent transcription and cell cycle progression independently of its E1-like enzymatic activity.Citation32
Most importantly, our studies provide genetic evidence that ATG12 mediates ATG5-independent, nonautophagic functions in POMC neurons in vivo. In mice fed a HFD, we demonstrate that ATG12 deficiency in POMC neurons exacerbates HFD-induced obesity. Because POMC neuron deficiency in ATG5 does not elicit a similar phenotype, the absence of the ATG12–ATG5 complex in POMC neurons is not responsible for increased body weight gain on HFD. Moreover, the loss of ATG12 and ATG5 both cause robust SQSTM1 and ubiquitin accumulation in POMC neurons, indicating that these cells exhibit complete autophagy deficiency. Taken together, we conclude that the effects of ATG12 deficiency on HFD-induced obesity are not due to the lack of autophagy or the absence of the ATG12–ATG5 complex; rather, ATG12 mediates autophagy-independent functions in POMC neurons that counteract excessive weight gain in response to HFD consumption.
In addition to ATG5, other conjugation targets for ATG12 have been described.Citation11 Although a currently unidentified ATG12 conjugation target may be functionally significant in POMC neurons, it is important to recognize that ATG7 is the only known E1-like enzyme mediating these ATG12 conjugation events.Citation11 Hence, the discordant phenotypes observed upon Atg12 vs. Atg7 deletion in POMC neurons in vivo argue against this possibility. Alternatively, one can hypothesize that unconjugated ATG12 regulates POMC neuronal function. To date, the best-characterized function of free ATG12 is its ability to promote apoptosis in response to diverse stimuli.Citation12 However, since we do not observe significant apoptosis in POMC neurons in control animals, even when mice are challenged with a HFD, it is unlikely that free ATG12 promotes apoptosis in this hypothalamic neuron population. Overall, elaborating the larger repertoire of biological functions mediated by ATG12, both conjugation dependent and independent, remains an important topic deserving further scrutiny. With the increasing recognition that individual autophagy-related proteins possess nonautophagic functions,Citation9,10 our studies underscore the importance of genetically interrogating multiple ATGs in order to validate whether a phenotype arises from a general deficit in macroautophagy versus the specific absence of an individual ATG.
Materials and Methods
Animals
The generation of complete Atg12 knockout mice (atg12-/-) and conditional (Atg12f/f) mice is described in the supplemental methods. Atg12f/f animals were backcrossed for 5 generations onto the C57Bl/6 background and then interbred with Pomc-Cre miceCitation33 to delete Atg12 in POMC neurons. Atg5f/f mice (C57Bl/6) from Noboru Mizushima (University of Tokyo, Japan) Citation6 were interbred with Pomc-Cre mice (C57Bl/6). R26-LSL-tdRFP mice,Citation19 kindly obtained from Hans Joerg Fehling (Ulm University, Germany), were used to confirm the Cre-mediated recombination of either Atg12 or Atg5 in POMC neurons. PCR-based microsatellite genotyping was performed in the UCSF Genomics Core to verify equivalent genetic C57Bl/6 purity among strains utilized for this study. Animals were fed either normal chow (21.6% kcal from fat; Purina mouse diet, #5058) ad libitum or transitioned to a HFD (60% kcal from fat, Research Diets, D12492) at 4 wk of age. Mice were weighed weekly, and age-matched littermates were used for all experiments. All experiments were carried out under a protocol approved by the UCSF Institutional Animal Care and Use Committee.
Cell culture
Dr. Noburu Mizushima (Tokyo University) generously provided Atg5+/+ and atg5-/- MEFs (SV40Tag immortalized) and Dr. Masaaki Komatsu (Tokyo Metropolitan Institute of Medical Science) generously provided Atg7+/+ and atg7-/- MEFs (SV40Tag immortalized). All MEFs were cultured in DMEM (Invitrogen, 11965118) supplemented with 10% fetal bovine serum (Atlas Biologicals, FP-0500-A), penicillin, and streptomycin (UCSF Cell Culture Facility, CCFGK004). When indicated, cells were nutrient starved for 3 h in HBSS (UCSF Cell Culture Facility, CCFJ002); for assays to assess LC3-II turnover in the lysosome, cells were treated with 10 nM bafilomycin A1 (BafA, Sigma, B1793).
Body composition and metabolic studies
Lean and fat mass were determined using dual energy X-ray absorptiometry (DEXA) using a PIXImus II (Lunar Corp.) as previously described.Citation34 To measure food intake, locomotor activity, oxygen consumption (VO2) and carbon dioxide elimination (VCO2), singly housed mice were analyzed using CLAMS (Comprehensive Lab Animal Monitoring System, Columbus Instruments) in the UCSF DERC Mouse Metabolism Core. For each CLAMS experiment, Atg12ckoPomc-Cre+ or Atg5ckoPomc-Cre+ mice were directly compared to their respective wild-type littermate controls.
Quantitative RT-PCR
Hypothalami were microdissected, RNA was extracted, reverse-transcribed and PCR amplified (Step One Plus System, Applied Biosystems, 437660) using TaqMan® gene expression assays (Atg12: Mm00503201_m1; Atg5: Mm00504340_m1; POMC: Mm00435874_m1, AGRP: Mm00475829_g1; NPY: Mm00445771_m1) and Universal PCR Master Mix (Applied Biosystems, 4304437). ACTB (β-actin, Mm00607939_s1) was used to normalize expression.
Immunohistochemistry
Mice were transcardially perfused with 4% (w/v) paraformaldehyde (Electron Microscopy Sciences, 15710-S) in phosphate-buffered saline (PBS; UCSF Cell Culture Facility, CCFAL001); brains were removed, post-fixed (4% w/v paraformaldehyde), infiltrated with 30% (w/v) sucrose (Fisher Scientific, BP220) in PBS as 4°C overnight. Brains were cryosectioned (10-μm thick) and immunostained with the following antibodies: POMC/ACTH (National Hormone & Peptide Program, AB1-ACTH), SQSTM1/p62 (Progen, GP62-C), pSTAT3 (Cell Signaling Technology, 9131), ubiquitin (DAKO, Z0458), RFP (Abcam, ab62341) or cleaved-CASP3 (Cell Signaling Technology, 9669).
Immunofluorescence
Coronal brain sections (10 μm) were incubated sequentially for 10 min each in 0.3% (wt/vol) glycine (Sigma-Aldrich, G8898) and 0.3% (wt/vol) SDS (Sigma-Aldrich, L4390). Sections were incubated with primary antibody overnight at 4°C, washed, and incubated for 1 h at room temperature with Alexa Fluor-conjugated secondary antibodies (1:200; Invitrogen, A11008, A21042, A11073). Fluorescence images were captured using the using the 63X (1.4 NA) objective of a Zeiss Axiovert 200 microscope equipped with a mercury lamp (Carl Zeiss Microscopy GmbH, Gottingen, Germany) and a Spot RT camera (Diagnostics Instruments, Michigan, USA); images were acquired using Metamorph (v6.0) software (Molecular Devices, Sunnyvale, CA).
Immunoblotting
Cells were lysed in RIPA (1% Triton X-100 (Sigma, T8787), 1% sodium deoxycholate (Sigma D6750), 0.1% SDS (Sigma, L6026), 25 mM Tris, pH 7.6, 150 mM NaCl, 10 mM NaF (Sigma, RPS6776), 10 mM β-glycerophosphate (Sigma, G9422), 1 mM Na3VO3 (Sigma, G9422), 10 nM calyculin A (Sigma, C5552), and protease inhibitors cocktail (Sigma, P8340)). Lysates were cleared by centrifugation for 15 min at 4°C, boiled in sample buffer, resolved using SDS-PAGE, and transferred to PVDF membrane (Bio-Rad, 162–0177). The membranes were blocked, incubated with the primary antibodies indicated overnight at 4°C, washed, incubated with HRP-conjugated secondary antibodies (Fisher Scientific, NC9832458; Fisher Scientific, NC9889490; Jackson ImmunoResearch Laboratories, 711–035–152), and analyzed by enhanced chemiluminescence (ECL, Pierce PI-32109). The anti-LC3 antibody generated in our laboratory has been described previously and is now commercially available (EMD Millipore, ABC232).Citation35 Other antibodies used for immunoblotting include: SQSTM1 (Progen, GP62-C), NBR1 (Novus, NBP1–71703), ATG12 (Cell Signaling Technology, 4180), ATG5 (Novus, NB110–53818), TUBA (Sigma, T6199) and GAPDH (Santa Cruz Biotechnology, sc-137179).
In situ hybridization (ISH)
ISH was performed on 10-μm paraffin sections of E13.5 and E18.5 embryos with digoxigenin-labeled probes as described.Citation36
Glucose and insulin tolerance tests
For glucose tolerance tests, mice were fasted for 4 h and injected intraperitoneally with glucose (Sigma, G8270) (2.5 g/kg). For insulin-tolerance tests, mice were fasted for 2 h, and intraperitoneally injected with insulin (0.75 U/kg, Novolin R, NDC 00169183311). Blood glucose was measured with a glucometer (Abbott Diabetes Care, Freestyle Meter, TSI70920A) at the indicated times.
Blood collection for corticosterone EIA
Plasma corticosterone concentrations were measured from blood samples collected in the morning (approximate time of circadian trough) from the tail vein; blood samples were collected within 30 sec of the cage being opened to reduce the possibility of stress-induced corticosterone secretion. Plasma corticosterone concentrations were measured using EIA kit (Cayman Chemical, NC9181635).
Statistics
The Student t test was used for pairwise comparisons and ANOVA followed by post hoc tests was use for 3 groups or more. For growth curves, repeated-measures ANOVA was used. Data are expressed as mean ± SEM and P < 0.05 was used as a cut-off for statistical significance.
Disclosure of Potential Conflicts of Interest
No potential conflicts of interest were disclosed.
Supplemental Material
Supplemental data for this article can be accessed on the publisher's website.
SupplementalFigures.zip
Download Zip (5.8 MB)Acknowledgments
We thank Dr. Noboru Mizushima (University of Tokyo) for providing Atg5f/f mice and Atg5+/+ and atg5-/- MEFs, Dr. Masaaki Komatsu (Tokyo Metropolitan Institute of Medical Science) for providing Atg7+/+ and atg7-/- MEFs, Drs. Hans Fehling (Ulm University, Germany) for providing R26-LSL-tdRFP mice, Dr. Ophir Klein (UCSF) for help with in situ hybridization, members of the Debnath and Xu laboratories for helpful suggestions, Fanya Roskter for assistance with animal husbandry, and Dr. Christophe Paillart (UCSF) for assistance with CLAMS experiments.
Funding
Grant support includes a PBBR/Sanofi LIFFT New Frontiers Award (JD and AWX), Culpeper Scholar Award from Partnership for Cures (JD), NIH R01CA126792 (JD), and the NIH DERC Center Grant P30 DK063720.
References
- Murrow L, Debnath J. Autophagy as a stress-response and quality-control mechanism: implications for cell injury and human disease. Annu Rev Pathol 2013; 8:105-37; PMID:23072311; http://dx.doi.org/10.1146/annurev-pathol-020712-163918
- Mizushima N, Noda T, Yoshimori T, Tanaka Y, Ishii T, George MD, Klionsky DJ, Ohsumi M, Ohsumi Y. A protein conjugation system essential for autophagy. Nature 1998; 395:395-8; PMID:9759731; http://dx.doi.org/10.1038/26506
- Ichimura Y, Kirisako T, Takao T, Satomi Y, Shimonishi Y, Ishihara N, Mizushima N, Tanida I, Kominami E, Ohsumi M, et al. A ubiquitin-like system mediates protein lipidation. Nature 2000; 408:488-92; PMID:11100732; http://dx.doi.org/10.1038/35044114
- Fujita N, Itoh T, Fukuda M, Noda T, Yoshimori T. The Atg16L Complex Specifies the Site of LC3 Lipidation for Membrane Biogenesis in Autophagy. Mol Biol Cell 2008; 19:2092-100; PMID:18321988; http://dx.doi.org/10.1091/mbc.E07-12-1257
- Hanada T, Noda NN, Satomi Y, Ichimura Y, Fujioka Y, Takao T, Inagaki F, Ohsumi Y. The Atg12-Atg5 conjugate has a novel E3-like activity for protein lipidation in autophagy. J Biol Chem 2007; 282:37298-302; PMID:17986448; http://dx.doi.org/10.1074/jbc.C700195200
- Kuma A, Hatano M, Matsui M, Yamamoto A, Nakaya H, Yoshimori T, Ohsumi Y, Tokuhisa T, Mizushima N. The role of autophagy during the early neonatal starvation period. Nature 2004; 432:1032-6; PMID:15525940; http://dx.doi.org/10.1038/nature03029
- Komatsu M, Waguri S, Ueno T, Iwata J, Murata S, Tanida I, Ezaki J, Mizushima N, Ohsumi Y, Uchiyama Y, et al. Impairment of starvation-induced and constitutive autophagy in Atg7-deficient mice. J Cell Biol 2005; 169:425-34; PMID:15866887; http://dx.doi.org/10.1083/jcb.200412022
- Sou YS, Waguri S, Iwata J, Ueno T, Fujimura T, Hara T, Sawada N, Yamada A, Mizushima N, Uchiyama Y, et al. The Atg8 conjugation system is indispensable for proper development of autophagic isolation membranes in mice. Mol BiolCell 2008; 19:4762-75; PMID:18768753; http://dx.doi.org/10.1091/mbc.E08-03-0309
- Bestebroer J, V'Kovski P, Mauthe M, Reggiori F. Hidden behind autophagy: the unconventional roles of ATG proteins. Traffic 2013; 14(10):1029-41; PMID:23837619; ; http://dx.doi.org/10.1111/tra.12091
- Subramani S, Malhotra V. Non-autophagic roles of autophagy-related proteins. EMBO Rep 2013; 14:143-51; PMID:23337627; http://dx.doi.org/10.1038/embor.2012.220
- Radoshevich L, Murrow L, Chen N, Fernandez E, Roy S, Fung C, Debnath J. ATG12 conjugation to ATG3 regulates mitochondrial homeostasis and cell death. Cell 2010; 142:590-600; PMID:20723759; http://dx.doi.org/10.1016/j.cell.2010.07.018
- Rubinstein AD, Eisenstein M, Ber Y, Bialik S, Kimchi A. The autophagy protein Atg12 associates with antiapoptotic Bcl-2 family members to promote mitochondrial apoptosis. Mol Cell 2011; 44:698-709; PMID:22152474; http://dx.doi.org/10.1016/j.molcel.2011.10.014
- Xie Z, Klionsky DJ. Autophagosome formation: core machinery and adaptations. Nat Cell Biol 2007; 9:1102-9; PMID:17909521; http://dx.doi.org/10.1038/ncb1007-1102
- Cowley MA, Smart JL, Rubinstein M, Cerdan MG, Diano S, Horvath TL, Cone RD, Low MJ. Leptin activates anorexigenic POMC neurons through a neural network in the arcuate nucleus. Nature 2001; 411:480-4; PMID:11373681; http://dx.doi.org/10.1038/35078085
- Simpson KA, Martin NM, Bloom SR. Hypothalamic regulation of food intake and clinical therapeutic applications. Arq BrasEndocrinolMetabol 2009; 53:120-8; PMID:19466203; http://dx.doi.org/10.1590/S0004-27302009000200002
- Xu AW, Ste-Marie L, Kaelin CB, Barsh GS. Inactivation of signal transducer and activator of transcription 3 in proopiomelanocortin (Pomc) neurons causes decreased pomc expression, mild obesity, and defects in compensatory refeeding. Endocrinology 2007; 148:72-80; PMID:17023536; http://dx.doi.org/10.1210/en.2006-1119
- Barsh GS, Schwartz MW. Genetic approaches to studying energy balance: perception and integration. Nat Rev Genet 2002; 3:589-600; PMID:12154382; http://dx.doi.org/10.1038/nrn902
- Lewandoski M, Wassarman KM, Martin GR. Zp3-cre, a transgenic mouse line for the activation or inactivation of loxP-flanked target genes specifically in the female germ line. Curr Biol 1997; 7:148-51; PMID:9016703; http://dx.doi.org/10.1016/S0960-9822(06)00059-5
- Luche H, Weber O, Nageswara Rao T, Blum C, Fehling HJ. Faithful activation of an extra-bright red fluorescent protein in "knock-in" Cre-reporter mice ideally suited for lineage tracing studies. Eur J Immunol 2007; 37:43-53; PMID:17171761; http://dx.doi.org/10.1002/eji.200636745
- Coupe B, Ishii Y, Dietrich MO, Komatsu M, Horvath TL, Bouret SG. Loss of autophagy in pro-opiomelanocortin neurons perturbs axon growth and causes metabolic dysregulation. Cell Metab 2012; 15:247-55; PMID:22285542; http://dx.doi.org/10.1016/j.cmet.2011.12.016
- Kaushik S, Arias E, Kwon H, Lopez NM, Athonvarangkul D, Sahu S, Schwartz GJ, Pessin JE, Singh R. Loss of autophagy in hypothalamic POMC neurons impairs lipolysis. EMBO Rep 2012; 13:258-65; PMID:22249165; http://dx.doi.org/10.1038/embor.2011.260
- Quan W, Kim HK, Moon EY, Kim SS, Choi CS, Komatsu M, Jeong YT, Lee MK, Kim KW, Kim MS, et al. Role of hypothalamic proopiomelanocortin neuron autophagy in the control of appetite and leptin response. Endocrinology 2012; 153:1817-26; PMID:22334718; http://dx.doi.org/10.1210/en.2011-1882
- Yaswen L, Diehl N, Brennan MB, Hochgeschwender U. Obesity in the mouse model of pro-opiomelanocortin deficiency responds to peripheral melanocortin. Nat Med 1999; 5:1066-70; PMID:10470087; http://dx.doi.org/10.1038/12506
- Forbes S, Bui S, Robinson BR, Hochgeschwender U, Brennan MB. Integrated control of appetite and fat metabolism by the leptin-proopiomelanocortin pathway. Proc Natl Acad Sci U S A 2001; 98:4233-7; PMID:11259669; http://dx.doi.org/10.1073/pnas.071054298
- Myers MG, Jr., Leibel RL, Seeley RJ, Schwartz MW. Obesity and leptin resistance: distinguishing cause from effect. Trends Endocrinol Metab 2010; 21:643-51; PMID:20846876; http://dx.doi.org/10.1016/j.tem.2010.08.002
- Bjorbaek C, Uotani S, da Silva B, Flier JS. Divergent signaling capacities of the long and short isoforms of the leptin receptor. J Biol Chem 1997; 272:32686-95; PMID:9405487; http://dx.doi.org/10.1074/jbc.272.51.32686
- Banks AS, Davis SM, Bates SH, Myers MG, Jr. Activation of downstream signals by the long form of the leptin receptor. J Biol Chem 2000; 275:14563-72; PMID:10799542; http://dx.doi.org/10.1074/jbc.275.19.14563
- Schindler C, Darnell JE, Jr. Transcriptional responses to polypeptide ligands: the JAK-STAT pathway. Ann Rev Biochem 1995; 64:621-51; PMID:7574495; http://dx.doi.org/10.1146/annurev.bi.64.070195.003201
- Lin S, Storlien LH, Huang XF. Leptin receptor, NPY, POMC mRNA expression in the diet-induced obese mouse brain. Brain Res 2000; 875:89-95; PMID:10967302; http://dx.doi.org/10.1016/S0006-8993(00)02580-4
- Komatsu M, Waguri S, Chiba T, Murata S, Iwata J, Tanida I, Ueno T, Koike M, Uchiyama Y, Kominami E, et al. Loss of autophagy in the central nervous system causes neurodegeneration in mice. Nature 2006; 441:880-4; PMID:16625205; http://dx.doi.org/10.1038/nature04723
- Hara T, Nakamura K, Matsui M, Yamamoto A, Nakahara Y, Suzuki-Migishima R, Yokoyama M, Mishima K, Saito I, Okano H, et al. Suppression of basal autophagy in neural cells causes neurodegenerative disease in mice. Nature 2006; 441:885-9; PMID:16625204; http://dx.doi.org/10.1038/nature04724
- Lee IH, Kawai Y, Fergusson MM, Rovira, II, Bishop AJ, Motoyama N, Cao L, Finkel T. Atg7 modulates p53 activity to regulate cell cycle and survival during metabolic stress. Science 2012; 336:225-8; PMID:22499945; http://dx.doi.org/10.1126/science.1218395
- Xu AW, Kaelin CB, Takeda K, Akira S, Schwartz MW, Barsh GS. PI3K integrates the action of insulin and leptin on hypothalamic neurons. J Clin Invest 2005; 115:951-8; PMID:15761497; http://dx.doi.org/10.1172/JCI200524301
- Reed AS, Unger EK, Olofsson LE, Piper ML, Myers MG, Jr., Xu AW. Functional role of suppressor of cytokine signaling 3 upregulation in hypothalamic leptin resistance and long-term energy homeostasis. Diabetes 2010; 59:894-906; PMID:20068134; http://dx.doi.org/10.2337/db09-1024
- Fung C, Lock R, Gao S, Salas E, Debnath J. Induction of Autophagy during Extracellular Matrix Detachment Promotes Cell Survival. Mol Biol Cell 2008; 19:797-806; PMID:18094039; http://dx.doi.org/10.1091/mbc.E07-10-1092
- Purcell P, Joo BW, Hu JK, Tran PV, Calicchio ML, O'Connell DJ, Maas RL, Tabin CJ. Temporomandibular joint formation requires two distinct hedgehog-dependent steps. Proc Natl Acad Sci U S A 2009; 106:18297-302; PMID:19815519; http://dx.doi.org/10.1073/pnas.0908836106