
Abstract
Paclitaxel is recommended as a first-line chemotherapeutic agent against ovarian cancer, but drug resistance becomes a major limitation of its success clinically. The key molecule or mechanism associated with paclitaxel resistance in ovarian cancer still remains unclear. Here, we showed that TXNDC17 screened from 356 differentially expressed proteins by LC-MS/MS label-free quantitative proteomics was more highly expressed in paclitaxel-resistant ovarian cancer cells and tissues, and the high expression of TXNDC17 was associated with poorer prognostic factors and exhibited shortened survival in 157 ovarian cancer patients. Moreover, paclitaxel exposure induced upregulation of TXNDC17 and BECN1 expression, increase of autophagosome formation, and autophagic flux that conferred cytoprotection for ovarian cancer cells from paclitaxel. TXNDC17 inhibition by siRNA or enforced overexpression by a pcDNA3.1(+)-TXNDC17 plasmid correspondingly decreased or increased the autophagy response and paclitaxel resistance. Additionally, the downregulation of BECN1 by siRNA attenuated the activation of autophagy and cytoprotection from paclitaxel induced by TXNDC17 overexpression in ovarian cancer cells. Thus, our findings suggest that TXNDC17, through participation of BECN1, induces autophagy and consequently results in paclitaxel resistance in ovarian cancer. TXNDC17 may be a potential predictor or target in ovarian cancer therapeutics.
Abbreviations:
- 95% CI, 95% confidence interval
- ALDOC, aldolase C, fructose-bisphosphate
- ATG5, autophagy-related 5
- BafA1, bafilomycin A1
- BECN1, Beclin 1, autophagy-related
- CNN3, calponin 3, acidic
- DAPI, 4', 6-diamidino-2-phenylindole
- FLNA, filamin A, α
- GenMAPP, gene microarray pathway profiler
- GO, gene ontology
- HBSS, Hank's balanced salt solution
- HR, hazard ratio
- KEGG, Kyoto encyclopedia of genes and genome
- LC-MS/MS, liquid chromatography-mass spectrometry/ mass spectrometry
- MAP1LC3B/LC3B, microtubule-associated protein 1 light chain 3 β
- OS, overall survival
- PFS, progression-free survival
- PGAM1, phosphoglycerate mutase 1 (brain)
- siRNA, short interfering RNA
- SQSTM1, sequestosome 1
- TNF, tumor necrosis factor
- TXN, thioredoxin
- TXNDC17, thioredoxin domain containing 17
- UTP23, small subunit (SSU) processome component, homolog (yeast)
Introduction
Ovarian cancer is the most lethal disease among all gynecological malignancies despite the improvements in surgery and chemotherapy for recent several decades, and the 5-year survival from the disease is only 44%.Citation1 More than 80% of patients with advanced ovarian cancer relapse in 2 or 3 y after the primary therapy.Citation2-4 Sequential treatment strategies are employed to maximize quality and length of life, but the patients eventually become resistant to cytotoxic agents.Citation5 Chemoresistance remains one of the essential reasons for treatment failure and death associated with ovarian cancer.
Paclitaxel is recommended as a first-line chemotherapeutic agent against many cancers including ovarian cancer.Citation6 The emergence of drug resistance is a major limitation of its success clinically. Evidence has shown that paclitaxel resistance is a process with multifactorial participation that may originate through a series of modifications,Citation7 including the overexpression of the multidrug transporter P-glycoprotein that pumps paclitaxel out of tumor cells through an ATP-dependent mechanism,Citation8 the modulation of paclitaxel-induced apoptosis by pro- or antisurvival regulators such as BCL2 family proteins,Citation9,10 the influence of the composition of tubulin isotypes or the changes of microtubule dynamics,Citation11 the appropriate weakening of the spindle checkpoint caused by downregulation of BUB1B,Citation12 and others. However, the progress in reversing paclitaxel resistance is limited according to the possible mechanisms.
To further elucidate a novel potential mechanism of paclitaxel resistance in ovarian cancer, we applied a label-free, quantitative proteomic approach based on liquid chromatography-mass spectrometry/mass spectrometry (LC-MS/MS) to reveal differentially expressed proteins between the ovarian epithelial cancer cell line SKOV3 and SKOV3-TR30 that was developed by exposing SKOV3 cells to increased concentrations of paclitaxel and has shown a more than 27-fold increase in paclitaxel resistance in a previous study.Citation12 We found a substantially elevated expression of TXNDC17 (thioredoxin domain containing 17) in SKOV3-TR30 cells. TXNDC17 is a novel 14-kDa disulfide reductase of the TXN (thioredoxin) family discovered by Jeong W et al. in 2004.Citation13 It possesses 2 active site cysteine residues in its WCPDC motif, which is comparable to the WCGPC motif of TXN identified as the first member of the TXN family.Citation13 The biological function of TXNDC17 is not well understood, but it has been recently found that TXNDC17 is involved in the TNF (tumor necrosis factor) signaling pathway.Citation14 A number of studies have demonstrated a role of TNF in stimulating autophagy in human cells, including macrophages, vascular smooth cells, skeletal muscle cells, T lymphoblastic leukemic cells, Ewing sarcoma cells, and breast cancer cells.Citation15 Thus, there may be a link among TXNDC17 overexpression, autophagy, and paclitaxel resistance in ovarian cancer.
Recent studies have revealed an association between autophagy and drug resistance. Chemotherapy agents, including paclitaxel, may lead to an autophagic response.Citation16,17 Autophagy, which has cytoprotective functions and may also lead to one of the forms of cell death, is an evolutionarily conserved process by which cytoplasmic cargo sequestered inside double-membrane vesicles is delivered to the lysosome for degradation.Citation18 This process not only discards intracellular misfolded or long-lived proteins, superfluous or damaged organelles, and invading microorganisms, but also provides nutrients and energy for cells exposed to various stresses as an adaptive response.Citation19 Thus, the predominant role of autophagy in cancer cells is considered to confer stress tolerance, which is recognized as a cytoprotective process to maintain tumor cell survival.Citation20 However, sustained autophagy may eventually lead to cell death when prolonged stress overwhelms the turnover capacity of cells.Citation21 Thus, anticancer drugs may induce either autophagy-associated cell death or survival, but the mechanisms involved or molecular pathways are cell-type dependent.Citation22,23 However, the role of TXNDC17 in inducing autopahgy and paclitaxel resistance in neoplasms including ovarian cancer has not been reported until now, to our knowledge.
In this study, we first validated the higher level of TXNDC17 and BECN1 (Beclin 1, autophagy-related) expression in chemoresistant ovarian cancer tissues, based on a quantitative proteomics approach between a paclitaxel-resistant and a parental ovarian cancer cell line, and demonstrated a significant association of their high expression with poorer patient survival. Furthermore, we found that paclitaxel exposure induced TXNDC17 upregulation and the autophagic response, and consequently conferred cytoprotection from paclitaxel. Conversely, enforced overexpression or inhibition of TXNDC17 could modulate autophagy through BECN1 participation and change paclitaxel sensitivity in ovarian cancer cells. Thus, our findings suggest that TXNDC17 plays a key role in paclitaxel resistance through induction of autophagy. TXNDC17 may become a potential predictor or target in ovarian cancer therapeutics.
Results
Differential expression of proteins between paclitaxel-sensitive and resistant ovarian cancer cells by proteomic analyses
The cell line SKOV3-TR30 with acquired paclitaxel resistance and its parental SKOV3 served as our model system. LC-MS/MS analyses identified a total of 5016 peptides presented as a 2-dimensional image () and 949 nonredundant peptides (P < 0.05) differentially expressed between SKOV3-TR30 and SKOV3 (Table S1). Those 949 peptides were identified as 560 proteins. In 356 proteins that displayed more than 1.5-fold quantitative alterations between SKOV3-TR30 and SKOV3 (Table S2), 47 were upregulated and 309 were downregulated. Of these, 23 proteins were upregulated by more than 2-fold (maximum 3.8-fold) and 134 downregulated by more than 2-fold (maximum 15.7-fold).
Figure 1. Label-free quantitative proteomic analyses and western blotting validation of differential proteins. (A) 2D feature maps of LC-MS/MS data from one analysis between SKOV3-TR30 and SKOV3. LC-MS/MS data were represented as a 2-dimensional image, where the horizontal axis was a retention time, the vertical axis was a mass-to-charge ratio and the gray color level indicated the intensity value. (B) Classification of differential proteins according to the GO analyses. A total of 260 out of 356 dysregulated proteins were categorized into metabolic process, regulation of biological process, transport, multicellular organismal development, cell differentiation, transcription, etc. (C) Validation of the differential expression of 6 selected proteins. Protein levels of TXNDC17, PGAM1, ALDOC, FLNA, UTP23, and CNN3 were determined by western blotting in paclitaxel-resistant SKOV3-TR30 and A2780-TR cells compared with parental SKOV3 and A2780 cells, respectively. GAPDH was analyzed as the loading control.
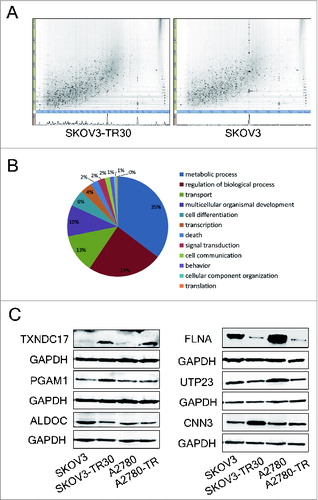
According to data from the GO (gene ontology) database, 260 of 356 dysregulated proteins were categorized into metabolic process (35%), regulation of biological process (24%), transport (13%), multicellular organismal development (10%), cell differentiation (6%), transcription (4%), etc (). The GenMAPP (gene microarray pathway profiler) and the KEGG (Kyoto encyclopedia of genes and genome) pathway analyses showed that these 356 differential proteins were most frequently involved in metabolic pathways, pyruvate metabolism, protein processing in endoplasmic reticulum, regulation of actin cytoskeleton, glycolysis/gluconeogenesis, systemic lupus erythematosus, tight junction, ribosome, etc. (Table S3).
To further confirm the alterations of protein expression revealed by quantitative proteomic analyses, TXNDC17, PGAM1 (phosphoglycerate mutase 1 [brain]), ALDOC (aldolase C, fructose-bisphosphate), FLNA (filamin A, α), UTP23 (small subunit [SSU] processome component, homolog [yeast]) and CNN3 (calponin 3, acidic) were selected for validation by western blotting. TXNDC17 and PGAM1 expression was upregulated while FLNA and UTP23 expression was downregulated in SKOV3-TR30 compared with parental SKOV3. These changes were consistent with quantitative proteomic results. However, the expression of ALDOC and CNN3 was in contrast to quantitative proteomic analyses. Similar results were confirmed between A2780-TR and A2780 cells, except for approximate expression of CNN3 and PGAM1 between A2780-TR and A2780 cells ().
The high expression of TXNDC17 and BECN1 proteins in ovarian cancer tissues is associated with poorer patient prognosis
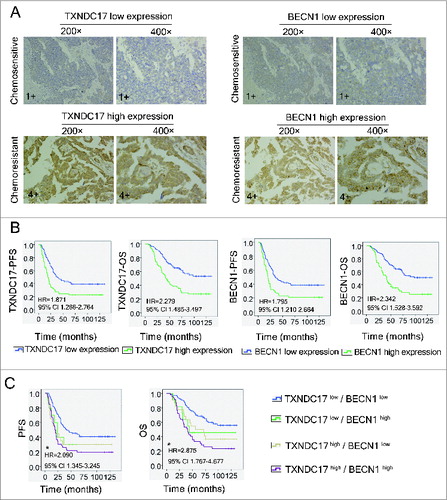
To further confirm the alteration of TXNDC17 expression in ovarian cancer cells by quantitative proteomics and western blotting, we detected TXNDC17 expression in 157 ovarian cancer tissues by immunohistochemical staining. Considering the possible regulating effect of TXNDC17 on cellular autophagy, the expression of BECN1, a key regulator of autophagy,Citation24 was simultaneously detected in 2 serial sections from the same paraffin-embedded block. The staining of TXNDC17 and BECN1 was observed in the cytoplasm (, Fig. S1), and the expression of the 2 proteins was significantly correlated (P = 0.000). As expected, the percentages of high expression of TXNDC17 and BECN1 were 61.8% (21/34 cases) and 52.9% (18/34 cases), respectively, in chemoresistant ovarian cancer tissues, only 35.9% (42/117 cases) and 29.9% (35/117 cases) in chemosensitive tissues (6 patients were excluded due to failure to identify whether or not there was chemoresistance), both differences were significant (P = 0.007 and P = 0.013), as shown in and. Furthermore, TXNDC17 high expression was significantly correlated with higher level of serum MUC16/CA125 (P = 0.017), suboptimal primary surgery (P = 0.010) and chemoresistance (P = 0.007) (). BECN1 high expression was significantly correlated with advanced FIGO stage (P = 0.035), higher level of serum CA125 (P = 0.001), suboptimal primary surgery (P = 0.000), and chemoresistance (P = 0.013), as shown in. Kaplan–Meier survival curves showed that ovarian cancer patients with TXNDC17 high expression exhibited significantly poorer progression-free survival (PFS, P = 0.001) and overall survival (OS, P = 0.000) than patients with TXNDC17 low expression, which was confirmed by univariate Cox regression analysis (HR = 1.871, 95% CI 1.266-2.764 for PFS and HR = 2.279, 95% CI 1.485-3.497 for OS, respectively). The relationships between BECN1 expression and survivals were similar with TXNDC17 (). When patients were divided into 4 groups, TXNDC17high/BECN1high, TXNDC17high/BECN1low, TXNDC17low/BECN1high, and TXNDC17low/BECN1low, patients with TXNDC17high/BECN1high displayed the shortest survival in ovarian cancer patients (). But multivariate analysis revealed that TXNDC17 expression, not BECN1, was an independent prognostic factor for PFS (P = 0.029), but both not for OS (Table S4). Our results suggest that there may be a link among TXNDC17, paclitaxel sensitivity, and autophagy in ovarian cancer.
Table 1. The association of TXNDC17 expression with clinicopathological parameters and BECN1 expression
Table 2. The relationship between BECN1 expression and clinicopathological parameters
Figure 2. Immunohistochemistry of TXNDC17 and BECN1 expression and patient prognosis and survival analysis. (A) Two serial sections from the same paraffin-embedded block from 157 ovarian cancer patients were used for detection using anti-TXNDC17 and anti-BECN1 antibodies, respectively. Representative TXNDC17 and BECN1 staining from a chemoresistant (4+) and a chemosensitive (1+) tissue is shown at 200× and 400× magnifications. (B) Kaplan–Meier survival curves for PFS and OS in ovarian cancer patients with different TXNDC17 and BECN1 protein levels. HR and 95% CI were measured by univariate Cox regression analysis. (C) Combined analysis of TXNDC17 and BECN1 expression in the prognostic value of patients with ovarian cancer by Kaplan–Meier survival curves. *, TXNDC17high/BECN1high VS TXNDC17low/BECN1low.
Paclitaxel induces upregulation of TXNDC17 and autophagy in ovarian cancer cells
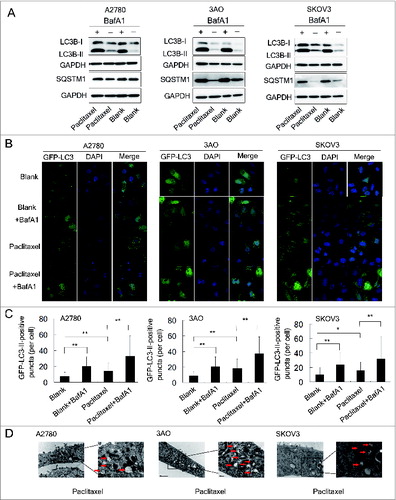
A2780, 3AO, and SKOV3 cells were exposed to paclitaxel at different concentrations (2, 5 and 10 nM) and times (3, 6, 12, 24, and 48 h). The amount of TXNDC17 protein was found to be substantially increased after 12, 24, and 48-hour exposures to paclitaxel at various concentrations in 3 cell lines, except for the conditions in which A2780 cells were treated with 2 nM and 5 nM paclitaxel for 12 h. Moreover, paclitaxel also synchronously induced upregulation of BECN1, and accumulation of the protein levels of the cleaved and lipidated form of MAP1LC3B-II/LC3B-II (microtubule-associated protein 1 light chain 3 β) and ATG5 (autophagy-related 5), which were observed along with TXNDC17 upregulation (). Autophagic flux was also measured by assessing LC3B-II turnover and SQSTM1 (sequestosome 1) degradation by western blotting in the presence or absence of BafA1 (bafilomycin A1), a vacuolar H+/ATPase inhibitor that blocks lysosomal degradation.Citation25 In cells exposed to paclitaxel, LC3B-II was increased and further accumulated after BafA1 treatment and SQSTM1 was decreased but increased after BafA1 treatment, suggesting an increase of autophagic flux after paclitaxel treatment in ovarian cancer cells (). In line with these observations, the numbers of GFP-LC3-II-positive puncta in ovarian cancer cells, after 24-h exposure to 10 nM paclitaxel, were significantly increased compared with the blank control, and more appreciably accumulated after BafA1 treatment (). These observations were independently validated using transmission electron microscopy (). Thus, our findings suggest that paclitaxel induces upregulation of TXNDC17 and increases autophagosome formation and autophagy flux in ovarian cancer cells.
Figure 3. Paclitaxel exposure upregulates the expression of TXNDC17 and autophagic proteins. A2780 (A), 3AO (B), and SKOV3 (C) cells were plated in 6-well plates overnight and reached 60% to 70% confluence when paclitaxel was added in the complete medium at final concentration 2, 5, and 10 nM. Total cell lysates were extracted after 3, 6, 12, 24, and 48 h of paclitaxel treatment. Protein levels of LC3B, ATG5, BECN1, and TXNDC17 were detected by western blotting. Cells without paclitaxel treatment were assigned as blank control (Blank). GAPDH was analyzed as the loading control. Data are representative of 3 independent experiments.
Figure 4 (See previous page). Paclitaxel increases autophagosome formation and autophagic flux. (A) A2780, 3AO, and SKOV3 cells were treated with 10 nM paclitaxel with and without 10 nM BafA1 for 24 h and the protein levels of LC3B and SQSTM1 were assessed by western blotting. Cells without paclitaxel treatment with and without 10 nM BafA1 were assigned as controls (Blank and Blank+BafA1). GAPDH was assigned as the loading control. Data are representative of 3 independent experiments. (B) A2780, 3AO and SKOV3 cells were transfected with the GFP-LC3-plasmid overnight and transferred on the coverslips. After a 24-h exposure to 10 nM paclitaxel with and without 10 nM BafA1, representative images of GFP-LC3-II-positive puncta were photographed with a confocal fluorescence microscope. Cells without paclitaxel treatment with and without 10 nM BafA1 were assigned as controls (Blank and Blank+BafA1). DAPI: staining for the nuclei. (C) The number of GFP-LC3-II-positive puncta in 50 GFP-positive cells for each group was counted using the Metamoph offline 7.7.8.0 software package and the GFP-LC3-II-positive puncta per cell were calculated. Three independent experiments were performed and the values were expressed as the mean ± SD, * P < 0.05, ** P < 0.01. (D) Autophagosome and autolysosome vesicles of A2780, 3AO and SKOV3 cells treated with 10 nM paclitaxel for 24 h were visualized by transmission electron microscopy. The typical images of autophagosomes and autolysosomes (red arrows) are shown at high magnification.
TXNDC17 modulates paclitaxel sensitivity and autophagy through BECN1 participation
We further examined the effects of altered TXNDC17 expression on paclitaxel sensitivity in A2780 and 3AO cells. We found that TXNDC17 knockdown by specific siRNA (short interfering RNA) significantly increased the sensitivity to paclitaxel in A2780 and 3AO cells (). And reversely, TXNDC17 overexpression by transfection with a pcDNA3.1(+)-TXNDC17 plasmid, conferred protection from paclitaxel for ovarian cancer cells (). Considering the high expression of both TXNDC17 and BECN1 in chemoresistant ovarian cancer tissues and synchronous upregulation of TXNDC17 and BECN1 after paclitaxel exposure, we further examined whether BECN1 influenced the paclitaxel sensitivity modulated by TXNDC17. After TXNDC17 was overexpressed and selected by G418 for 10 d, A2780 and 3AO cells were transfected with siRNA specific to BECN1. The cytoprotection due to TXNDC17 overexpression was reversed by BECN1 knockdown (). Our findings indicate that TXNDC17 modulates paclitaxel sensitivity at least partially through BECN1 participation.
Figure 5. TXNDC17 modulates paclitaxel sensitivity. (A and B) A2780 and 3AO cells were transfected with TXNDC17-specific siRNA (line +) or scrambled siRNA (line NC); (C and D) A2780 and 3AO cells were transfected with a pcDNA3.1(+)-TXNDC17 (line +) or pcDNA3.1(+) (line Mock) plasmid; (E and F) A2780 and 3AO cells were transfected with BECN1-specific siRNA (line +) or scrambled siRNA (line NC) after transfection with pcDNA3.1(+)-TXNDC17 and selection with G418 (400 μg/mL) for 10 d, then the cells were seeded in 96-well plates and exposed to paclitaxel at various final concentrations for 24 h. Cell viability was measured by CCK-8 kit after 48 h. Data are representative of 3 independent experiments and are expressed as the means ± SD.** P < 0.01, * P < 0.05.
We then assessed TXNDC17 regulation to autophagy. showed that BECN1 was decreased when TXNDC17 was knocked down and increased when TXNDC17 was overexpressed in ovarian cancer cells. Synchronously, LC3B-II protein level and SQSTM1 degradation were decreased when TXNDC17 was knocked down, and reversely, increased when TXNDC17 was overexpressed in the conditions of complete medium, starvation and 10 nM paclitaxel exposure, and were further accumulated by BafA1 treatment (). Moreover, the autophagic response was blocked in the context of TXNDC17 overexpression and BECN1 knockdown (). Our findings suggest that TXNDC17 activates autophagy at least partially through participation of BECN1.
Figure 6. TXNDC17 regulates BECN1 expression and autophagy. (A) A2780 and 3AO cells were transfected with TXNDC17-specific siRNA (line +) or scrambled siRNA (line NC), (B) A2780 and 3AO cells were transfected with a pcDNA3.1(+)-TXNDC17 (line +) or pcDNA3.1(+) (line Mock) plasmid, then TXNDC17 and BECN1 were assessed by western blotting. (C) For TXNDC17 knockdown or (D) TXNDC17 overexpression A2780 and 3AO cells were cultured in complete medium, or starved with HBSS (4 h for A2780, 2 h for 3AO), or treated with 10 nM paclitaxel with and without 10 nM BafA1. Total cell lysates were collected 48 h after transfection. Protein levels of LC3B and SQSTM1 were determined by western blotting. GAPDH was measured as the loading control. Data are representative of 3 independent experiments. (E) A2780 and 3AO cells were transfected with pcDNA3.1(+)-TXNDC17 and selected with G418 (400 μg/mL) for 10 d, then were transfected with BECN1-specific siRNA (line +) or scrambled siRNA (line NC). Protein levels of LC3B, SQSTM1, and BECN1 were detected by western blotting after the cells were treated with starvation and paclitaxel as previously described. GAPDH was measured as the loading control. Data are representative of 3 independent experiments.
Abrogation of BECN1 inhibits autophagy and potentiates paclitaxel cytotoxicity
Because paclitaxel could induce autophagy, we then evaluated autophagy protection from paclitaxel cytotoxicity in ovarian cancer cells. After BECN1 knockdown by siRNA, LC3-II accumulation and SQSTM1 degradation were reduced in the conditions of complete medium, starvation and 10 nM paclitaxel exposure (), but the protein level of TXNDC17 remained unchanged (), indicating that BECN1 knockdown inhibits autophagy but does not regulate TXNDC17. Consistent with the inhibition of autophagy, the cytotoxic effect of paclitaxel was significantly increased by BECN1 knockdown compared with the negative control that was transfected with scrambled siRNA ().
Figure 7. Abrogation of BECN1 inhibits autophagy and potentiates paclitaxel cytotoxicity. (A) A2780 and 3AO cells were transfected with BECN1-specific siRNA (line +) or scrambled siRNA (line NC), then were cultured in complete medium, or starved with HBSS (4 h for A2780, 2 h for 3AO), or treated with 10 nM paclitaxel with and without 10 nM BafA1. Whole cell extracts were collected 48 h after siRNA transfection. Protein levels of LC3B and SQSTM1 were determined by western blotting. GAPDH was measured as the loading control. Data were representative of 3 independent experiments. (B) The protein levels of TXNDC17 and BECN1 were detected by western blotting in A2780 and 3AO cells after BECN1 knockdown. (C) A2780 and 3AO cells transfected with BECN1-specific siRNA (line +) or scrambled siRNA (line NC) were seeded in 96-well plates and exposed to paclitaxel at various final concentrations (0, 2, 5, 10, 20, 50 nM; 3 wells for each concentration) for 24 h. Cell viability was measured by CCK-8 kit after 48 h. Data are representative of 3 independent experiments and are expressed as the means ± SD. ** P < 0.01, * P < 0.05.
Discussion
The exploration of pivotal molecules involving drug sensitivity is an essential approach to reverse chemoresistance in cancers, but the key molecule or mechanism associated with chemoresistance in ovarian cancer still remains to be elucidated. Comparative or quantitative proteomic analyses provide a way to identify proteins involving drug resistance and the insight into the complex mechanisms in ovarian cancer. Various numbers of differentially expressed proteins have been previously identified based on paclitaxel-resistant and sensitive-cell modelsCitation26,27 or chemoresistant and chemosensitive tissues from ovarian cancer patientsCitation28 by different proteomic techniques, such as 2-dimensional electrophoresis (2DE) or difference gel electrophoresis (DIGE) coupled with mass spectrometry, and isotope-coded affinity tags (ICAT) labeling combined with LC-MS proteomic analyses. In the present study, we identified 356 proteins differentially expressed at a 1.5-fold or higher intensity between a paclitaxel-resistant SKOV3-TR30 and a paclitaxel-sensitive SKOV3 cell line using LC-MS/MS label-free quantitative proteomic analyses with spectral counting strategy. Of the 47 upregulated proteins, TXNDC17 was upregulated a 2.86-fold intensity and correspondingly validated by western blotting in paired SKOV3-TR30 vs. SKOV3 and A2780-TR vs. A2780 cells. To confirm the role of TXNDC17 in ovarian cancer chemoresistance, we further detected the expression of TXNDC17 in ovarian cancer tissues by immunohistochemical staining. We found for the first time that the expression of TXNDC17 was significantly increased in chemoresistant tissues compared with chemosensitive tissues. Moreover, our clinical analyses revealed that high expression of TXNDC17 was remarkably correlated to poorer prognostic factors such as higher level of serum CA125 and suboptimal primary surgery, and patients with high TXNDC17 expression exhibited poorer PFS and OS than those with low TXNDC17 expression and acted as an independent predictor for PFS revealed by multivariate analysis. Our findings imply a link between TXNDC17 and paclitaxel resistance. Thus, we further examined the influence of paclitaxel on TXNDC17 expression and found an accumulation of TXNDC17 protein when ovarian cancer cells were exposed to paclitaxel at different concentrations. Moreover, we found that paclitaxel sensitivity was increased when TXNDC17 was substantially suppressed by siRNA, and contrarily, attenuated when TXNDC17 was overexpressed through a pcDNA3.1(+)-TXNDC17 plasmid. Our results suggest that paclitaxel may induce acquired paclitaxel resistance through upregulation of TXNDC17 expression in ovarian cancer cells, and this consequently results in poorer prognosis of the patients.
TXNDC17 is a ubiquitous cytosolic protein expressed in mammalian tissues, being most abundant in the kidney, uterus, pancreas, and liver.Citation29 Although the function of TXNDC17 remains unclear up to date, it has recently been found to be involved in TNF signaling pathway,Citation14 a stimulating pathway for cellular autophagy. To determine whether autophagy participates in TXNDC17-induced paclitaxel resistance, we initially examined the association of the expression between TXNDC17 and BECN1, a key regulator of autophagy, and observed a significantly positive correlation between TXNDC17 and BECN1 expression in ovarian cancer tissues, and further found that BECN1 high expression was also correlated with poorer prognosis of ovarian cancer patients just as was the case with TXNDC17. Moreover, we found that patients with TXNDC17high/BECN1high displayed the shortest survival in ovarian cancer patients. However, it has been reported by Lin et al. that decreased BECN1 expression is correlated with shortened survival in ovarian cancer patients,Citation30 which is in contrast with our data. The reason is unclear, but the proportion of patients with Grade 3 (23.7%, 40/169 cases) was lower in Lin's report than those in our series (63.1%, 99/157 cases). It has been well known that high-grade ovarian cancer possesses quite different biological and clinical features compared with the low-grade variety.Citation31 It may be possible that BECN1 shows different clinical significance in ovarian cancer with different histological grades. Similar inconsistent results about BECN1 expression were observed in other cancers. For instance, BECN1 expression was increased in gastric and colorectal cancer tissues compared with their normal epithelia,Citation32 but high BECN1 expression was associated with favorable prognosis in advanced colon cancer patients.Citation33
Based on clinical data of connection between TXNDC17 and BECN1, we then evaluated the role of TXNDC17 in inducing autophagy of ovarian cancer cells. As expected, the manipulation of TXNDC17 by siRNA and an overexpression plasmid led to autophagy suppression and activation in ovarian cancer cells, respectively. Moreover, BECN1 knockdown attenuated the activation of autophagy and the cytoprotection from paclitaxel induced by TXNDC17 overexpression, suggesting that BECN1 may participate in TXNDC17-induced autophagy and paclitaxel resistance in ovarian cancer cells.
Autophagy can also lead to what is called type II programmed (autophagic) cell death. Excessive or sustained autophagy possesses the potential to induce cell death,Citation34,35 but appropriate activation of autophagy confers stress tolerance and maintains cell survival. Previous studies have shown that various anticancer drugs can induce an autophagic response in cancer cells, which is regarded as a chemoresistant mechanism, and selective inhibition of autophagy regulators has the potential to improve the chemotherapeutic response.Citation36-38 For instance, a paclitaxel-elicited autophagic response could protect cells from eventual death and inhibition of autophagy could potentiate cell death in A549 lung caner cells.Citation16,17 In our study, paclitaxel increased autophagosome formation and autophagic flux in ovarian cancer cells. Conversely, autophagy inhibition by knockdown of BECN1 with siRNA significantly increased paclitaxel cytotoxicity in ovarian cancer cells. Thus, our findings indicate that autophagy augmentation induced by paclitaxel may be one of the mechanisms of acquired drug resistance in ovarian cancer cells. However, the thresholds of autophagy that paclitaxel activates or inhibits may be changed in different cancer cell types.Citation39 A previous study reports that autophagy is inhibited by paclitaxel in the MCF-7 and SK-BR-3 breast carcinoma cell lines.Citation40
Although a positive correlation between TXNDC17 and BECN1 expression was seen in ovarian cancer tissues, together with the synchronous regulation of TXNDC17 and BECN1 expression and autophagy, as well as the BECN1 knockdown-eliminated induction of autophagy and cytoprotection from paclitaxel due to TXNDC17 overexpression, we still have no direct evidence of a link between TXNDC17 and BECN1. It has been considered that BECN1 contributes to autophagosome formation via the recruitment of other autophagy-related proteins on the basis of BECN1 and the class III phosphatidylinositol 3-kinase (PtdIns3K) complex,Citation41 and plays a central role in autophagy consequently.Citation24 Recent studies have shown that BECN1 expression is regulated by several transcription factors including NFKB1, FOXO3, HIF1A, JUN, and E2F1.Citation42 TXNDC17 as a novel disulfide reductase catalyzes the reduction of oxidized DYNLL1 (dynein, light chain, LC8-type 1), which is the only identified potential substrate of TXNDC17 until now, and DYNLL1 binds the NFKB1 inhibitor NFKBIA in a redox-dependent manner switching on or off the activation of NFKB1.Citation43 In addition, the NFKB1 family member RELA upregulates BECN1 mRNA and protein levels in different cellular systems through activation of a conserved NFKB1 binding site in the promoter of the BECN1 gene.Citation44 Thus, we speculate that TXNDC17 modulates BECN1 probably through NFKB1 or other pathways in paclitaxel-induced autophagy of ovarian cancer cells, but further study is needed.
In summary, TXNDC17 is more highly expressed in chemoresistant ovarian cancer cells and tissues, and high TXNDC17 expression is associated with poorer prognosis of ovarian cancer patients. Paclitaxel induces TXNDC17 upregulation and an autophagic response in ovarian cancer cells, and the knockdown of TXNDC17, through BECN1 participation, eliminates autophagy and consequently promotes the sensitivity of ovarian cancer cells to paclitaxel. Our findings suggest that TXNDC17 acts as an autophagy and chemoresistence promoter and may be potentially used as a predictor for prognosis or a therapeutic target for reserving paclitaxel resistance in ovarian cancer patients.
Materials and Methods
Reagents and cell culture
Paclitaxel was purchased from Bristol-Myers Squibb Pharmaceuticals Ltd. Primary antibodies to TXNDC17 (ab121725), PGAM1 (ab55613), UTP23 (ab103862), and CNN3 (ab91264) were purchased from Abcam. Antibodies to SQSTM1 (5114), ATG5 (8540) and BECN1 (3495, for western blotting only) were obtained from Cell Signaling Technology. Anti-FLNA (sc-17749) and anti-ALDOC (sc-30084) were obtained from Santa Cruz Biotechnology. HRP-labeled secondary anti-mouse (115-035-003) and anti-rabbit (111-035-003) antibodies were purchased from Jackson Immunoresearch Laboratories. Anti-LC3B (L7543) and anti-glyceraldehyde-3-phosphate dehydrogenase (GAPDH, mab5465) were acquired from Sigma-Aldrich and Lianke Biotechnology, respectively.
Human ovarian cancer cell line A2780 and SKOV3 were obtained from the American Type Culture Collection (ATCC, HTB-77) and maintained in RPMI 1640 (Corning, 10-040-CVR) and McCoy 5A medium (Gibico, 16600-108), supplemented with 10% fetal bovine serum (FBS) at 37°C and 5% CO2. 3AO was maintained in RPMI 1640 and 10% FBS as described previously.Citation45 The paclitaxel-resistant cell subline, SKOV3-TR30, was developed by treating parental SKOV3 cells with increased concentrations of paclitaxel and cultured in complete medium containing 30 nM paclitaxel as mentioned before.Citation12,46 A2780-TR was a gift from Dr. Ding Ma at Cancer Biology Research Center of Tongji Hospital in Wuhan, China, and cultured in RPMI-1640 containing 10% FBS and 80 nM paclitaxel.Citation47 Before SKOV3-TR30 and A2780-TR cells were collected for quantitative proteomics or western blotting analyses, paclitaxel was removed from complete medium for 7 d.
LC-MS/MS label-free quantitative proteomics and bioinformatics analyses
LC-MS/MS label-free quantitative proteomics and bioinformatics analysis were conducted as previously described.Citation48 Briefly, SKOV3-TR30 and SKOV3 cells were grown approximately to 70% confluence before being harvested. Whole cell lysate preparation and protein extraction were carried out by a standard protocol. Proteins were digested for 20 h at 37°C with sequencing grade modified trypsin (Promega,V5111). The Ettan MDLC system (GE Healthcare) was applied for desalting and separation of tryptic peptide mixtures. The tryptic peptide mixtures were desalted through RP trap columns (Agilent Technologies, Zorbax 300, SB-C18), and separated on an RP column (Column Technology, 0.15 × 150mm, RP-C18). The mobile phase was composed of 0.1% formic acid (A) and 0.1% formic acid in acetonitrile (B), with a gradient as follows: 0 to 105 min, 4 to 50% B; 105 to 114 min, 50 to 100% B; 114 to 120 min 100% B. The flow rate was kept at 2 μL/min. The MS analysis was performed on a Finnigan LTQ VELOS MS (Thermo Electron). Data-dependent MS/MS spectra were obtained simultaneously. Each scan cycle included one full MS1 scan in profile mode followed by 20 MS2 scans in centroid mode. Each sample was analyzed in triplicate. The nonredundant peptides were automatically searched according to the MS/MS spectra in the International Protein Index (IPI) human protein database (version 3.53) using the TurboSEQUEST program in the Bioworks Browser software suite (version 3.1, Thermo Electron). Peptide quantification was based on the number of relevant peptide fragment MS/MS spectra in fully automatic mode using DeCyder MS Differential Analysis Software (version 2.0, GE Healthcare). The differentially expressed proteins were further analyzed according to the information from the GO database. Biological function classifications and signaling pathway analyses were performed with the tools on GenMAPP (version2.1) and the KEGG pathway database.
Patient-specimen selection and immunohistochemistry
A total of 157 formalin-fixed and paraffin-embedded tissue samples obtained from patients diagnosed with ovarian serous, mucinous, endometrioid, and clear cell carcinomas from January 2002 to October 2009 were used for immunohistochemical analyses. All the patients underwent primary surgery followed by paclitaxel-based chemotherapy. The deadline of follow-up was June 30, 2013. The criterion for determining paclitaxel sensitive or resistant and the calculation of PFS and OS were the same as described previously.Citation49 Since 6 patients failed to identify the exact time of recurrence, only 151 patients were used for the calculation of PFS. All the pathological diagnosis was reconfirmed blindly by an expert pathologist. The study was approved by the ethical committee of the Women's Hospital, School of Medicine, Zhejiang University (Reference number 20130060).
The formalin-fixed, paraffin-embedded sections (5 μm) were deparaffinised in xylene and rehydrated standard in graded ethanol and quenched of endogenous peroxides. The slides were then incubated with anti-TXNDC17 (Abcam, ab121725) antibody at a dilution of 1:150 or anti-BECN1 (Abcam, ab51031) antibody at a dilution of 1:100. Two serial sections from the same paraffin embedded block and same patient were stained with anti-TXNDC17 and anti-BECN1 antibody, respectively. Staining was visualized with a Dako real envision detection system (Dako Diagnostica, K5007). The section slides were counter-stained with haematoxylin, dehydrated and mounted. Negative controls were processed without primary antibody. The details were described as before.Citation50 Five microscope fields were picked for evaluating the semiquantification of TXNDC17 and BECN1 staining. The intensity of immunostaining was graded as follows: 1+, weak; 2+, moderate; 3+, strong or 4+, very strong (Fig. S1). The area of positive cancer cells in each microscopic field was categorized as follows: 1+, 0 to 25%; 2+, 25 to 50%; 3+, 50 to 75% or 4+, 75 to 100%. The sum between 5 and 80 was obtained by multiplying the 2 scores. The sum from 0 to 42 was assigned as “low expression.” The sum from 43 to 80 was assigned as “high expression.”
Western blotting
The appropriate amounts of proteins were applied and subjected to SDS–PAGE (15% for LC3B, SQSTM1, ATG5, BECN1, TXNDC17, and UTP23; 12% for PGAM1, CNN3, and ALDOC; 6% for FLNA). The membranes were incubated with primary antibodies at 4°C overnight, after proteins were transferred to PVDF membranes and blocked with 5% nonfat dry milk in TBST. The bands were detected with an EZ-ECL kit (BI biological industries, 20-500-120) in Imagequant LAS400 mini (GE Healthcare) after incubation with secondary antibodies.
Plasmids and siRNA transfection
The construction of the pcDNA3.1(+)-TXNDC17 plasmid was on the basis of following description. The fragment (182 to 553) of TXNDC17 mRNA (NM_032731.3) was synthesized by Sangon Biotech (Shanghai, China) and inserted into EcoRI / BamHI sites of a pcDNA3.1(+) vector (Invitrogen, V79020). pcDNA3.1(+) vector was designated as mock control. The GFP-LC3 plasmid was a gift from Dr Hong-He Zhang at Department of Pathology & Pathophysiology, School of Medicine, Zhejiang University in Hangzhou, China. A2780 and 3AO cells were grown to 80% confluence before plasmid transfection. The ratio of X-tremeGENE HP DNA Transfection Reagent (Roche, 06366236001) :DNA was 2:1, and 2 μg DNA for each well in 6-well plates. The transfection protocol followed the instructions of the manufacturer. For G418 (Sigma, G5013) selection, A2780 and 3AO cells were diluted to 10% to 15% confluence after a 24-hour transfection of pcDNA3.1(+)-TXNDC17 plasmid and treated with 400 μg/mL G418 for 10 d.
The targeting sites for TXNDC17 and BECN1 siRNA were selected as follows: 5′-GTGCCTACACTACTTAAGT-3′for TXNDC17 and 5′-GCTGCCGTTATACTGTTCT-3′ for BECN1. TXNDC17 and BECN1 siRNA and scrambled siRNA were obtained from Ribobio (Guangzhou, China) and delivered into A2780 and 3AO cells with Lipofectamine RNAiMAX Reagent (invitrogen, 13778150) according to the instructions of the manufacturer.
Direct immunofluorescence
A2780, 3AO, and SKOV3 cells were transfected with a GFP-LC3 plasmid overnight and transferred to coverslips. The cells were treated with 10 nM paclitaxel plus BafA1 or not for 24 h after adhering to coverslips. Nuclei were stained with 4′,6-diamidino-2-phenylindole (DAPI, Sigma-Aldrich, D9542) followed by fixing with 4% paraformaldehyde (Sigma-Aldrich, 158127) and permeabilizing with 0.5% Triton X-100 (Solarbio, T8200-100) in PBS (Corning, R21-040-CV). Images were taken with a spinning disk confocal fluorescence microscope (the system is composed of a CSU-X1 spinning disk from Yokogama, a IX81 microscope from Olympus and a IXON3 CCD from Andor) at 600×magnification. The amounts of GFP-LC3-II-positive puncta in 50 GFP-positive cells for each group were counted using the Metamoph offline 7.7.8.0 software package and the GFP-LC3-II-positive puncta per cell were calculated.
Transmission electron microscopy
A2780, 3AO and SKOV3 cells were exposed to 10 nM paclitaxel for 24 h and fixed with 2.5% glutaraldehyde solution (Sigma-Aldrich, G5882) overnight, then postfixed with 1% OsO4 and dehydrated standard in graded ethanol, embedded in 812 resin (Ted Pella, 18109). Thin sections were sliced and stained with 2 % uranyl acetate, then detected with the Tecnai 10 transmission electron microscope (Philips).
Cell viability detection
A2780 and 3AO cells were transfected with siRNA or plasmid for 24 h, then an appropriate amount of cells was seeded (7000 cells per well for A2780 and 8000 cells per well for 3AO) in 96-well plates. A2780 and 3AO cells were exposed to paclitaxel at various final concentrations (0, 2, 5, 10, 20, 50 nM; or 0, 5, 10, 20, 50, 100 nM) for 24 h after adhering to the plate. Each concentration was repeated in triplicate wells. Then, the medium was exchanged and cell viability was determined with the Cell Counting Kit-8(CCK-8, Dojindo laboratories, CK04) after 24 h according to the manufacturer's instructions. The Varioskan Flash microplate reader (Thermo Scientific) was used for spectral analyses.
Statistical analyses
Statistical analyses were conducted with SPSS version 18.0 statistical software package. The differences of quantitative proteomic analyses between SKOV3-TR30 and SKOV3 cells were estimated using the Student t test or the post hoc test in ANOVA analyses. The correlations between immunohistochemical staining of TXNDC17 and BECN1 and clinicopathologic parameters were assessed by the χCitation2 test. OS and PFS curves were determined using the Kaplan–Meier method and the difference in survival was compared by the log-rank test. The influence of TXNDC17 and BECN1 expression on survival was assessed by the Cox regression analysis. GFP-LC3-II-positive puncta and cell viabilities between different groups were assessed by the Student t test. A P value of less than 0.05 was considered to be significant.
Disclosure of Potential Conflicts of Interest
No potential conflicts of interest were disclosed.
Supplemental Material
Supplemental data for this article can be accessed on the publisher's website.
SupplementaryFiles.zip
Download Zip (1.6 MB)Funding
We are grateful to the funds that supported this study: the National Natural Science Foundation of China (Grant No. 81372789), Zhejiang Provincial Natural Science Foundation of China (Grant No. LZ14H160001), National High Technology Research and Development Program 863 (Grant No. 2012AA02A507), Zhejiang Provincial Medicine and Health Technology Plan (Grant No. 2012RCA038).
References
- Siegel R, Naishadham D, Jemal A. Cancer statistics, 2012. CA Cancer J Clin 2012; 62:10-29; PMID:22237781; http://dx.doi.org/10.3322/caac.20138
- Berek JS, Bertelsen K, du Bois A, Brady MF, Carmichael J, Eisenhauer EA, Gore M, Grenman S, Hamilton TC, Hansen SW, et al. Advanced epithelial ovarian cancer: 1998 consensus statements. Ann Oncol 1999; 10 1:87-92; PMID:10219460; http://dx.doi.org/10.1023/A:1008323922057
- Raja FA, Counsell N, Colombo N, Pfisterer J, du Bois A, Parmar MK, Vergote IB, Gonzalez-Martin A, Alberts DS, Plante M, et al. Platinum versus platinum-combination chemotherapy in platinum-sensitive recurrent ovarian cancer: a meta-analysis using individual patient data. Ann Oncol 2013; 24:3028-34; PMID:24190964; http://dx.doi.org/10.1093/annonc/mdt406
- Aletti GD, Gallenberg MM, Cliby WA, Jatoi A, Hartmann LC. Current management strategies for ovarian cancer. Mayo Clin Proc 2007; 82:751-70; PMID:17550756; http://dx.doi.org/10.1016/S0025-6196(11)61196-8
- Hall M, Gourley C, McNeish I, Ledermann J, Gore M, Jayson G, Perren T, Rustin G, Kaye S. Targeted anti-vascular therapies for ovarian cancer: current evidence. Br J Cancer 2013; 108:250-8; PMID:23385789; http://dx.doi.org/10.1038/bjc.2012.541
- Morgan RJ, Jr., Alvarez RD, Armstrong DK, Burger RA, Castells M, Chen LM, Copeland L, Crispens MA, Gershenson D, Gray H, et al. Ovarian cancer, version 3.2012. J Natl Compr Canc Netw 2012; 10:1339-49; PMID:23138163.
- Orr GA, Verdier-Pinard P, McDaid H, Horwitz SB. Mechanisms of taxol resistance related to microtubules. Oncogene 2003; 22:7280-95; PMID:14576838; http://dx.doi.org/10.1038/sj.onc.1206934
- Dong X, Mattingly CA, Tseng MT, Cho MJ, Liu Y, Adams VR, Mumper RJ. Doxorubicin and paclitaxel-loaded lipid-based nanoparticles overcome multidrug resistance by inhibiting P-glycoprotein and depleting ATP. Cancer Res 2009; 69:3918-26; PMID:19383919; http://dx.doi.org/10.1158/0008-5472.CAN-08-2747
- Bhalla KN. Microtubule-targeted anticancer agents and apoptosis. Oncogene 2003; 22:9075-86; PMID:14663486; http://dx.doi.org/10.1038/sj.onc.1207233
- Wertz IE, Kusam S, Lam C, Okamoto T, Sandoval W, Anderson DJ, Helgason E, Ernst JA, Eby M, Liu J, et al. Sensitivity to antitubulin chemotherapeutics is regulated by MCL1 and FBW7. Nature 2011; 471:110-4; PMID:21368834; http://dx.doi.org/10.1038/nature09779
- Drukman S, Kavallaris M. Microtubule alterations and resistance to tubulin-binding agents (review). Int J Oncol 2002; 21:621-8; PMID:12168109.
- Fu Y, Ye D, Chen H, Lu W, Ye F, Xie X. Weakened spindle checkpoint with reduced BubR1 expression in paclitaxel-resistant ovarian carcinoma cell line SKOV3-TR30. Gynecol Oncol 2007; 105:66-73; PMID:17234259; http://dx.doi.org/10.1016/j.ygyno.2006.10.061
- Jeong W, Yoon HW, Lee SR, Rhee SG. Identification and characterization of TRP14, a thioredoxin-related protein of 14 kDa. new insights into the specificity of thioredoxin function. J Biol Chem 2004; 279:3142-50; PMID:14607844; http://dx.doi.org/10.1074/jbc.M307932200
- Jeong W, Chang TS, Boja ES, Fales HM, Rhee SG. Roles of TRP14, a thioredoxin-related protein in tumor necrosis factor-α signaling pathways. J Biol Chem 2004; 279:3151-9; PMID:14607843; http://dx.doi.org/10.1074/jbc.M307959200
- Harris J. Autophagy and cytokines. Cytokine 2011; 56:140-4; PMID:21889357; http://dx.doi.org/10.1016/j.cyto.2011.08.022
- Liu F, Liu D, Yang Y, Zhao S. Effect of autophagy inhibition on chemotherapy-induced apoptosis in A549 lung cancer cells. Oncol Lett 2013; 5:1261-5; PMID:23599776.
- Xi G, Hu X, Wu B, Jiang H, Young CY, Pang Y, Yuan H. Autophagy inhibition promotes paclitaxel-induced apoptosis in cancer cells. Cancer Lett 2011; 307:141-8; PMID:21511395; http://dx.doi.org/10.1016/j.canlet.2011.03.026
- Chen N, Karantza V. Autophagy as a therapeutic target in cancer. Cancer Biol Ther 2011; 11:157-68; PMID:21228626; http://dx.doi.org/10.4161/cbt.11.2.14622
- Yang Z, Klionsky DJ. Eaten alive: a history of macroautophagy. Nat Cell Biol 2010; 12:814-22; PMID:20811353; http://dx.doi.org/10.1038/ncb0910-814
- Degenhardt K, Mathew R, Beaudoin B, Bray K, Anderson D, Chen G, Mukherjee C, Shi Y, Gelinas C, Fan Y, et al. Autophagy promotes tumor cell survival and restricts necrosis, inflammation, and tumorigenesis. Cancer Cell 2006; 10:51-64; PMID:16843265; http://dx.doi.org/10.1016/j.ccr.2006.06.001
- Maiuri MC, Zalckvar E, Kimchi A, Kroemer G. Self-eating and self-killing: crosstalk between autophagy and apoptosis. Nat Rev Mol Cell Biol 2007; 8:741-52; PMID:17717517; http://dx.doi.org/10.1038/nrm2239
- Kanzawa T, Zhang L, Xiao L, Germano IM, Kondo Y, Kondo S. Arsenic trioxide induces autophagic cell death in malignant glioma cells by upregulation of mitochondrial cell death protein BNIP3. Oncogene 2005; 24:980-91; PMID:15592527; http://dx.doi.org/10.1038/sj.onc.1208095
- Shao Y, Gao Z, Marks PA, Jiang X. Apoptotic and autophagic cell death induced by histone deacetylase inhibitors. Proc Natl Acad Sci U S A 2004; 101:18030-5; PMID:15596714; http://dx.doi.org/10.1073/pnas.0408345102
- Klionsky DJ, Cregg JM, Dunn WA, Jr., Emr SD, Sakai Y, Sandoval IV, Sibirny A, Subramani S, Thumm M, Veenhuis M, et al. A unified nomenclature for yeast autophagy-related genes. Dev Cell 2003; 5:539-45; PMID:14536056; http://dx.doi.org/10.1016/S1534-5807(03)00296-X
- Klionsky DJ, Abdalla FC, Abeliovich H, Abraham RT, Acevedo-Arozena A, Adeli K, Agholme L, Agnello M, Agostinis P, Aguirre-Ghiso JA, et al. Guidelines for the use and interpretation of assays for monitoring autophagy. Autophagy 2012; 8:445-544; PMID:22966490; http://dx.doi.org/10.4161/auto.19496
- Lee DH, Chung K, Song JA, Kim TH, Kang H, Huh JH, Jung SG, Ko JJ, An HJ. Proteomic identification of paclitaxel-resistance associated hnRNP A2 and GDI 2 proteins in human ovarian cancer cells. J Proteome Res 2010; 9:5668-76; PMID:20858016; http://dx.doi.org/10.1021/pr100478u
- Di Michele M, Della Corte A, Cicchillitti L, Del Boccio P, Urbani A, Ferlini C, Scambia G, Donati MB, Rotilio D. A proteomic approach to paclitaxel chemoresistance in ovarian cancer cell lines. Biochim Biophys Acta 2009; 1794:225-36; PMID:18973835; http://dx.doi.org/10.1016/j.bbapap.2008.09.017
- Pan S, Cheng L, White JT, Lu W, Utleg AG, Yan X, Urban ND, Drescher CW, Hood L, Lin B. Quantitative proteomics analysis integrated with microarray data reveals that extracellular matrix proteins, catenins, and p53 binding protein 1 are important for chemotherapy response in ovarian cancers. OMICS 2009; 13:345-54; PMID:19422301; http://dx.doi.org/10.1089/omi.2009.0008
- Jeong W, Jung Y, Kim H, Park SJ, Rhee SG. Thioredoxin-related protein 14, a new member of the thioredoxin family with disulfide reductase activity: implication in the redox regulation of TNF-α signaling. Free Radic Biol Med 2009; 47:1294-303; PMID:19628032; http://dx.doi.org/10.1016/j.freeradbiomed.2009.07.021
- Lin HX, Qiu HJ, Zeng F, Rao HL, Yang GF, Kung HF, Zhu XF, Zeng YX, Cai MY, Xie D. Decreased expression of beclin 1 correlates closely with Bcl-xL expression and poor prognosis of ovarian carcinoma. PLoS One 2013; 8:e60516; PMID:23573264; 10.1371/journal.pone.0060516
- May T, Shoni M, Crum CP, Xian W, Vathipadiekal V, Birrer M, Rosen B, Tone A, Murphy KJ. Low-grade and high-grade serous mullerian carcinoma: review and analysis of publicly available gene expression profiles. Gynecol Oncol 2013; 128:488-92; PMID:23253401; http://dx.doi.org/10.1016/j.ygyno.2012.12.009
- Ahn CH, Jeong EG, Lee JW, Kim MS, Kim SH, Kim SS, Yoo NJ, Lee SH. Expression of beclin-1, an autophagy-related protein, in gastric and colorectal cancers. APMIS 2007; 115:1344-9; PMID:18184403; http://dx.doi.org/10.1111/j.1600-0463.2007.00858.x
- Li BX, Li CY, Peng RQ, Wu XJ, Wang HY, Wan DS, Zhu XF, Zhang XS. The expression of beclin 1 is associated with favorable prognosis in stage IIIB colon cancers. Autophagy 2009; 5:303-6; PMID:19066461; http://dx.doi.org/10.4161/auto.5.3.7491
- Turcotte S, Chan DA, Sutphin PD, Hay MP, Denny WA, Giaccia AJ. A molecule targeting VHL-deficient renal cell carcinoma that induces autophagy. Cancer Cell 2008; 14:90-102; PMID:18598947; http://dx.doi.org/10.1016/j.ccr.2008.06.004
- Gorka M, Daniewski WM, Gajkowska B, Lusakowska E, Godlewski MM, Motyl T. Autophagy is the dominant type of programmed cell death in breast cancer MCF-7 cells exposed to AGS 115 and EFDAC, new sesquiterpene analogs of paclitaxel. Anticancer Drugs 2005; 16:777-88; PMID:16027528; http://dx.doi.org/10.1097/01.cad.0000171514.50310.85
- Katayama M, Kawaguchi T, Berger MS, Pieper RO. DNA damaging agent-induced autophagy produces a cytoprotective adenosine triphosphate surge in malignant glioma cells. Cell Death Differ 2007; 14:548-58; PMID:16946731; http://dx.doi.org/10.1038/sj.cdd.4402030
- Carew JS, Nawrocki ST, Kahue CN, Zhang H, Yang C, Chung L, Houghton JA, Huang P, Giles FJ, Cleveland JL. Targeting autophagy augments the anticancer activity of the histone deacetylase inhibitor SAHA to overcome Bcr-Abl-mediated drug resistance. Blood 2007; 110:313-22; PMID:17363733; http://dx.doi.org/10.1182/blood-2006-10-050260
- O'Donovan TR, O'Sullivan GC, McKenna SL. Induction of autophagy by drug-resistant esophageal cancer cells promotes their survival and recovery following treatment with chemotherapeutics. Autophagy 2011; 7:509-24; PMID:21325880; http://dx.doi.org/10.4161/auto.7.5.15066
- Yang ZJ, Chee CE, Huang S, Sinicrope FA. The role of autophagy in cancer: therapeutic implications. Mol Cancer Ther 2011; 10:1533-41; PMID:21878654; http://dx.doi.org/10.1158/1535-7163.MCT-11-0047
- Veldhoen RA, Banman SL, Hemmerling DR, Odsen R, Simmen T, Simmonds AJ, Underhill DA, Goping IS. The chemotherapeutic agent paclitaxel inhibits autophagy through two distinct mechanisms that regulate apoptosis. Oncogene 2013; 32:736-46; PMID:22430212; http://dx.doi.org/10.1038/onc.2012.92
- Yue Z, Zhong Y. From a global view to focused examination: understanding cellular function of lipid kinase VPS34-Beclin 1 complex in autophagy. J Mol Cell Biol 2010; 2:305-7; PMID:20846953; http://dx.doi.org/10.1093/jmcb/mjq028
- Wirawan E, Lippens S, Vanden Berghe T, Romagnoli A, Fimia GM, Piacentini M, Vandenabeele P. Beclin1: a role in membrane dynamics and beyond. Autophagy 2012; 8:6-17; PMID:22170155; http://dx.doi.org/10.4161/auto.8.1.16645
- Jung Y, Kim H, Min SH, Rhee SG, Jeong W. Dynein light chain LC8 negatively regulates NF-kappaB through the redox-dependent interaction with ikappabalpha. J Biol Chem 2008; 283:23863-71; PMID:18579519; http://dx.doi.org/10.1074/jbc.M803072200
- Copetti T, Bertoli C, Dalla E, Demarchi F, Schneider C. p65/RelA modulates BECN1 transcription and autophagy. Mol Cell Biol 2009; 29:2594-608; PMID:19289499; http://dx.doi.org/10.1128/MCB.01396-08
- Shi MF, Jiao J, Lu WG, Ye F, Ma D, Dong QG, Xie X. Identification of cancer stem cell-like cells from human epithelial ovarian carcinoma cell line. Cell Mol Life Sci 2010; 67:3915-25; PMID:20549538; http://dx.doi.org/10.1007/s00018-010-0420-9
- Fu Y, Hu D, Qiu J, Xie X, Ye F, Lu WG. Overexpression of glycogen synthase kinase-3 in ovarian carcinoma cells with acquired paclitaxel resistance. Int J Gynecol Cancer 2011; 21:439-44; PMID:21436692; http://dx.doi.org/10.1097/IGC.0b013e31820d7366
- Mo QQ, Chen PB, Jin X, Chen Q, Tang L, Wang BB, Li KZ, Wu P, Fang Y, Wang SX, et al. Inhibition of hec1 expression enhances the sensitivity of human ovarian cancer cells to paclitaxel. Acta Pharmacol Sin 2013; 34:541-8; PMID:23474708; http://dx.doi.org/10.1038/aps.2012.197
- Xue H, Lu B, Zhang J, Wu M, Huang Q, Wu Q, Sheng H, Wu D, Hu J, Lai M. Identification of serum biomarkers for colorectal cancer metastasis using a differential secretome approach. J Proteome Res 2010; 9:545-55; PMID:19924834; http://dx.doi.org/10.1021/pr9008817
- Li X, Lu Y, Chen Y, Lu W, Xie X. MicroRNA profile of paclitaxel-resistant serous ovarian carcinoma based on formalin-fixed paraffin-embedded samples. BMC Cancer 2013; 13:216; PMID:23627607; http://dx.doi.org/10.1186/1471-2407-13-216
- Li YL, Ye F, Cheng XD, Hu Y, Zhou CY, Lu WG, Xie X. Identification of glia maturation factor β as an independent prognostic predictor for serous ovarian cancer. Eur J Cancer 2010; 46:2104-18; PMID:20547056; http://dx.doi.org/10.1016/j.ejca.2010.04.015