
Abstract
ATG4 plays a key role in autophagy induction, but the methods for monitoring ATG4 activity in living cells are limited. Here we designed a novel fluorescent peptide named AU4S for noninvasive detection of ATG4 activity in living cells, which consists of the cell-penetrating peptide (CPP), ATG4-recognized sequence “GTFG,” and the fluorophore FITC. Additionally, an ATG4-resistant peptide AG4R was used as a control. CPP can help AU4S or AG4R to penetrate cell membrane efficiently. AU4S but not AG4R can be recognized and cleaved by ATG4, leading to the change of fluorescence intensity. Therefore, the difference between AU4S- and AG4R-measured fluorescence values in the same sample, defined as “F-D value,” can reflect ATG4 activity. By detecting the F-D values, we found that ATG4 activity paralleled LC3B-II levels in rapamycin-treated cells, but neither paralleled LC3B-II levels in starved cells nor presented a correlation with LC3B-II accumulation in WBCs from healthy donors or leukemia patients. However, when DTT was added to the system, ATG4 activity not only paralleled LC3B-II levels in starved cells in the presence or absence of autophagy inhibitors, but also presented a positive correlation with LC3B-II accumulation in WBCs from leukemia patients (R2 = 0.5288). In conclusion, this study provides a convenient, rapid, and quantitative method to monitor ATG4 activity in living cells, which may be beneficial to basic and clinical research on autophagy.
Abbreviations:
- 3-MA, 3-methyladenine
- Ac, acetyl
- AG4R, ATG4-resistant peptide
- ATG4, autophagy-related 4, cysteine peptidase
- AU4S, autophagy-related 4 substrate
- CFP, cyan fluorescent protein
- CPP, cell-penetrating peptide
- CQ, chloroquine
- DTT, dithiothreitol
- EBSS, Earle's balanced salt solution
- FITC, fluorescein isothiocyanate
- HIV, human immunodeficiency virus
- MAP1LC3/LC3, microtubule-associated protein 1 light chain 3
- NAC, N-acetyl-L-cysteine
- NRK, normal rat kidney cell line
- PAGE, polyacrylamide gel electrophoresis
- PBS, phosphate-buffered saline
- PE, phosphatidylethanolamine
- PtdIns3K, phosphatidylinositol 3-kinase
- PLA2, phospholipase A2
- PMSF, phenylmethanesulfonyl fluoride
- ROS, reactive oxygen species
- SDS, sodium dodecyl sulfate
- WBCs, white blood cells
- YFP, yellow fluorescent protein
Introduction
Macroautophagy (hereafter referred to as autophagy) is a highly conserved cellular catabolic degradation process, which participates in maintaining cellular homeostasis.Citation1-2 During the autophagic process, the target cytoplasmic constituents including dysfunctional organelles and long-lived proteins are first sequestered by the phagophore, which subsequently forms a double-membrane compartment called autophagosome. Then the outer membrane of autophagosome fuses with that of lysosome and delivers the cargo for degradation and recycling.Citation2 Autophagy is involved in many physiological processes, such as development, differentiation, aging, immunity, and cell death.Citation3-8 Moreover, accumulating evidence has demonstrated that deregulation of autophagy contributes to multiple human diseases such as cancers, fibrosis, cardiovascular diseases, neurodegenerations, infections, and inflammation.Citation9-14
In yeast, the vital role of a ubiquitin-like protein Atg8 has been verified in autophagy.Citation15 Atg8 can be cleaved by Atg4 so as to expose a glycine to provide the C-terminal carboxyl group, which can be further processed by a ubiquitin-like system (including Atg7, Atg3, and the Atg12–Atg5-Atg16 complex) to form an amide bond with phosphatidylethanolamine (PE).Citation16 The lipidated Atg8 (Atg8–PE) plays a pivotal role in the process of autophagosome formation.Citation15 Moreover, Atg4 can delipidate Atg8-PE to recycle Atg8, which is also essential for autophagosome biogenesis.Citation17 Deletion of ATG4 can dramatically influence the autophagic process in yeast.Citation17-18 Therefore, Atg4 is apparently important for autophagy in yeast. In mammalian cells, there are 4 types of Atg4 orthologs including ATG4A, ATG4B, ATG4C, and ATG4D.Citation19 Similar to Atg4 in yeast, mammalian ATG4 proteases also play an important role in autophagy.Citation20-28 Previous studies have shown that native ATG4 proteases have activities against mammalian Atg8 orthologs and paralogs, especially the MAP1LC3/LC3 protein family member MAP1LC3B/LC3B.Citation29-32 Similar to Atg8 in yeast, mammalian LC3B can be cleaved by mammalian ATG4 proteases to form LC3B-I (the nonlipidated form of LC3B), which will be further lipidated (the lipidated LC3B-I is called LC3B-II) and translocated to the phagophore membrane. Similiarly, mammalian ATG4 proteases also have an effect on the delipidation of LC3B-II.Citation33-34 Now LC3B-II is a widely used marker of autophagy because it makes the LC3B protein shift from a diffuse to a punctate state and promotes the formation of the autophagosome.Citation35 However, the detailed mechanisms about the regulation of ATG4 activity and the relationship between ATG4 cysteine proteases and Atg8 orthologs and paralogs in living cells are not well known at present. Thus, measurement of ATG4 activity may be beneficial to the relevant research in this field.
To date, several methods have been developed to detect ATG4 activity.Citation32,36-37 The fluorophore-labeled conserved TFG tripeptide derived from Atg8 orthologs including MAP1LC3A/LC3A, MAP1LC3B/LC3B, MAP1LC3C/LC3C, and GABARAPL2, is a good substrate to measure ATG4 activity in vitro but not in living cells due to lack of cell-penetration ability.Citation32 Fused protein probes such as CFP-LC3B-YFP and LC3B-PLA2 are good candidates to examine ATG4 activity in living cells,Citation32,36 but the limitations are that it will take a long time to construct these probes and the large protein molecules may have some influence on the physiological status of the transfected cells. TFG tripeptide-conjugated polymeric nanoparticles can enter living cells and measure the activity of ATG4,Citation37 but the nanoparticles are not easily generated and implemented.Citation38 Therefore, improvement is needed to overcome the limitations of these methods.
In the present study, we designed a novel fluorescent peptide named as AU4S (autophagy-related 4 substrate), which consists of the cell-penetrating peptide (CPP) “RKKRRQRRR” (derived from the HIV Tat proteinCitation39-41), ATG4-recognized sequence “GTFG,” and the fluorophore FITC. Our study showed that AU4S can be conveniently used for noninvasive detection of ATG4 activity in mammalian living cells including cultured cell lines and human peripheral white blood cells (WBCs) , indicating that AU4S may be a useful tool in autophagy research and even in clinical tests.
Results
AU4S can be specifically recognized by the recombinant ATG4 proteases
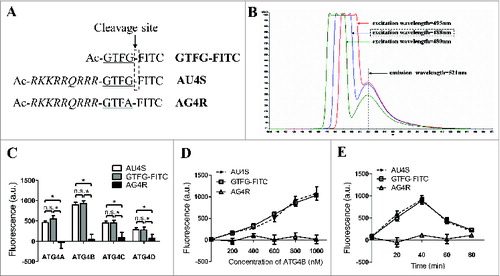
AU4S and its 2 control peptides GTFG-FITC and AG4R (ATG4-resistant peptide) were synthesized and the compositions of the 3 peptides were shown in . Theoretically, GTFG-FITC can hardly enter living cells due to the barrier of plasma membrane but can be recognized by ATG4 in vitro. Both AG4R and AU4S can enter living cells, but only AU4S (not AG4R) can be recognized by ATG4. As shown in , the optimal excitation wavelength (488 nm) and emission wavelength (521 nm) of FITC fluorescence were confirmed by fluorescence spectrometry. To test the specificity of the 3 peptides to ATG4, recombinant human ATG4A, ATG4B, ATG4C, and ATG4D proteins were expressed and purified (Fig. S1A). As shown in , the fluorescence intensity dramatically increased when AU4S (or GTFG-FITC) but not AG4R was incubated with the recombinant ATG4 proteases, and the recombinant ATG4B-incubated AU4S (or GTFG-FITC) exhibited the strongest fluorescence intensity. The data from fluorescence spectrometer validated that recombinant ATG4B significantly increased the quantum yield of FITC when incubated with AU4S but not AG4R (Fig. S1B), which was markedly attenuated by the FITC-uncoupled peptide “Ac-RKKRRQRRR-GTFG” because it can compete with AU4S for binding ATG4 (Fig. S1C). Moreover, recombinant ATG4B dose-dependently increased the fluorescence intensity in the presence of AU4S (or GTFG-FITC) but not AG4R (). The fluorescence values reached a peak after incubation of recombinant ATG4B with AU4S or GTFG-FITC for 40 min and then gradually decreased along with the hydrolysis of AU4S (or GTFG-FITC) by ATG4B (). Additionally, the increase of fluorescence resulted from the incubation of ATG4B with AU4S at 40 min timepoint was dramatically attenuated by protease inhibitors cocktail or PMSF (The cocktail and PMSF can inhibit ATG4B activity in vitroCitation37) (Fig. S1C). These results demonstrated that “GTFG” sequence in AU4S can be specifically recognized by ATG4 proteases, leading to an increase of quantum yield of FITC and fluorescence intensity. Meanwhile, these data indicated that AU4S could be used to evaluate the activity of recombinant ATG4 by detecting the fluorescence intensity at the 40 min timepoint.
Figure 1. AU4S can be specifically recognized by recombinant ATG4 proteases. (A) A diagram for the compositions of the AU4S, AG4R and GTFG-FITC peptides. (B) AU4S was dissolved in 1 ml reaction buffer (50 mM Tris-HCl, pH 8.0, 2 mM DTT, 1.2 M sodium citrate) at the final concentration of 0.2 μM, and then detected with a PerkinElmer LS55 fluorescence spectrometer. The fluorescence spectrograms of AU4S with the excitation wavelengths at 480 nm, 488 nm, and 495 nm are shown (The emission wavelength is 521 nm). (C) Recombinant human ATG4 proteases (0.8 μM) including ATG4A, ATG4B, ATG4C and ATG4D were separately incubated with 0.2 μM AU4S, AG4R, or GTFG-FITC in the reaction buffer at 37 ℃ for 40 min in darkness. Then the fluorescence values were recorded with a fluorescence microplate reader in arbitrary units (a.u.) at excitation/emission wavelength 488 nm/521 nm. The fluorescence values of 0.2 μM peptides (AU4S, AG4R or GTFG/FITC) in reaction buffer without ATG4 proteases were considered as the corresponding background, which was subtracted accordingly. Data are mean ± SD from 3 experiments. n.s.: no significance; *: P < 0.05. (D and E) Different concentrations of recombinant ATG4B were separately incubated with 0.2 μM AU4S, AG4R, or GTFG-FITC for 40 min (D) or recombinant ATG4B (0.8 μM) was separately incubated with 0.2 μM AU4S, AG4R, or GTFG/FITC for the indicated times (E) in the reaction buffer at 37°C in darkness. Subsequently, the fluorescence values were recorded with a fluorescence microplate reader. The fluorescence values of 0.2 μM peptides (AU4S, AG4R or GTFG-FITC) in the reaction buffer without ATG4B were considered as the corresponding background, which was subtracted accordingly. Data are mean ± SD from 3 experiments.
AU4S can be used to measure the activity of ATG4 in the lysates of cells and tissues
To evaluate the activity of ATG4 proteases in cell lysates, AU4S, and AG4R were separately incubated with the lysates of NRK cells. As shown in , the fluorescence intensity dramatically increased when the cell lysates were incubated with AU4S but not AG4R, indicating that AU4S but not AG4R can be recognized by ATG4 proteases in the cell lysates. Here the difference between AU4S- and AG4R-measured fluorescence intensity in the same sample was defined as “F-D value,” which can reflect the activity of ATG4 proteases. Subsequently, the activity of ATG4 was measured by calculating the F-D values in the lysates of rapamycin-treated cells. As shown in , rapamycin treatment markedly induced LC3B-II accumulation (the ratio of LC3B-II/GAPDH increased from 0.32 to 0.95) in NRK cells () and significantly increased the F-D values in the cell lysates (), which indicated that there was an increase of ATG4 activity in rapamycin-treated autophagic cells. Moreover, the LC3B-II levels in the tissue lysates of 6 Sprague-Dawley (SD) rats (numbered as Rat 1 to 6) were measured by immunoblot (, S2A and S2C) and the corresponding activity of ATG4 was measured by analyzing the change of F-D values (, S2B and S2D). The results showed that the ratios of LC3B-II/GAPDH were positively correlated with the F-D values in the tissue of starved rats (Rat 2, 4, and 6) (R2 = 0.4389, P = 0.0071) (), but not in the tissue of control rats (Rat 1, 3, and 5) (R2 = 0.01175, P = 0.7005) (). The above studies demonstrated that AU4S can be used to detect the activity of ATG4 in the lysates of cells and animal tissue, and the ATG4 activity in the tissue positively correlates with the level of LC3B-II in a starvation-induced autophagic animal model.
Figure 2. AU4S can be used to measure the activity of ATG4 in the lysates of cells and tissue. (A) After being cultured overnight in 6-well plates, NRK cells were harvested and lysed using the lysis buffer without protease inhibitors. Subsequently, 0.2 μM AU4S and AG4R were separately incubated with the cell lysates in 200 μl reaction buffer (50 mM Tris-HCl, pH 8.0, 5 mM DTT, 1.2 M sodium citrate) at 37 ℃ for 40 min in darkness. Then the fluorescence values were detected with a fluorescence microplate reader at excitation/emission wavelength 488 nm/521 nm. The fluorescence values of 0.2 μM AU4S and AG4R in the reaction buffer without cell lysates (but with equal volume of lysis buffer) were considered as the corresponding background. Data are mean ± SD from 3 experiments. n.s.: no significance; *: P < 0.05. (B) After treatment with or without 500 nM rapamycin for 6 h in 6-well plates, NRK cells were harvested and lysed. Then the lysates were used for immunoblot analysis of LC3B-II, taking GAPDH as a loading control. One representative set of data from 3 experiments is shown, and the ratio of LC3B-II/GAPDH was calculated. (C) The cell lysates derived from (B) were used for the detection of the fluorescence values in the presence of AU4S or AG4R as in (A). The F-D value (the difference between AU4S- and AG4R-measured fluorescence intensity in the same sample) was calculated and normalized by the amount of protein (a.u./mg protein). Data are mean ± SD from 3 experiments. *: P < 0.05. (D) Two SD rats (numbered as Rat 1 and 2) were separately fed with a standard laboratory food (for Rat 1) or starved (for Rat 2) for 48 h. Then the rats were sacrificed and the tissues including liver, skeletal muscle, heart, brain, and white blood cells (WBCs) were obtained and lysed. Subsequently, the lysates were used for immunoblot analysis of LC3B-II as in (B). Each tissue lysate was assayed by immunoblot 3 times, and one representative immunoblot is shown. Additionally, the ratio of LC3B-II/GAPDH was calculated. (E) Each tissue lysate derived from (D) was used for the measurement of F–D values as in (C) with AU4S and AG4R 3 times. Data are mean ± SD from 3 experiments. (F and G) The correlation between the F–D values and the corresponding ratios of LC3B-II/GAPDH in starved rat tissues (F, Rat 2,4,6) or control rat tissues (G, Rat 1,3,5) was respectively analyzed.
AU4S can efficiently enter living cells
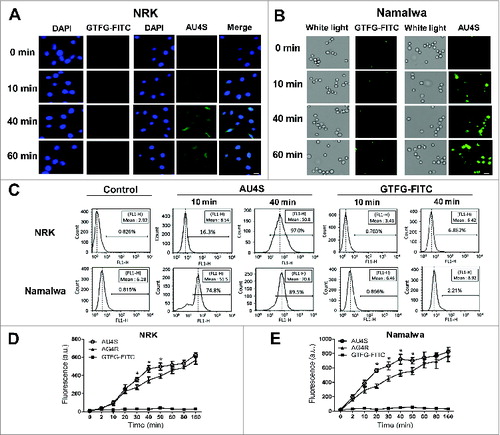
To evaluate the cell penetration ability of AU4S, AG4R, and GTFG-FITC, the change of intracellular fluorescence was detected by fluorescence microscopy, flow cytometry, and fluorescence microplate reader. As shown in , 3B, S3A, and S3B, fluorescence microscopy observation showed that AU4S and AG4R (but not GTFG-FITC) entered either attached NRK cells or suspended Namalwa cells after incubation for 10, 40, and 60 min. Flow cytometry analysis further validated the efficient cell penetration of AU4S and AG4R in NRK and Namalwa cells (, S3C and S3D). Treatment with cytochalasin D (an inhibitor of actin polymerization, which can block macropinocytosis) partially suppressed the cell penetration of AG4R (Fig. S4), indicating that macropinocytosis may be a mechanism by which AG4R and AU4S enter living cells. Fluorescence microscopy observation with high magnification showed that AU4S distributed in the cytoplasm, nucleus, and lysosomes (Fig. S5). In addition, AU4S caused little effect (at least at the indicated concentrations and timepoints) on cell viability or LC3B-II conversion (Fig. S6). After incubation with the same dose of AU4S, AG4R, and GTFG-FITC respectively, the fluorescence values of the cells (detected by fluorescence microplate reader) increased in a time-dependent manner in the presence of AU4S and AG4R (but not GTFG-FITC) (). Moreover, the fluorescence values in AU4S-incubated cells were higher than that in AG4R-incubated cells after incubation for 30 to 50 min in NRK cells () and 20 to 50 min in Namalwa cells (), which may be due to the effect of intracellular ATG4 proteases on AU4S but not AG4R. The above data demonstrated that AU4S and AG4R (but not GTFG-FITC) could efficiently enter living cells.
Figure 3. AU4S can efficiently enter living cells. (A and B) NRK (A) and Namalwa (B) cells were separately incubated with 1 μM AU4S or GTFG-FITC for the indicated times. Then the fluorescence intensity was observed under fluorescence microscopy, and the representative pictures are shown. DAPI was used to stain the nucleus. (C) After incubation with 1 μM AU4S or GTFG-FITC for the indicated times, NRK cells or Namalwa cells were washed 3 times with DMEM medium, and then resuspended in PBS. Subsequently, the fluorescence intensity in the cells was analyzed by flow cytometry, and the representative data are shown. (D and E) After an overnight incubation in complete medium, NRK (D) and Namalwa (E) cells were separately incubated with 0.5 μM AU4S, AG4R or GTFG-FITC in DMEM medium for the indicated times. Then the cells were resuspended in PBS after washed 3 times with medium. Subsequently, the fluorescence intensity was measured with a fluorescence microplate reader. Data are mean ± SD from 3 experiments. *: P <0.05.
AU4S can be used to detect the activity of ATG4 in living cells
To investigate whether AU4S can be used to monitor basal ATG4 activity in living cells, the difference of fluorescence intensity between AU4S- and AG4R-incubated cells was analyzed by flow cytometry. As shown in , the fluorescence intensity of both AU4S- and AG4R-incubated NRK cells increased in a time-dependent manner. However, the fluorescence intensity in AU4S-incubated cells was much higher than that in AG4R-incubated cells after incubation for 40 min. These data were consistent with the results in revealed by fluorescence microplate reader. Furthermore, pretreatment of the NRK cells with the FITC-uncoupled peptide “Ac-RKKRRQRRR-GTFG” (a competitive peptide of AU4S for ATG4 proteases) abolished the fluorescence difference between AU4S- and AG4R-incubated cells (). Therefore, the “F-D value” (the difference between AU4S-and AG4R-detected fluorescence intensity in the same sample), which resulted from the recognition of endogenous ATG4 proteases on AU4S but not AG4R, could reflect ATG4 activity in living cells.
Figure 4. AU4S can be used to detect the activity of ATG4 in living cells. (A) After an overnight incubation in complete medium, NRK cells were cultured in DMEM medium at 37°C for the indicated times in darkness in the presence or absence of 0.5 μM AU4S or AG4R. Then the cells were resuspended in PBS after 3 washes with medium. Subsequently, the fluorescence intensity was analyzed by flow cytometry (FL1-H channel). Data from 3 experiments are presented in the line chart. The fluorescence value of 100 cells = the mean fluorescence value per cell × 100. The average fluorescence values from 3 experiments are also presented under the chart. (B) After pretreatment with 1 μM “Ac-RKKRRQRRR-GTFG” for 20 min, NRK cells were separately incubated with 0.5 μM AU4S and AG4R for 40 min at 37 ℃. Then the fluorescence intensity was analyzed by flow cytometry as in (A). Data from 3 experiments are presented. (C and D) After treatment with 0.5 μM rapamycin for 1 h or 3 h, NRK cells were cultured in DMEM medium with 0.5 μM AU4S or AG4R for 40 min. Then the cells were resuspended in PBS after 3 washes with medium. Subsequently, the fluorescence intensity was analyzed by flow cytometry (C) or fluorescence microplate measurements (D). The F-D value represents the difference between AU4S- and AG4R-measured fluorescence intensity in the same sample. In the flow cytometry analysis, the mean fluorescence value of 1×10⁴ cells was calculated. The fluorescence value of 100 cells = the mean fluorescence value per cell × 100. When detected with the fluorescence microplate reader, the F-D value was normalized by the amount of protein (a.u./mg protein). Data are mean ± SD from 3 experiments. (E and F) After an overnight incubation in complete medium, NRK cells were cultured in EBSS medium for 1 h or 3 h. Then the cells were incubated with 0.5 μM AU4S or AG4R for 40 min in DMEM medium. Subsequently, the cells were resuspended in PBS after washed 3 times with medium, and then the fluorescence intensity was analyzed by flow cytometry (E) or with a fluorescence microplate reader (F) as in (C) and (D), respectively. Data are mean ± SD from 3 experiments. (G and H) After treatment with 0.5 μM rapamycin for 1 h or 3 h, NRK cells were harvested and the level of LC3B-II was analyzed by immunoblot, using GAPDH as a loading control. The representative data are shown in (G), and the ratio of LC3B-II/GAPDH was calculated based on the data from 3 experiments (H). (I and J) After an overnight incubation in complete medium, NRK cells were cultured in EBSS medium for 1 h or 3 h. Then the cells were harvested and the level of LC3B-II was analyzed by immunoblot. The representative data are shown in (I), and the ratio of LC3B-II/GAPDH was calculated based on the data from 3 experiments (J). n.s.: no significance; *: P <0.05.
Subsequently, the activity of ATG4 in NRK cells after treatment with rapamycin or starvation (EBSS) was measured by analyzing the F-D value. As shown in , the F-D values were dramatically increased at both 1 h and 3 h timepoints in rapamycin-treated NRK cells (), but only significantly increased at the 1 h timepoint and nearly returned to the basal level at the 3 h timepoint in EBSS-treated NRK cells (). Meanwhile, the level of LC3B-II in NRK cells was significantly increased after treatment with rapamycin or EBSS for 1 h or 3 h (). These results indicated that the change of ATG4 activity paralleled the accumulation of LC3B-II in rapamycin-treated cells but not in EBSS-treated cells.
DTT and NAC can conditionally rescue the activity of ATG4 in starved cells
As reactive oxygen species (ROS) can suppress ATG4 activity in vitro,Citation42 and dithiothreitol (DTT) and N-acetyl-L-cysteine (NAC) have antioxidant functions, we detected ATG4 activity in the presence or absence of DTT or NAC in living cells. As shown in Figure S7A and S7B, treatment with DTT or NAC alone for 40 min or 80 min didn't significantly alter the basal levels of LC3B-II (Fig. S7A) and F-D value (Fig. S7B) in NRK cells, suggesting that short-term treatment with the antioxidants alone has little effect on basal levels of LC3B-II and ATG4 activity. ROS analysis showed that the level of ROS markedly increased in NRK cells after starvation for 3 h, but not in the cells after starvation for 1 h or rapamycin-treated cells (Fig. S7C and D). DTT supplementation in the system did not change the activity of ATG4 in rapamycin-treated NRK cells ( and B). However, when DTT was added, the activity of ATG4 in EBSS-treated NRK cells was significantly enhanced at the 3 h timepoint but not at the 1 h timepoint ( and D). Similar results were also shown in EBSS-treated Namalwa cells (Fig. S7E). Moreover, NAC supplementation also significantly enhanced ATG4 activity at the 3 h timepoint in EBSS-treated NRK cells (Fig. S7F and G). These results indicated that DTT or NAC could conditionally rescue the activity of ATG4 in starved cells, which may be due to the DTT- or NAC-mediated inhibition of ROS. Furthermore, the fold induction of ATG4 activity detected with the DTT supplementation in EBSS-treated cells at the 3 h timepoint () was higher than that assayed with NAC addition (Fig. S7F and G), so we chose the DTT-containing system in the subsequent experiments.
Figure 5. DTT can conditionally rescue the activity of ATG4 in starved cells. (A and B) After treatment with 0.5 μM rapamycin for the indicated times, NRK cells were incubated with DMEM medium in the presence or absence of 2 mM DTT for 40 min. Then the cells were incubated with 0.5 μM AU4S or AG4R for 40 min. Subsequently, the cells were resuspended in PBS after 3 washes with medium, and then the fluorescence intensity was detected by flow cytometry (A) or with a fluorescence microplate reader (B). The F-D values were calculated and normalized as in and 4D. (C and D) After an overnight incubation in complete medium, NRK cells were cultured in EBSS medium for the indicated times. Then the cells were incubated with DMEM medium in the presence or absence of 2 mM DTT for 40 min. Subsequently, the cells were incubated with 0.5 μM AU4S or AG4R for 40 min, and then the fluorescence intensity was examined by flow cytometry (C) or with a fluorescence microplate reader (D) as in (A) and (B) respectively. Data are mean ± SD from 3 experiments. n.s.: no significance; *: P <0.05.
The activity of ATG4 detected with DTT supplementation parallels LC3B-II levels in the presence or absence of autophagy inhibitors
To evaluate the effect of autophagy inhibitors on ATG4 activity, 3-methyladenine (3-MA) and chloroquine (CQ) were separately added to EBSS-treated NRK cells. 3-MA represses autophagy by inhibiting the activity of the class III phosphatidylinositol 3-kinase (PtdIns3K),Citation43 whereas CQ blocks autophagic flux by preventing the fusion of autophagosomes and lysosomes.Citation44 As shown in , the F-D value of EBSS-treated cells analyzed with the detection system without DTT showed no significant change in the presence of 3-MA (), while it significantly increased in the presence of CQ (). Interestingly, the F-D value of the starved cells detected after DTT supplementation significantly decreased in the presence of 3-MA (), while it markedly increased in the presence of CQ (). Moreover, the starvation-induced LC3B-II accumulation in NRK cells was obviously suppressed by 3-MA (), while it was markedly enhanced by CQ (). These data indicated that the change of ATG4 activity detected with DTT supplementation paralleled the accumulation of LC3B-II in living cells in the presence or absence of autophagy inhibitors.
Figure 6. The activity of ATG4 detected after DTT supplementation parallels the LC3B-II level in the presence or absence of autophagy inhibitors. (A to D) NRK cells were treated with EBSS for 3 h in the presence or absence of the autophagy inhibitor 3-MA (5 mM) (A and C) or CQ (20 μM) (B and D). Then the cells were incubated with DMEM medium for 40 min in the presence or absence of 2 mM DTT, followed by an incubation with 0.5 μM AU4S or AG4R for 40 min. Subsequently, the fluorescence intensity was measured with a fluorescence microplate reader, and the F-D value was calculated and normalized as in . Data are mean ± SD from 3 experiments. n.s.: no significance; *: P <0.05. (E and F) NRK cells were treated as in (A) and (B), then the level of LC3B-II was assayed by immunoblot, using GAPDH as a loading control. One representative data set from 3 experiments is shown, including the ratio of LC3B-II/GAPDH.
The activity of ATG4 detected with DTT supplementation is positively correlated with LC3B-II accumulation in peripheral WBCs from leukemia patients
To investigate the correlation between ATG4 activity and LC3B-II level in human peripheral WBCs, 27 peripheral blood samples (from 10 healthy donors and 17 leukemia patients) were collected and WBCs were isolated subsequently. The information of the healthy donors and leukemia patients including age, sex, and diagnosis is listed in Table S1 and S2. The activity of ATG4 in WBCs was examined with or without DTT (). As shown in , when DTT was added, the F–D values were significantly increased in 2 samples from healthy donors (Nos. 3 and 9) and in 7 samples from leukemia patients (Nos. 3, 5, 7, 9, 12, 15, and 16), suggesting that ROS may affect ATG4 activity in human WBCs. Moreover, the accumulation of LC3B-II in the WBCs was revealed by immunoblot (). Regression analysis showed that the F-D values detected by the system without DTT were not correlated with the ratios of LC3B-II/GAPDH in the samples from both healthy donors (R2 = 0.0109, P = 0.7741) () and leukemia patients (R2 = 0.02272, P=0.5637) (). Interestingly, the F-D values detected with DTT supplementation were positively correlated with the ratios of LC3B-II/GAPDH in the samples from leukemia patients (R2 = 0.5288, P = 0.0009) (), but not in the samples from healthy donors (R2 = 0.01432, P = 0.7420) (). These data indicated that the activity of ATG4 detected with the DTT treatment exhibited a positive correlation with LC3B-II accumulation in WBCs from leukemia patients.
Figure 7. The activity of ATG4 detected after DTT supplementation is positively correlated with LC3B-II accumulation in peripheral WBCs from leukemia patients. (A and B) Peripheral WBCs from healthy donors (A) or leukemia patients (B) were cultured in DMEM medium in the presence or absence of 2 mM DTT for 40 min, and then incubated with 0.5 μM AU4S or AG4R at 37 ℃ for 40 min. Subsequently, the cells were resuspended in PBS after washed 3 times with medium, and the fluorescence values were detected with a fluorescence microplate reader. Then the F-D values were calculated and normalized as in . Data are mean ± SD from 3 experiments. (C and D) Peripheral WBCs from healthy donors (C) or leukemia patients (D) were lysed for the analysis of LC3B-II accumulation by immunoblot, using GAPDH as a loading control. One representative immunoblot data set from 3 experiments is shown, including the ratio of LC3B-II/GAPDH. (E and F) The correlations between the F-D values (from A and B) and the ratios of LC3B-II/GAPDH (from C and D) in peripheral WBCs of healthy donors (E) and leukemia patients (F) were analyzed separately. -DTT: the F–D value was assayed without DTT supplementation (E, a; F, a); +DTT: the F-D value was analyzed after DTT supplementation (E, b; F, b).
Discussion
In the present study, we designed a novel peptide AU4S for detecting ATG4 activity in living cells. AU4S can be recognized and cleaved by recombinant ATG4 proteins in vitro, and it can efficiently enter living cells. By using the ATG4-resistant peptide AG4R to eliminate background fluorescence, AU4S can be used to measure the ATG4 activity in living cells including cell lines and human peripheral WBCs from healthy donors and leukemia patients. Moreover, when DTT was added in the detection system, ATG4 activity parallels LC3B-II level in cultured cells and presents a positive correlation with the accumulation of LC3B-II in peripheral WBCs from leukemia patients (R2 = 0.5288). Our study provides a convenient, rapid, and quantitative method to monitor ATG4 activity in living cells, which would be helpful to autophagy research and even clinical tests.
The ATG4-recognized tetrapeptide GTFG alone cannot significantly enter living cells due to the barrier of the plasma membrane, which limits the passive transportation of the hydrophilic GTFG tetrapeptide.Citation45-46 Cell-penetrating peptides (CPPs) are a class of short peptides that can efficiently penetrate cell membranes and noninvasively transport different cargoes into cells.Citation47-48 With the help of CPPs, GTFG can easily enter living cells. The HIV Tat protein-derived oligopeptide “RKKRRQRRR” is a typical CPP which has been studied for nearly 20 y.Citation39-41 However, the mechanisms of Tat-mediated penetration are not well known yet. Previous studies have shown that clathrin-dependent endocytosis, caveolae-mediated endocytosis, macropinocytosis, and phagocytosis are involved in this process.Citation49-51 In this study, treatment with cytochalasin D (an inhibitor of actin polymerization which can block macropinocytosis) partially prevented AG4R from entering cells (Fig. S4), indicating that macropinocytosis may be a mechanism by which AG4R or AU4S penetrates the cell membrane. However, due to the diversity of Tat-mediated penetration, more inhibitors (such as the inhibitors of clathrin-dependent endocytosis and of caveolae-mediated endocytosis, etc.) should be used to investigate the detailed mechanisms in the further studies.
FITC is a common fluorophore that has been widely used in the research of molecular biology. The fluorescence intensity of fluorophores including FITC is positively correlated with the quantum yield at the fixed excitation wavelength. The chemical or physical characteristics of the fluorophore itself (such as conjugative effect) and surrounding environment (such as hydrophobic or hydrophilic conditions) can influence the quantum yield, leading to the change of fluorescence intensity.Citation52-58 So the potential hydrophilicity or hydrophobicity of the enzyme active site and the enzyme-catalyzed reaction can probably influence the fluorescent quantum yield.Citation59-65 In our study, the quantum yield of FITC markedly increased when AU4S but not AG4R was incubated with recombinant ATG4B at the 40 min timepoint, accompanied by an increase of fluorescence intensity ( and S1B). Then, along with the gradual hydrolysis of AU4S by recombinant ATG4B, the fluorescence intensity markedly decreased at 60 min and 80 min timepoints (). These results indicated that the recognization and cleavage of AU4S by ATG4 could be monitored in real time by detecting the change of FITC fluorescence.
ATG4 can not only promote the production of Atg8/LC3-I by hydrolyzing pro-Atg8/LC3, but also delipidate Atg8–PE/LC3-II from autophagosomes.Citation16, 19,29-30,33-34,66 As ATG4 plays dual roles in regulating the Atg8/LC3 system, the relationship between ATG4 activity and autophagy is complicated. Moderate activation of ATG4 can promote autophagy by recycling the Atg8/LC3 system effectively,Citation15-17 while overactivation of ATG4 may block autophagy by enhancing the delipidation of Atg8-PE/LC3-II.Citation29 Similarly, inactivation of ATG4 can also inhibit or enhance autophagy according to the different situations.Citation17,25,67 Indeed, the detailed mechanisms about this issue need further studies, and AU4S may be beneficial to the associated research.
It has been reported that ROS can inhibit ATG4 activity in vitro,Citation42 and DTT or NAC has an antioxidant role.Citation68-71 In the present study, we found that starvation treatment resulted in an increase of ROS, and DTT or NAC conditionally rescued the activity of ATG4 in starved cells. These results indicated that the antioxidants may enhance ATG4 activity by suppressing ROS function in living cells. The specific mechanisms may be related to ROS-mediated direct inhibition of the active sites of ATG4 proteases or its indirect suppression on the activity of ATG4 by several signaling pathways.Citation42,72-74 Moreover, we demonstrated that the activity of ATG4 measured by AU4S in the presence of DTT not only paralleled the levels of LC3B-II in starved cells, but also exhibited a positive correlation with LC3B-II conversion in the samples from leukemia patients. These results may be explained as follows: Stress such as starvation or drug treatments may activate ATG4 at an early stage, but the active ATG4 may be inhibited along with the accumulation of ROS. Therefore, the activity of ATG4 may be low due to the increased ROS, but the autophagy flux may still exist (at least, the level of LC3B-II may be still higher). After adding the antioxidant DTT or NAC, the activity of ATG4 could be partially rescued by suppressing ROS, which may let ATG4 activity parallel the level of LC3B-II. Of course, more studies are warranted regarding the detailing of molecular mechanisms. In addition, the fold induction of ATG4 activity detected with DTT in the EBSS-treated cells at the 3 h timepoint was higher than that assayed with the NAC-containing system, so we preferred to use DTT in this study in order to improve the sensitivity of measurements. As to the reason(s) for the difference of ATG4 activity in the presence of DTT and NAC, they are currently not elucidated. It has been reported that the antioxidant mechanisms of DTT and NAC may be different in living cells,Citation68-70,75-77 which may (at least partially) account for the difference. Moreover, DTT is potentially an endoplasmic reticulum stress inducer,Citation78-80 suggesting that ROS-independent effect (such as endoplasmic reticulum stress) may be also involved in the regulation of ATG4 activity, which is interesting and needs to be further investigated.
In conclusion, we demonstrated that AU4S is a unique tool to detect the activity of ATG4 proteases in living cells including cultured cells and human peripheral WBCs, which may be beneficial to basic and clinical research on autophagy.
Materials and Methods
Synthesis of peptides
The AU4S, AG4R, GTFG-FITC, and “Ac-RKKRRQRRR-GTFG” peptides were synthesized and purified (with more than 95% purity) by Apeptide limited company. The purity and molecular weight of the peptides were confirmed by liquid chromatography-mass spectrum (LC-MS). AU4S consists of the CPP “RKKRRQRRR,” ATG4-recognized sequence “GTFG,” and the fluorophore FITC. “GTFG-FITC” doesn't contain “RKKRRQRRR.” “Ac-RKKRRQRRR-GTFG” has no FITC. AG4R consists of “RKKRRQRRR," the ATG4-nonrecognized sequence “GTFA” (the C-terminal “G” residue in “GTFG” is mutated to “A”) and FITC. All the peptides were labeled by an acetyl (Ac) group at the N terminus in order to increase the stability. Furthermore, all the peptides were dissolved in sterilized double-distilled H2O in a suitable volume and stored at −80°C. In addition, the fluorescence spectrograms of AU4S at the excitation wavelengths 480 nm, 488 nm and 495 nm were separately recorded with a PerkinElmer LS55 fluorescence spectrometer (PerkinElmer, Waltham, MA, USA) in 1 ml reaction buffer (50 mM Tris-HCl, pH 8.0, 2 mM DTT, 1.2 M sodium citrate) at the final concentration of 0.2 μM.
Expression and purification of recombinant human ATG4 proteins
The total RNA was extracted from human peripheral WBCs, and the cDNAs for human ATG4 (including ATG4A, ATG4B, ATG4C, and ATG4D) were amplified by RT-PCR. The PCR products were separately cloned into prokaryotic expression vector pET-28a (Novogen, 69864-3) in-frame with a His tag at the N terminus, and then transformed into E. coli BL21(DE3) (Invitrogen, C6010-03). The recombinant proteins were induced by 0.1 mM isopropyl β-D-1-thiogalactopyranoside/IPTG at 16°C for 6 h. Subsequently, the His-tagged ATG4 proteins were purified using Ni-NTA-agarose (Qiagen, 30250) and eluted with a 20 to 250 mM gradient of imidazole in 10 mM HEPES, pH 7.4, 150 mM NaCl, 10 mM β-mercaptoethanol. Then the purified recombinant proteins were identified by SDS-PAGE.
Analyzing the specificity of the synthetic peptides to recombinant ATG4 proteases
The recombinant ATG4 proteases (or ATG4B) were separately incubated with the synthetic peptides (AU4S, AG4R, or GTFG-FITC) in 200 μl reaction buffer (50 mM Tris-HCl, pH 8.0, 2 mM DTT, 1.2 M sodium citrate) at 37°C in darkness in the presence or absence of the FITC-uncoupled peptide “Ac-RKKRRQRRR-GTFG” or protease inhibitors cocktail (Roche, 11697498001) and PMSF (Abcam, ab141032). The fluorescence intensity was monitored kinetically with a fluorescence microplate reader (SpectraMax Gemini XPS, Sunnyvale, CA, USA) at excitation/emission wavelength 488 nm/521 nm.
Cell culture and treatment
The normal rat kidney cell line NRK (ATCC, CRL-6509) and human Burkitt's lymphoma cell line Namalwa (ATCC, CRL-1432) were obtained from American Type Culture Collection, and cultured in DMEM (for NRK cells; Hyclone, SH30022.01B) or RPMI 1640 (for Namalwa cells; Hyclone, SH30809.01B) medium supplemented with 10% fetal bovine serum, 100 mg/ml streptomycin and 100 U/ml penicillin at 37°C in an atmosphere with 5% CO2. To induce starvation, the cells were grown overnight in complete medium and then cultured in EBSS (Hyclone, SH30029.02) medium for the indicated times.
Evaluation of cell viability
Cell viability was evaluated with CCK-8 kit (Dojindo Laboratories, CK04). Briefly, cells were seeded in 96-well plates at a density of 2 × 10³ cells per well and cultured overnight. Subsequently, different concentrations of AU4S were added to the cells and incubated for the indicated times. Then the CCK-8 reagent was added to the cells according to the manufacturer's protocol, and incubated in the darkness for 60 min. Finally, the absorption value at 450 nm was detected with a Multiskan Spectrum 1500 Microplate Spectrophotometer (Thermo Scientific, Waltham, MA, USA).
Immunoblot assay
The level of LC3B-II was examined by immunoblot as described.Citation81 Antibodies against LC3B (2775) and GAPDH (sc-137179) were respectively purchased from Cell Signaling Technology and Santa Cruz Biotechnology. Horseradish peroxidase-labeled goat anti-rabbit IgG (31466) and the ECL chemiluminescence kit (32209) were purchased from Thermo Scientific.
Isolation of human peripheral WBCs
Peripheral blood samples of healthy donors were from Department of Prevention and Health, Southwest Hospital (Chongqing, China), while the blood samples of leukemia patients were from Department of Hematology, Xinqiao Hospital (Chongqing, China). Peripheral WBCs were separated from whole blood samples with red blood cell lysis buffer (Tiangen, RT122-01). Briefly, 3.5 ml red blood cell lysis buffer was added to a 1 ml whole blood sample in a 5 ml microcentrifuge tube. After inverting the tube several times, the mixture was placed at room temperature for 5 min. Then WBCs were isolated by centrifugation and washed with phosphate-buffered saline (PBS; Boster, PYG0021). Subsequently, the isolated WBCs were separately incubated with AU4S and AG4R for F-D value calculation. Meanwhile, the immunoblot analysis was performed to examine the level of LC3B-II in the WBCs.
Induction of autophagy in cultured cells and animal tissues
To induce autophagy in cultured cells, NRK cells were treated with EBSS or 0.5 μM rapamycin (Kinasechem, K1083) for different times, while Namalwa cells were treated with EBSS for 3 h. To induce autophagy in animal tissues, 6 Sprague-Dawley (SD) rats (8-wk-old, 180 to 220 g) were obtained from the experimental animal center of the Third Military Medical University (Chongqing, China) and housed at 25°C on a 12-h light/dark cycle. Three rats were just given enough water for starvation induction, taking another 3 rats as control fed with a standard laboratory food and water. After 48 h, all rats were sacrificed and tissues including liver, skeletal muscle, heart, brain, and WBCs were collected for further studies.
Measuring the F–D values in the lysates of cells and tissues
NRK and Namalwa cells were harvested in PBS, while animal tissues were sufficiently ground and washed with 0.9% NaCl. Then the harvested cultured cells and the cells from animal tissues were separately suspended in lysis buffer (10 mM HEPES, 10 mM KCl, 1.5 mM MgCl2, 0.5 mM DTT, 0.05% NP40 (Sigma-Aldrich, 74385), pH 8.0) on ice for 15 min. After centrifugation, the supernatant fraction was collected. Subsequently, the equivalent volume of lysates was respectively incubated with 0.2 μM AU4S or AG4R in 200 μl reaction buffer (50 mM Tris-HCl, pH 8.0, 2 mM DTT, 1.2 M sodium citrate) at 37°C for 40 min in darkness. Then the fluorescence value was detected with a fluorescence microplate reader at excitation/emission wavelength 488 nm/521 nm. The difference between the AU4S- and AG4R-measured fluorescence values in the same sample was calculated and defined as F-D value, which reflects the activity of ATG4 proteases. Meanwhile, the protein concentration for each sample was quantified by Bradford assay, and the F-D value was normalized by the amount of protein (a.u./mg protein).
Measuring the F–D value in living cells without DTT supplementation
Cells were cultured in DMEM medium with 0.5 μM AU4S or AG4R at 37°C for 40 min in the darkness. Then the cells were resuspended in PBS after washed 3 times with medium, and the fluorescence value was detected with a fluorescence microplate reader at excitation/emission wavelength 488 nm/521 nm or a flow cytometer (FACSCalibur, BD Biosciences, San Jose, CA, USA) on the FL1-H channel. The F-D value (the difference between AU4S- and AG4R-measured fluorescence values in the same sample) was calculated. When detected by fluorescence microplate reader, the F-D value was normalized by the amount of protein (a.u./mg protein). While in the flow cytometry analysis, the mean fluorescence value of 1×10⁴ cells was measured. The F–D value was calculated, and the corresponding F–D value×100 was shown in the Figures. The fluorescence value of 100 cells = the mean fluorescence value per cell × 100.
Measuring the F-D value in living cells supplemented with DTT
Cells were incubated with DMEM medium in the presence or absence of 2 mM DTT for 40 min, and then incubated with 0.5 μM AU4S or AG4R at 37°C for 40 min in the darkness. The subsequent protocol and the calculation of F–D value were the same with that described in “Measuring the F-D value in living cells without DTT supplementation.”
Measurement of total intracellular ROS
After an overnight incubation in complete medium, NRK cells were cultured in EBSS medium for the indicated times. Subsequently, the cells were washed 3 times with PBS and then incubated with the DCFH-DA fluorescent probe (Beyotime, S0033) for 25 min at 37°C in darkness according to the manufacturer's protocol. After 2 washes with PBS, the fluorescent intensity was quantified with a fluorescence microplate reader at excitation/emission wavelength 488 nm/525 nm. The level of intracellular ROS was shown as fold induction by normalizing the fluorescent value of the tested sample to that of the corresponding control sample, taking the fluorescent value of the corresponding control sample as “1.”
Statistical analysis
All data were expressed as mean ± SD (standard deviation) from at least 3 independent experiments. The Student t test was used for the analysis of difference between 2 groups, and one-way ANOVA with the post hoc Tukey test was used for the analysis of difference among 3 or more groups. The correlation between F-D value and LC3B-II level was analyzed by the Pearson test. P < 0.05 was considered statistically significant.
Disclosure of Potential Conflicts of Interest
No potential conflicts of interest were disclosed.
Supplemental Material
Supplemental data for this article can be accessed on the publisher's website.
SupplementaryFigures.zip
Download Zip (818 KB)Funding
This work was supported by the National Natural Science Foundation of China (81273226, 31201068 and 81228005), Chongqing Natural Science Foundation (cstc2013jjB10015 and cstc2014jcyjA10110), and the Scientific Funds of Third Military Medical University (2012XZH01).
References
- Klionsky DJ. Autophagy: from phenomenology to molecular understanding in less than a decade. Nat Rev Mol Cell Biol 2007; 8:931-7; PMID:17712358; http://dx.doi.org/10.1038/nrm2245
- Mizushima N. Autophagy: process and function. Genes Dev 2007; 21:2861-73; PMID:18006683; http://dx.doi.org/10.1101/gad.1599207
- Levine B. Autophagy in development, tumor suppression, and innate immunity. Harvey Lect 2003; 99:47-76; PMID:15984551
- Levine B, Deretic V. Unveiling the roles of autophagy in innate and adaptive immunity. Nat Rev Immunol 2007; 7:767-77; PMID:17767194; http://dx.doi.org/10.1038/nri2161
- Deretic V. Autophagy in innate and adaptive immunity. Trends Immunol 2005; 26:523-8; PMID:16099218; http://dx.doi.org/10.1016/j.it.2005.08.003
- Rubinsztein DC, Marino G, Kroemer G. Autophagy and aging. Cell 2011; 146:682-95; PMID:21884931; http://dx.doi.org/10.1016/j.cell.2011.07.030
- Fulda S. Autophagy and cell death. Autophagy 2012; 8:1250-1; PMID:22575893; http://dx.doi.org/10.4161/auto.20669
- Zhang Y, Morgan MJ, Chen K, Choksi S, Liu ZG. Induction of autophagy is essential for monocyte-macrophage differentiation. Blood 2012; 119:2895-905; PMID:22223827; http://dx.doi.org/10.1182/blood-2011-08-372383
- Komatsu M, Waguri S, Chiba T, Murata S, Iwata J, Tanida I, Ueno T, Koike M, Uchiyama Y, Kominami E, et al. Loss of autophagy in the central nervous system causes neurodegeneration in mice. Nature 2006; 441:880-4; PMID:16625205; http://dx.doi.org/10.1038/nature04723
- Levine B. Cell biology: autophagy and cancer. Nature 2007; 446:745-7; PMID:17429391; http://dx.doi.org/10.1038/446745a
- Mijaljica D, Prescott M, Devenish RJ. Autophagy in disease. Methods Mol Biol 2010; 648:79-92; PMID:20700706; http://dx.doi.org/10.1007/978-1-60761-756-3_5
- Deretic V, Saitoh T, Akira S. Autophagy in infection, inflammation and immunity. Nat Rev Immunol 2013; 13:722-37; PMID:24064518; http://dx.doi.org/10.1038/nri3532
- Lavandero S, Troncoso R, Rothermel BA, Martinet W, Sadoshima J, Hill JA. Cardiovascular autophagy: concepts, controversies, and perspectives. Autophagy 2013; 9:1455-66; PMID:23959233; http://dx.doi.org/10.4161/auto.25969
- Song Y, Zhao Y, Wang F, Tao L, Xiao J, Yang C. Autophagy in hepatic fibrosis. Biomed Res Int 2014; 2014:436242; PMID:24779010
- Nakatogawa H, Ichimura Y, Ohsumi Y. Atg8, a ubiquitin-like protein required for autophagosome formation, mediates membrane tethering and hemifusion. Cell 2007; 130:165-78; PMID:17632063; http://dx.doi.org/10.1016/j.cell.2007.05.021
- Yu ZQ, Ni T, Hong B, Wang HY, Jiang FJ, Zou S, Chen Y, Zheng XL, Klionsky DJ, Liang Y, et al. Dual roles of Atg8-PE deconjugation by Atg4 in autophagy. Autophagy 2012; 8:883-92; PMID:22652539; http://dx.doi.org/10.4161/auto.19652
- Nair U, Yen WL, Mari M, Cao Y, Xie Z, Baba M, Reggiori F, Klionsky DJ. A role for Atg8-PE deconjugation in autophagosome biogenesis. Autophagy 2012; 8:780-93; PMID:22622160; http://dx.doi.org/10.4161/auto.19385
- Nakatogawa H, Ishii J, Asai E, Ohsumi Y. Atg4 recycles inappropriately lipidated Atg8 to promote autophagosome biogenesis. Autophagy 2012; 8:177-86; PMID:22240591; http://dx.doi.org/10.4161/auto.8.2.18373
- Marino G, Uria JA, Puente XS, Quesada V, Bordallo J, Lopez-Otin C. Human autophagins, a family of cysteine proteinases potentially implicated in cell degradation by autophagy. J Biol Chem 2003; 278:3671-8; PMID:12446702; http://dx.doi.org/10.1074/jbc.M208247200
- Cabrera S, Fernandez AF, Marino G, Aguirre A, Suarez MF, Espanol Y, Vega JA, Laurà R, Fueyo A, Fernández-García MS, et al. ATG4B/autophagin-1 regulates intestinal homeostasis and protects mice from experimental colitis. Autophagy 2013; 9:1188-200; PMID:23782979; http://dx.doi.org/10.4161/auto.24797
- Kuang E, Okumura CY, Sheffy-Levin S, Varsano T, Shu VC, Qi J, Niesman IR, Yang HJ, López-Otín C, Yang WY, et al. Regulation of ATG4B stability by RNF5 limits basal levels of autophagy and influences susceptibility to bacterial infection. PLoS Genet 2012; 8:e1003007; PMID:23093945; http://dx.doi.org/10.1371/journal.pgen.1003007
- Proenca CC, Stoehr N, Bernhard M, Seger S, Genoud C, Roscic A, Paganetti P, Liu S, Murphy LO, Kuhn R, et al. Atg4b-dependent autophagic flux alleviates Huntington's disease progression. PLoS One 2013; 8:e68357; PMID:23861892; http://dx.doi.org/10.1371/journal.pone.0068357
- Tran E, Chow A, Goda T, Wong A, Blakely K, Rocha M, Taeb S, Hoang VC, Liu SK, Emmenegger U. Context-dependent role of ATG4B as target for autophagy inhibition in prostate cancer therapy. Biochem Biophys Res Commun 2013; 441:726-31; PMID:24184480; http://dx.doi.org/10.1016/j.bbrc.2013.10.117
- Betin VM, Singleton BK, Parsons SF, Anstee DJ, Lane JD. Autophagy facilitates organelle clearance during differentiation of human erythroblasts: evidence for a role for ATG4 paralogs during autophagosome maturation. Autophagy 2013; 9:881-93; PMID:23508006; http://dx.doi.org/10.4161/auto.24172
- Li Y, Luo Q, Yuan L, Miao C, Mu X, Xiao W, Li J, Sun T, Ma E. JNK-dependent Atg4 upregulation mediates asperphenamate derivative BBP-induced autophagy in MCF-7 cells. Toxicol Appl Pharmacol 2012; 263:21-31; PMID:22668848; http://dx.doi.org/10.1016/j.taap.2012.05.018
- Farfariello V, Amantini C, Santoni G. Transient receptor potential vanilloid 1 activation induces autophagy in thymocytes through ROS-regulated AMPK and Atg4C pathways. J Leukoc Biol 2012; 92:421-31; PMID:22753949; http://dx.doi.org/10.1189/jlb.0312123
- Korkmaz G, le Sage C, Tekirdag KA, Agami R, Gozuacik D. miR-376b controls starvation and mTOR inhibition-related autophagy by targeting ATG4C and BECN1. Autophagy 2012; 8:165-76; PMID:22248718; http://dx.doi.org/10.4161/auto.8.2.18351
- Marino G, Salvador-Montoliu N, Fueyo A, Knecht E, Mizushima N, Lopez-Otin C. Tissue-specific autophagy alterations and increased tumorigenesis in mice deficient in Atg4C/autophagin-3. J Biol Chem 2007; 282:18573-83; PMID:17442669; http://dx.doi.org/10.1074/jbc.M701194200
- Tanida I, Sou YS, Ezaki J, Minematsu-Ikeguchi N, Ueno T, Kominami E. HsAtg4B/HsApg4B/autophagin-1 cleaves the carboxyl termini of three human Atg8 homologues and delipidates microtubule-associated protein light chain 3- and GABAA receptor-associated protein-phospholipid conjugates. J Biol Chem 2004; 279:36268-76; PMID:15187094; http://dx.doi.org/10.1074/jbc.M401461200
- Satoo K, Noda NN, Kumeta H, Fujioka Y, Mizushima N, Ohsumi Y, Inagaki F. The structure of Atg4B-LC3 complex reveals the mechanism of LC3 processing and delipidation during autophagy. EMBO J 2009; 28:1341-50; PMID:19322194; http://dx.doi.org/10.1038/emboj.2009.80
- Li M, Hou Y, Wang J, Chen X, Shao ZM, Yin XM. Kinetics comparisons of mammalian Atg4 homologues indicate selective preferences toward diverse Atg8 substrates. J Biol Chem 2011; 286:7327-38; PMID:21177865; http://dx.doi.org/10.1074/jbc.M110.199059
- Shu CW, Drag M, Bekes M, Zhai D, Salvesen GS, Reed JC. Synthetic substrates for measuring activity of autophagy proteases: autophagins (Atg4). Autophagy 2010; 6:936-47; PMID:20818167; http://dx.doi.org/10.4161/auto.6.7.13075
- Kabeya Y, Mizushima N, Yamamoto A, Oshitani-Okamoto S, Ohsumi Y, Yoshimori T. LC3, GABARAP and GATE16 localize to autophagosomal membrane depending on form-II formation. J Cell Sci 2004; 117:2805-12; PMID:15169837; http://dx.doi.org/10.1242/jcs.01131
- Hemelaar J, Lelyveld VS, Kessler BM, Ploegh HL. A single protease, Apg4B, is specific for the autophagy-related ubiquitin-like proteins GATE-16, MAP1-LC3, GABARAP, and Apg8L. J Biol Chem 2003; 278:51841-50; PMID:14530254; http://dx.doi.org/10.1074/jbc.M308762200
- Klionsky DJ, Abdalla FC, Abeliovich H, Abraham RT, Acevedo-Arozena A, Adeli K, Agholme L, Agnello M, Agostinis P, Aguirre-Ghiso JA, et al. Guidelines for the use and interpretation of assays for monitoring autophagy. Autophagy 2012; 8:445-544; PMID:22966490; http://dx.doi.org/10.4161/auto.19496
- Li M, Chen X, Ye QZ, Vogt A, Yin XM. A high-throughput FRET-based assay for determination of Atg4 activity. Autophagy 2012; 8:401-12; PMID:22302004; http://dx.doi.org/10.4161/auto.18777
- Choi KM, Nam HY, Na JH, Kim SW, Kim SY, Kim K, Kwon IC, Ahn HJ. A monitoring method for Atg4 activation in living cells using peptide-conjugated polymeric nanoparticles. Autophagy 2011; 7:1052-62; PMID:21610316; http://dx.doi.org/10.4161/auto.7.9.16451
- Mayoral A, Barron H, Estrada-Salas R, Vazquez-Duran A, Jose-Yacaman M. Nanoparticle stability from the nano to the meso interval. Nanoscale 2010; 2:335-42; PMID:20644815; http://dx.doi.org/10.1039/b9nr00287a
- Frankel AD, Pabo CO. Cellular uptake of the tat protein from human immunodeficiency virus. Cell 1988; 55:1189-93; PMID:2849510; http://dx.doi.org/10.1016/0092-8674(88)90263-2
- Fawell S, Seery J, Daikh Y, Moore C, Chen LL, Pepinsky B, Barsoum J. Tat-mediated delivery of heterologous proteins into cells. Proc Natl Acad Sci U S A 1994; 91:664-8; PMID:8290579; http://dx.doi.org/10.1073/pnas.91.2.664
- Vives E, Brodin P, Lebleu B. A truncated HIV-1 Tat protein basic domain rapidly translocates through the plasma membrane and accumulates in the cell nucleus. J Biol Chem 1997; 272:16010-7; PMID:9188504; http://dx.doi.org/10.1074/jbc.272.25.16010
- Scherz-Shouval R, Shvets E, Fass E, Shorer H, Gil L, Elazar Z. Reactive oxygen species are essential for autophagy and specifically regulate the activity of Atg4. EMBO J 2007; 26:1749-60; PMID:17347651; http://dx.doi.org/10.1038/sj.emboj.7601623
- Wu YT, Tan HL, Shui G, Bauvy C, Huang Q, Wenk MR, Ong CN, Codogno P, Shen HM. Dual role of 3-methyladenine in modulation of autophagy via different temporal patterns of inhibition on class I and III phosphoinositide 3-kinase. J Biol Chem 2010; 285:10850-61; PMID:20123989; http://dx.doi.org/10.1074/jbc.M109.080796
- Zois CE, Giatromanolaki A, Sivridis E, Papaiakovou M, Kainulainen H, Koukourakis MI. “Autophagic flux" in normal mouse tissues: focus on endogenous LC3A processing. Autophagy 2011; 7:1371-8; PMID:21997374; http://dx.doi.org/10.4161/auto.7.11.16664
- Wadia JS, Dowdy SF. Modulation of cellular function by TAT mediated transduction of full length proteins. Curr Protein Pept Sci 2003; 4:97-104; PMID:12678849; http://dx.doi.org/10.2174/1389203033487289
- Burton PS, Conradi RA, Ho NF, Hilgers AR, Borchardt RT. How structural features influence the biomembrane permeability of peptides. J Pharm Sci 1996; 85:1336-40; PMID:8961149; http://dx.doi.org/10.1021/js960067d
- Zorko M, Langel U. Cell-penetrating peptides: mechanism and kinetics of cargo delivery. Adv Drug Deliv Rev 2005; 57:529-45; PMID:15722162; http://dx.doi.org/10.1016/j.addr.2004.10.010
- Richard JP, Melikov K, Vives E, Ramos C, Verbeure B, Gait MJ, Chernomordik LV, Lebleu B. Cell-penetrating peptides. A reevaluation of the mechanism of cellular uptake. J Biol Chem 2003; 278:585-90; PMID:12411431; http://dx.doi.org/10.1074/jbc.M209548200
- Wadia JS, Stan RV, Dowdy SF. Transducible TAT-HA fusogenic peptide enhances escape of TAT-fusion proteins after lipid raft macropinocytosis. Nat Med 2004; 10:310-5; PMID:14770178; http://dx.doi.org/10.1038/nm996
- Eguchi A, Akuta T, Okuyama H, Senda T, Yokoi H, Inokuchi H, Fujita S, Hayakawa T, Takeda K, Hasegawa M, et al. Protein transduction domain of HIV-1 Tat protein promotes efficient delivery of DNA into mammalian cells. J Biol Chem 2001; 276:26204-10; PMID:11346640; http://dx.doi.org/10.1074/jbc.M010625200
- Li GH, Li W, Mumper RJ, Nath A. Molecular mechanisms in the dramatic enhancement of HIV-1 Tat transduction by cationic liposomes. FASEB J 2012; 26:2824-34; PMID:22447980; http://dx.doi.org/10.1096/fj.11-203315
- Miyazaki M, Yoshida S, Sakai K, Zhang QZ, Takeshita M. Quantification of concanavalin A binding to rat brain microsomal membranes detected by fluorescence polarization technique. Biochim Biophys Acta 1998; 1370:235-42; PMID:9545569; http://dx.doi.org/10.1016/S0005-2736(97)00268-X
- Yamaguchi Y, Matsubara Y, Ochi T, Wakamiya T, Yoshida Z. How the pi conjugation length affects the fluorescence emission efficiency. J Am Chem Soc 2008; 130:13867-9; PMID:18816053; http://dx.doi.org/10.1021/ja8040493
- Niu SL, Massif C, Ulrich G, Ziessel R, Renard PY, Romieu A. Water-solubilisation and bio-conjugation of a red-emitting BODIPY marker. Org Biomol Chem 2011; 9:66-9; PMID:21088764; http://dx.doi.org/10.1039/c0ob00693a
- Li CH, Tu SC. Active site hydrophobicity is critical to the bioluminescence activity of Vibrio harveyi luciferase. Biochemistry 2005; 44:12970-7; PMID:16185065; http://dx.doi.org/10.1021/bi050935y
- Wang R, Deng L, Zhang T, Li J. Substituent effect on the photophysical properties, electrochemical properties and electroluminescence performance of orange-emitting iridium complexes. Dalton Trans 2012; 41:6833-41; PMID:22517492; http://dx.doi.org/10.1039/c2dt12206e
- Dobek K. The influence of temperature on Coumarin 153 fluorescence kinetics. J Fluoresc 2011; 21:1547-57; PMID:21246263; http://dx.doi.org/10.1007/s10895-011-0843-1
- Suresh D, Lopes PS, Ferreira B, Figueira CA, Gomes CS, Gomes PT, Di Paolo RE, Maçanita AL, Duarte MT, Charas A, et al. Tunable fluorophores based on 2-(N-arylimino)pyrrolyl chelates of diphenylboron: synthesis, structure, photophysical characterization, and application in OLEDs. Chemistry 2014; 20:4126-40; PMID:24634317; http://dx.doi.org/10.1002/chem.201303607
- Mocz G, Ross JA. Fluorescence techniques in analysis of protein-ligand interactions. Methods Mol Biol 2013; 1008:169-210; PMID:23729253; http://dx.doi.org/10.1007/978-1-62703-398-5_7
- Venkatraman P, Nguyen TT, Sainlos M, Bilsel O, Chitta S, Imperiali B, Stern LJ. Fluorogenic probes for monitoring peptide binding to class II MHC proteins in living cells. Nat Chem Biol 2007; 3:222-8; PMID:17351628; http://dx.doi.org/10.1038/nchembio868
- Montano SJ, Lu J, Gustafsson TN, Holmgren A. Activity assays of mammalian thioredoxin and thioredoxin reductase: fluorescent disulfide substrates, mechanisms, and use with tissue samples. Anal Biochem 2014; 449:139-46; PMID:24374250; http://dx.doi.org/10.1016/j.ab.2013.12.025
- Ren X, Yang L, Tang F, Yan C, Ren J. Enzyme biosensor based on NAD-sensitive quantum dots. Biosens Bioelectron 2010; 26:271-4; PMID:20627509; http://dx.doi.org/10.1016/j.bios.2010.05.014
- Alander J, Johansson K, Heuser VD, Farebo H, Jarvliden J, Abe H, Shibata A, Ito M, Ito Y, Morgenstern R. Characterization of a new fluorogenic substrate for microsomal glutathione transferase 1. Anal Biochem 2009; 390:52-6; PMID:19348782; http://dx.doi.org/10.1016/j.ab.2009.03.046
- Lin JH, Tseng WL. A method for fluorescence sensing of adenosine and alkaline phosphatase based on the inhibition of S-adenosylhomocysteine hydrolase activity. Biosens Bioelectron 2013; 41:379-85; PMID:23040372; http://dx.doi.org/10.1016/j.bios.2012.08.059
- Sartor G, Pagani R, Ferrari E, Sorbi RT, Cavaggioni A, Cavatorta P, Spisni A. Determining the binding capability of the mouse major urinary proteins using 2-naphthol as a fluorescent probe. Anal Biochem 2001; 292:69-75; PMID:11319819; http://dx.doi.org/10.1006/abio.2001.5065
- Wang W, Chen Z, Billiar TR, Stang MT, Gao W. The carboxyl-terminal amino acids render pro-human LC3B migration similar to lipidated LC3B in SDS-PAGE. PLoS One 2013; 8:e74222; PMID:24040206; http://dx.doi.org/10.1371/journal.pone.0074222
- Rothe K, Lin H, Lin KB, Leung A, Wang HM, Malekesmaeili M, Brinkman RR, Forrest DL, Gorski SM, Jiang X. The core autophagy protein ATG4B is a potential biomarker and therapeutic target in CML stem/progenitor cells. Blood 2014; 123:3622-34; PMID:24755409; http://dx.doi.org/10.1182/blood-2013-07-516807
- De Vries N, De Flora S. N-acetyl-l-cysteine. J Cell Biochem Suppl 1993; 17F:270-7; PMID:8412205; http://dx.doi.org/10.1002/jcb.240531040
- Sen CK. Redox signaling and the emerging therapeutic potential of thiol antioxidants. Biochem Pharmacol 1998; 55:1747-58; PMID:9714292; http://dx.doi.org/10.1016/S0006-2952(97)00672-2
- Sun Y, Oberley LW. The inhibition of catalase by glutathione. Free Radic Biol Med 1989; 7:595-602; PMID:2559882; http://dx.doi.org/10.1016/0891-5849(89)90140-8
- Chen M, Hein S, Le DQ, Feng W, Foss M, Kjems J, Besenbacher F, Zou X, Bünger C. Free radicals generated by tantalum implants antagonize the cytotoxic effect of doxorubicin. Int J Pharm 2013; 448:214-20; PMID:23538094; http://dx.doi.org/10.1016/j.ijpharm.2013.03.041
- Kaminskyy VO, Zhivotovsky B. Free radicals in cross talk between autophagy and apoptosis. Antioxid Redox Signal 2014; 21:86-102; PMID:24359220; http://dx.doi.org/10.1089/ars.2013.5746
- Li ZY, Yang Y, Ming M, Liu B. Mitochondrial ROS generation for regulation of autophagic pathways in cancer. Biochem Biophys Res Commun 2011; 414:5-8; PMID:21951851; http://dx.doi.org/10.1016/j.bbrc.2011.09.046
- Filomeni G, Desideri E, Cardaci S, Rotilio G, Ciriolo MR. Under the ROS…thiol network is the principal suspect for autophagy commitment. Autophagy 2010; 6:999-1005; PMID:20639698; http://dx.doi.org/10.4161/auto.6.7.12754
- Rafeiro E, Barr SG, Harrison JJ, Racz WJ. Effects of N-acetylcysteine and dithiothreitol on glutathione and protein thiol replenishment during acetaminophen-induced toxicity in isolated mouse hepatocytes. Toxicology 1994; 93:209-24; PMID:7974515; http://dx.doi.org/10.1016/0300-483X(94)90079-5
- Parasassi T, Brunelli R, Costa G, De Spirito M, Krasnowska E, Lundeberg T, Pittaluga E, Ursini F. Thiol redox transitions in cell signaling: a lesson from N-acetylcysteine. ScientificWorldJournal 2010; 10:1192-202; PMID:20602078; http://dx.doi.org/10.1100/tsw.2010.104
- Lopes de Almeida JP, Saldanha C. Dithiothreitol revisited in red cells: a new head for an old hat. Clin Hemorheol Microcirc 2010; 46:51-6; PMID:20852362
- Chaubey S, Grover M, Tatu U. Endoplasmic reticulum stress triggers gametocytogenesis in the malaria parasite. J Biol Chem 2014; 289:16662-74; PMID:24755215; http://dx.doi.org/10.1074/jbc.M114.551549
- Li B, Yi P, Zhang B, Xu C, Liu Q, Pi Z, Xu X, Chevet E, Liu J. Differences in endoplasmic reticulum stress signalling kinetics determine cell survival outcome through activation of MKP-1. Cell Signal 2011; 23:35-45; PMID:20727407; http://dx.doi.org/10.1016/j.cellsig.2010.07.019
- Lai CW, Aronson DE, Snapp EL. BiP availability distinguishes states of homeostasis and stress in the endoplasmic reticulum of living cells. Mol Biol Cell 2010; 21:1909-21; PMID:20410136; http://dx.doi.org/10.1091/mbc.E09-12-1066
- Ni Z, Wang B, Dai X, Ding W, Yang T, Li X, Lewin S, Xu L, Lian J, He F. HCC cells with high levels of Bcl-2 are resistant to ABT-737 via activation of the ROS-JNK-autophagy pathway. Free Radic Biol Med 2014; 70:194-203; PMID:24576507; http://dx.doi.org/10.1016/j.freeradbiomed.2014.02.012