
Abstract
In liver the mitochondrial sirtuin, SIRT5, controls ammonia detoxification by regulating CPS1, the first enzyme of the urea cycle. However, while SIRT5 is ubiquitously expressed, urea cycle and CPS1 are only present in the liver and, to a minor extent, in the kidney. To address the possibility that SIRT5 is involved in ammonia production also in nonliver cells, clones of human breast cancer cell lines MDA-MB-231 and mouse myoblast C2C12, overexpressing or silenced for SIRT5 were produced. Our results show that ammonia production increased in SIRT5-silenced and decreased in SIRT5-overexpressing cells. We also obtained the same ammonia increase when using a new specific inhibitor of SIRT5 called MC3482. SIRT5 regulates ammonia production by controlling glutamine metabolism. In fact, in the mitochondria, glutamine is transformed in glutamate by the enzyme glutaminase, a reaction producing ammonia. We found that SIRT5 and glutaminase coimmunoprecipitated and that SIRT5 inhibition resulted in an increased succinylation of glutaminase. We next determined that autophagy and mitophagy were increased by ammonia by measuring autophagic proteolysis of long-lived proteins, increase of autophagy markers MAP1LC3B, GABARAP, and GABARAPL2, mitophagy markers BNIP3 and the PINK1-PARK2 system as well as mitochondrial morphology and dynamics. We observed that autophagy and mitophagy increased in SIRT5-silenced cells and in WT cells treated with MC3482 and decreased in SIRT5-overexpressing cells. Moreover, glutaminase inhibition or glutamine withdrawal completely prevented autophagy. In conclusion we propose that the role of SIRT5 in nonliver cells is to regulate ammonia production and ammonia-induced autophagy by regulating glutamine metabolism.
Abbreviations:
- ACTB, actin, β
- ATG, autophagy-related
- BNIP3, BCL2/adenovirus E1B 19kDa interacting protein 3
- BPTES, bis-2-(5-phenylacetamido-1, 3, 4-thiadiazol-2-yl)ethyl sulfide
- COX4I1, cytochrome c oxidase subunit IV isoform 1
- CPS1, carbamoyl-phosphate synthase 1, mitochondrial
- GABARAP, GABA(A) receptor-associated protein
- GABARAPL2, GABA(A) receptor-associated protein-like 2
- GLS, glutaminase
- GLUD1, glutamate dehydrogenase 1
- GLUL, glutamate-ammonia ligase
- hexachlorophene, 2, 2′-methylenebis(3, 4, 6-trichlorophenol)
- MAP1LC3B, microtubule-associated protein 1 light chain 3 β
- MFN2, mitofusin 2
- OPA1, optic atrophy 1 (autosomal dominant)
- PARK2, parkin RBR E3 ubiquitin protein ligase
- PEG, polyethylene glycol
- PINK1, PTEN induced putative kinase 1
- SIRT5, sirtuin 5
- SQSTM1, sequestosome 1
- TCA, tricarboxylic acid cycle
- TEM, transmission electron microscopy
Introduction
Autophagy is a tightly regulated process used to remove cytosolic components or damaged organelles starting with the formation of double-membrane vesicles called autophagosomes.Citation1 Subsequently, autophagosomes fuse and deliver their cargo to lysosomes for degradation and recycling.Citation1 Initially thought of as a random process, autophagy is now regarded as an adaptive response specifically activated by stress or environmental changes.Citation2
From a molecular point of view, autophagy starts with the formation of a phagophore which requires the assembly of a protein complex composed of BECN1 (Beclin 1, autophagy-related), AMBRA1 (autophagy/Beclin 1 regulator 1), PIK3R4 (phosphoinositide-3-kinase, regulatory subunit 4) and PIK3C3 (phosphatidylinositol 3-kinase, catalytic subunit type 3), the catalytic subunit of PtdIns3K.Citation3,4 Subsequently, the phagophore membrane expands by the action of 2 ubiquitin-like conjugation protein systems: MAP1LC3B (microtubule-associated protein 1 light chain 3 β) and ATG12 (autophagy related 12)-ATG5 that assemble with ATG16L1 (autophagy related 16-like 1 [S. cerevisiae]) to promote cleavage and lipidation of MAP1LC3B by addition of phosphatidyethanolammine (PE). In this way MAP1LC3B‒PE, also indicated as LC3-II, associates with the growing double-membrane structure until it closes forming the autophagosome that, as said, then fuses with a lysosome.Citation5 A plethora of different stimuli can influence autophagy by regulating the proteins involved in autophagosome formation. In fact, nutrient starvation or rapamycin treatment can activate autophagy by inhibiting MTOR (mechanistic target of rapamycin [serine/threonine kinase]) thereby activating the ULK1 (unc-51 like autophagy activating kinase 1) and ULK2 proteins that, in turn, recruit other ATG proteins such as MAP1LC3B and ATG16L1 to the forming autophagosome.Citation6
Sirtuins (SIRT) are a family of NAD-dependent protein deacetylases and/or ADP ribosylases controlling metabolic homeostasis.Citation7-9 Because of NAD dependency sirtuins are classified as class III histone deacetylase.Citation7-9 Sirtuins have different intracellular localization being present in the nucleus (SIRT1 [sirtuin1] and SIRT6), nucleolus (SIRT7), cytosol (SIRT1 and SIRT2) and mitochondria (SIRT3, SIRT4, and SIRT5). Through post-translational modification of a growing number of nonhistonic proteins and enzymes, sirtuins have been shown to play a major role in many cellular aspects such as survival, aging, stress response, and metabolism.Citation7-9,11 Similarly to autophagy-related genes, expression and activity of sirtuins are induced by stress and nutrients availability.Citation10 A connection between sirtuins and autophagy has been suggested for SIRT1 and SIRT2.Citation12,13 SIRT1 depletion in mammalian cells is accompanied by impaired or abolished autophagy.Citation12 Moreover, SIRT1 coimmunoprecipitates with ATG5, ATG7, and LC3, and Sirt1-depleted mice have a phenotype very similar to that of atg5-KO mice.Citation12,13 Considering that SIRT1 is both cytosolic and nuclear, it has been suggested that SIRT1 could regulate autophagy by deacetylating autophagy proteins or, alternatively, by regulating the binding of transcription factors to promoter regions of autophagy genes.Citation14 Overexpression or pharmacological activation of SIRT1 induced autophagy both in vitro and in vivo.Citation15-17 In particular, SIRT1-induced autophagy reduced prion- and ischemia-induced neurotoxicity,Citation16,18 increased remodeling in postinfarction heart improving cardiac functionCitation15 and, reduced endothelial inflammation after TNF treatment.Citation19 Finally, also the longevity effects of caloric restriction and resveratrol treatment in C. elegans have been linked to the activation of autophagy by SIRT1.Citation17
In the case of SIRT2, instead, it seems that during prolonged periods of stress, this sirtuin dissociates from FOXO1 (forkhead box O1) an effect that results in hyperacetylation of the latter.Citation20 Hyperacetylated FOXO1 then binds to ATG7 promoting autophagy.Citation20 In fact, SIRT2 inhibition or downregulation is accompanied by increased autophagy in human neuroblastoma cells in the presence of proteasome inhibition.Citation21 By contrast, SIRT2 inhibition triggers necrosis and not autophagy in mouse Schwann cells.Citation22 Therefore, even if SIRT2 may represent a good candidate for treatment of neurodegenerative disorders, more work is needed to understand its mechanism of action.
No links between autophagy and other sirtuins have been observed. However, the mitochondrial sirtuin, SIRT5, has been implicated in the control of ammonia levels by deacetylating and activating CPS1 (carbamoyl-phosphate synthase 1, mitochondrial), the rate-limiting enzyme of the urea cycle.Citation23,24 In fact, Sirt5-deficient mice have 30% lower CPS1 activity and show hyper ammonemia under fasting conditions.Citation23,24 Additionally, recent studies have shown that SIRT5 is a NAD-dependent protein lysine demalonylase, desuccinylase, and deglutarylase even of the described deacetylase target CPS1.Citation25,26 In particular, it seems that SIRT5 has a strong demalonylation, desuccinylation, and deglutarylation activity and a weak deacetylating activity.Citation25,26 SIRT5 is a global regulator of lysine succinylation in mitochondria and, in fact, MEF from Sirt5-deficient mice show a significant increase in Lys succinylation.Citation25,26 In the case of CPS1, its activity was reduced in Sirt5-deficient mice due to an increased succinylation and not acetylation.Citation25 Interestingly, SIRT5 lysine desuccinylation seems to impact enzymes involved in diverse mitochondrial metabolic pathways and to inhibit biochemical activity and mitochondrial respiration by suppressing the activity of the pyruvate dehydrogenase complex and succinate dehydrogenase.Citation27,28 From these initial studies it is clear that: i) SIRT5 possesses different post-translational modification activities and ii) SIRT5 influences ammonia levels by regulating CPS1 activity and urea cycle.
Recently, ammonia has been shown to induce autophagy in tumor cells via a paracrine and autocrine stimulation.Citation29,30 Moreover, ammonia-induced autophagy is independent from MTOR and ULK1/2.Citation31
From these considerations we reasoned that SIRT5 could be linked to ammonia-induced autophagy. So far SIRT5 has been shown only to regulate the urea cycle that takes place exclusively in the liver and, to a minor extent, in the kidney. However, SIRT5 is ubiquitously expressed in various tissues.Citation23 Therefore, SIRT5 may probably have other substrates besides CPS1.Citation23 In addition, it is possible that the metabolic pathway(s) regulated by SIRT5 in other tissues, are still those involved in the regulation of ammonia. Glutamine has an important role in the anaplerosis of the Krebs cycle and glutaminolysis is an important source of cellular ammonia.Citation30-32 Mitochondrial GLS (glutaminase) is the first enzyme in glutaminolysis.Citation33 To date, 3 mammalian GLSs have been identified: GLS2 (glutaminase 2 [liver, mitochondrial]), GLSK (glutaminase kidney-isoform, mitochondrial) and GLSC/glutaminase C a splice variant of GLSK (both usually referred to as GLS).Citation34 Human GLS consists of 669 amino acids and is structured in a short mitochondrial signaling peptide, a nuclear receptor box, glutaminase domain (cGLS), 3 ankyrin repeats, and APC/C-Cdh1 specific recognition motif (KEN box).Citation35 Interestingly, the catalytic domain of GLS is exposed in the mitochondrial matrix and GLS(K) is often overexpressed in tumors.Citation36,37
Our hypothesis is that SIRT5 could control ammonia levels by regulating glutaminase and glutamine metabolism and, in turn, ammonia-induced autophagy. To this effect, we produced different cell lines in which SIRT5 was overexpressed or silenced. Alternatively, we also used a new specific SIRT5 inhibitor to reduce SIRT5 activity. We also inhibited glutaminase activity with BPTES and dimethyl-α-ketoglutarate (a cell permeable form of α-ketoglutarate). In these systems we measured ammonia levels, autophagy, and mitophagy markers. Our results show that SIRT5 controls ammonia levels by interacting and desuccinylating mitochondrial GLS. Decreased ammonia production by SIRT5 is accompanied by reduced autophagy and mitophagy.
Results
Ammonia levels are increased in SIRT5-silenced and reduced in SIRT5-overexpressing cells
Urea cycle and ammonia levels are regulated by SIRT5 through deacetylation and desuccinylation of CPS1.Citation23-25 However, urea cycle takes place in the liver whereas SIRT5 is ubiquitously expressed.Citation23 What is the role of SIRT5 in other tissues? Is it always involved in the regulation of ammonia levels? To answer these questions, we obtained SIRT5-overexpressing or silenced MDA-MB-231 and C2C12 cellular clones (upper inserts in ). Desuccinylating activity was measured in WT, SIRT5-overexpressing or SIRT5-silenced clones. We observed that, compared to WT cells, SIRT5-overexpressing cells had an increased desuccinylating activity that was significantly reduced in SIRT5-silenced cells (). In addition we also treated WT cells with a newly synthesized specific SIRT5 inhibitor called MC3482. This inhibitor was synthesized as described in the supplementary text. The MC3482 effects on MDA-MB-231 and C2C12 cells are shown in , 50 μM MC3482 inhibits SIRT5 desuccinylating activity without affecting SIRT5 intracellular expression levels (lower inserts in ). The extent of inhibition of SIRT5 by MC3482 was tested by treating MDA-MB-231 cells with a different concentration of this compound and using a commercially available desuccinylating kit for SIRT5. Figure S1 shows how SIRT5 inhibition increases when treating cells with increasing concentration of MC3482. In particular a 42% inhibition was achieved when using 50 μM MC3482. The specificity of MC3482 for SIRT5 was determined by assessing the activity of other sirtuins. Figure S2 shows that the activity of the nuclear sirtuin SIRT1 was not significantly inhibited by 50 μM MC3482. Similarly, only an 8% inhibition of the mitochondrial sirtuin SIRT3 was observed in the presence of 50 μM MC3482. Therefore, in order to avoid excessive SIRT3 inhibition by MC3482, we decided to use a 50-μM concentration throughout the experiments.
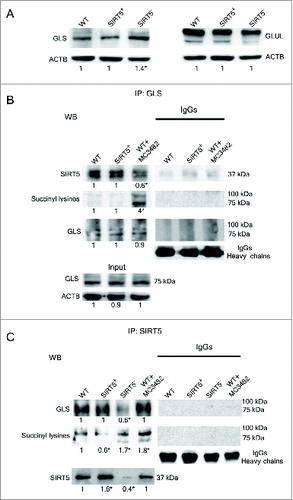
Figure 1. SIRT5 controls lysine succinylation and ammonia production. (A) MDA-MB-231 and C2C12 cells were transfected to obtain clones overexpressing (SIRT5+) and silenced (SIRT5-) for SIRT5. In addition, WT cells were treated for 24 h with the SIRT5 inhibitor MC3482 as described under Materials and Methods. Overexpression and silencing of SIRT5 was confirmed by western blot as shown in the upper inserts. Moreover, SIRT5 expression in the presence of the inhibitor MC3482 was also studied by western blot as shown in the lower inserts. Densitometric analysis of the gels was performed as described under Materials and Methods. Desuccinylasic activity of SIRT5 in WT, SIRT5 clones and WT cells treated with MC3482 was measured in mitochondrial extracts as described under Materials and Methods. Data are representative of at least 3 separate experiments. ACTB was used as loading control. *Significantly different from WT cells. Significance was set at P < 0.05. (B) Whole cellular extracts were obtained from MDA-MB-231 WT cells in the presence or absence of SIRT5 inhibitor MC3482 as well as from SIRT5+ and SIRT5- clones. Lysates were then subjected to SDS-PAGE and succinylation (left side) and acetylation (right side) levels of lysines measured by western blot by using a monoclonal anti-succinyl lysine and an anti-acetyl lysine antibody as described under Materials and Methods. Densitometric analysis of the gels was performed as described under Materials and Methods. Data are representative of at least 3 separate experiments. ACTB was used as loading control. *Significantly different from WT cells. Significance was set at P < 0.05. (C) MDA-MB-231 and C2C12 WT cells in the presence or absence of MC3482, as well as SIRT5+ and SIRT5- clones were kept in culture for the times indicated. Similarly, MDA-MB-231 and C2C12 cells overexpressing (SIRT3+) and silenced (SIRT3-) for SIRT3 were used. Ammonia levels were measured in the culture medium every other day as reported under Materials and Methods. Ammonia production in the absence of cells (1.6± 0.3 μg/ml and 0.4± 0.1 μg/ml in the presence and absence of glutamine respectively) was subtracted from each experiment. Data are representative of at least 3 separate experiments. *Significantly different from WT cells. Significance was set at P < 0.05.
Protein desuccinylation was also measured with a monoclonal anti-succinyl lysine antibody on whole cellular extracts. shows that, compared to control WT cells, SIRT5-silenced cells and WT cells treated with the SIRT5 inhibitor MC3482 had an increase in succinylated proteins. By contrast SIRT5-overexpressing cells showed a lower succinylation (). We also measured acetylation through an anti-acetyl lysine antibody. In this case, we could not detect a significant change in whole protein acetylation between WT, WT plus MC3482, and SIRT5-overexpressing or silenced cells ().
To study SIRT5 involvement in the regulation of ammonia levels, we measured ammonia released in growth medium in our WT and SIRT5 clones. We observed that SIRT5 overexpression reduced ammonia accumulation in culture medium (). By contrast, SIRT5 silencing significantly increased ammonia accumulation compared to WT cells (). Again an ammonia increase was also observed when treating cells with the SIRT5 inhibitor MC3482 (). Importantly, when using SIRT3-overexpressing and silenced MDA-MB-231 or C2C12 cells we did not observe any significant ammonia variation compared to WT cells ().
SIRT5 regulates glutamine metabolism
Glutamine is classified as a nonessential amino acid that, however, represents an important nitrogen source.Citation38 In particular, glutamine acts as precursor of glutamate and ammonia and has therefore an important role in the brain and other tissues.Citation39,40 Glutamine metabolism is accelerated in tumor cells as well as in rapidly proliferating nontumor cells.Citation41,42 This metabolism mainly occurs in the mitochondria where glutamine is converted to glutamate and ammonia by the enzyme GLS.Citation36,43 The opposite reaction that from glutamate and ammonia generates glutamine, is performed by the enzyme GLUL (glutamate-ammonia ligase).Citation44 In order to understand if SIRT5 can regulate these 2 enzymes, expression levels of GLUL and GLS were measured in MDA-MB-231. shows that, in SIRT5-silenced cells GLS levels were increased compared to WT and SIRT5-overexpressing cells. We focused our attention on GLS because this enzyme, contrary to GLUL, has a mitochondrial localization and, in addition, its functionally relevant domain faces the mitochondrial matrix where SIRT5 resides.Citation36 Therefore, to investigate a possible endogenous interaction between SIRT5 and GLS, we performed immunoprecipitation assays. Our results show that SIRT5 coimmunoprecipitates with GLS (). We used WT cells treated with SIRT5 inhibitor and not SIRT5-silenced cells in our immunoprecipitation experiments because we encountered some problems to interpret the results probably due to the increased GLS expression present in the latter (see ). In fact, when we used the SIRT5 inhibitor, we observed a decreased association between GLS and SIRT5 (). Interestingly, in these same samples treated with the SIRT5 inhibitor, we instead observed an increased succinylation of a protein(s) with a molecular weight similar to that of GLS as shown in . To confirm this result, we immunoprecipitated WT cells, either left untreated or treated with MC3482, as well as SIRT5 clones with a SIRT5 antibody and then immunoblotted for GLS. shows, again, a coimmunoprecipitation between SIRT5 and GLS. Importantly, we observed a lower SIRT5-GLS interaction in SIRT5-silenced clones. By contrast, GLS succinylation decreased in SIRT5-overexpressing cells and increased in SIRT5-silenced or WT cells treated with MC3482 ().
Figure 2. SIRT5 coimmunoprecipitates and desuccinylates glutaminase. (A) MDA-MB-231 WT, SIRT5+ and SIRT5- cells were processed to obtain whole cellular extracts. Glutaminase and glutamine synthetase levels were assessed by western blot as indicated under Materials and Methods. Densitometric analysis of the gels was performed as described under Materials and Methods. Data are representative of at least 3 separate experiments. ACTB was used as loading control. *Significantly different from WT cells. Significance was set at P < 0.05. (B) MDA-MB-231 WT cells, either treated with MC3482 or left untreated, as well as SIRT5+ cells were processed. Cellular extracts were immunoprecipitated with either an anti-glutaminase antibody or anti-rabbit IgG, electrophoresed on a SDS-polyacrylamide gel and immunoblotted with an anti-SIRT5, anti-succinyl lysine or anti-glutaminase antibody as described under Materials and Methods. GLS expression was also determined in the input (lower panel). Densitometric analysis of the gels was performed as described under Materials and Methods. Data are representative of at least 3 separate experiments. ACTB was used as loading control. *Significantly different from WT cells. Significance was set at P < 0.05. (C) MDA-MB-231 WT cells, either treated with MC3482 or left untreated, as well as SIRT5+ and SIRT5- cells were processed. Cellular extracts were immunoprecipitated with either an anti-SIRT5 antibody or anti-rabbit IgG, electrophoresed on a SDS-polyacrylamide gel and immunoblotted with an anti-glutaminase, anti-succinyl lysine or anti-SIRT5 antibody as described under Materials and Methods. Densitometric analysis of the gels was performed as described under Materials and Methods. Data are representative of at least 3 separate experiments. ACTB was used as loading control. *Significantly different from WT cells. Significance was set at P < 0.05.
To confirm that SIRT5 may control GLS activity through its desuccinylation, we measured glutamate accumulation in MDA-MB-231 and C2C12 WT cells and SIRT5 clones. We also used the GLS inhibitor BPTES and, again, measured glutamate and ammonia accumulation. shows that glutamate levels decreased in SIRT5-overexpressing cells and increased in SIRT5-silenced cells and in WT cells treated with MC3482. Importantly, glutamate accumulation was reduced to the same extent in WT cells as well as in SIRT5 clones by the addition of BPTES (). Similarly, BPTES inhibited ammonia accumulation in MDA-MB-231 and C2C12 cells as did the treatment with dimethyl-α-ketoglutarate that works by replenishing the anaplerotic flux (). Glutamate produced during glutaminolysis is converted to α-ketoglutarate by the mitochondrial enzyme GLUD1 (glutamate dehydrogenase 1) with production of ammonia.Citation45 Therefore, to investigate the possibility that SIRT5 could control ammonia production by regulating also GLUD1 activity we performed immunoprecipitation assays. As shown in Figure S3A, we did not observe a coimmunoprecipitation between GLUD1 and SIRT5, whereas we confirmed a GLUD1-SIRT3 coimmunoprecipitation (Fig. S3A). In addition, we did not observe any difference in GLUD1 activity in WT and SIRT5 clones of MDA-MB-231 cells (Fig. S3B). However, both GLUD1 inhibitors that we tested, hexachlorophene and dimethyl-α-ketoglutarate, significantly reduced GLUD1 activity in WT cells and SIRT5 clones (Fig. S3B). Finally, the central role of glutamine for ammonia production in our system, was determined by culturing cells in the absence of glutamine for several days. As shown in Figure S4, glutamine withdrawal lowered ammonia produced by both MDA-MB-231 and C2C12 cell lines. Moreover, after glutamine withdrawal, we did not observe any significant difference in ammonia production among SIRT5 clones or WT cells treated with the SIRT5 inhibitor MC3482 (Fig. S4).
Figure 3. SIRT5 controls glutamate accumulation. (A) MDA-MB-231 and C2C12 WT cells, either treated with MC3482 or left untreated, as well as SIRT5+ and SIRT5- cells were processed to obtain whole cellular extracts. Glutamate concentration was measured using a glutamate assay kit according to manufacturer's protocol. Alternatively, glutamate was also measured in MDA-MB-231cells treated with the GLS inhibitor BPTES for 17 h. Data are representative of at least 3 separate experiments. *Significantly different from WT cells. Significance was set at P < 0.05. (B) MDA-MB-231 and C2C12 WT cells in the presence or absence of MC3482, as well as SIRT5+ and SIRT5- clones were kept in culture for the times indicated. In addition cells were also treated with the GLS inhibitor BPTES or with dimethyl-α-ketoglutarate to replenish anaplerotic flux. Ammonia levels were measured in the culture medium after 2 and 3 d as reported under Materials and Methods. Data are representative of at least 3 separate experiments. *Significantly different from nontreated (NT) cells. Significance was set at P < 0.05.
To support the data shown in , we also evaluated the suggested binding between SIRT5 and human GLS by performing molecular docking analysis through the program Hex.Citation46 Bioinformatics analysis revealed that in the obtained complex SIRT5 precisely fits the GLS tetramer and its catalytic pocket faces the active site of the enzyme as shown in Figure S5. The 3-dimensional structure of the human SIRT5 core domain has been solved revealing remarkable structural conservation with other sirtuins.Citation47 At the entrance of the lysine-binding pocket, there are 3 hydrophobic residues, namely Phe223, Leu227, and Val254,Citation48 that are highly conserved within the sirtuin family (Fig. S6B).Citation48 These 3 residues define a small triangular entry for the acyl-lysine group of the substrate. In SIRT5, moreover, 2 other residues, Tyr102 and Arg105, are located on the bottom of the succinyl-lysine-binding pocket, where the interaction that stabilizes the succinyl group occurs (Fig. S6B).Citation48 The structure of the catalytic domain of GLS (cGLS) shows an active site cleft (highlighted in blue in Fig. S6A) located at the domain interface.Citation35 Early biochemical studies of the kidney-type isozyme reported that mitochondrial glutaminases are mostly found as inactive dimers in the organelle and that the presence of phosphate correlates with changes leading to tetramerization and enzyme activation.Citation49,50 Figure S6A shows Lys320 on human GLS. This lysine corresponds to Lys253, a residue previously identified as the succinylation site in liver of mice glutaminase.Citation28 On the other hand, relying on the docking complex model obtained, we hypothesize also that Lys245, that is highly exposed and opposed to Lys320 in the GLS active site, may represent an additional succinylation site. In Figure S6A, B the residues located at the entrance of the SIRT5 catalytic pocket are represented in red, whereas the amino acids interacting with the succinyl group are represented in orange. Lys245 (magenta) and Lys320 (yellow) are also indicated and their location suggests that they may be accessible to the SIRT5 catalytic pocket. In addition, an alignment analysis using the Clustal Omega programCitation51 showed that these 2 lysines are highly conserved among sequences of mouse, rat, and among glutaminase isoforms (Fig. S7) but less conserved in bacteria, showing a preference for the glycine residue at the -1 position and for the valine residue at the +1 position (valine and alanine side chains are structurally close) as detected by the motif analysis for the Ksucc site evaluated by Park.Citation28
Ammonia-induced autophagy is regulated by SIRT5
Considering our immunoprecipitation results, SIRT5-GLS docking analysis and the recent reports suggesting that ammonia derived from glutaminolysis induces autophagy through an MTOR independent-ATG dependent mechanism,Citation31 we investigated if ammonia released in SIRT5 clones or cells treated with SIRT5 inhibitor, could induce autophagy. Autophagy induction was initially investigated by TEM. shows that in SIRT5-silenced () and in WT MDA-MB-231 cells treated with MC3482 (), there is an accumulation of autophagosomes and autolysosomes some of them in the process of fusion (). Subsequently, we also determined levels of autophagic markers MAP1LC3B, GABARAP (GABA[A] receptor-associated protein) and GABARAPL2 (GABA[A] receptor-associated protein-like 2). MDA-MB-231 cells silenced for SIRT5 showed increased LC3-II levels compared to WT cells (). Again, a similar LC3-II increase was present in WT cells treated with SIRT5 inhibitor (). By contrast, SIRT5 overexpression resulted in the absence of LC3-II (). LC3-II accumulation was also measured by immunofluorescence. Figure S8A shows that, compared to WT or SIRT5-overexpressing cells, LC3-II accumulated in SIRT5-silenced cells and in WT cells treated with MC3482. Such an accumulation was also clear after 4 d of culture as reported in Figure S8B. In order to exclude that the lack of LC3-II signal in SIRT5-overexpressing cells was due to increased autophagic flux, we treated WT and SIRT5 clones with bafilomycinA1 for 2 and 17 h. As shown in , LC3-II levels in SIRT5-overexpressing cells treated with bafilomycinA1 were similar to LC3-II levels of bafilomycinA1-treated WT cells, whereas SIRT5-silenced clones had an increased accumulation of LC3-II after 2 and 17 h. This result suggests that LC3-II absence in SIRT5-overexpressing cells is due to reduced autophagy induction and not to an increased autophagic flux as also shown in TEM pictures of figure 4B. Ammonia-induced autophagy was a characteristic of SIRT5 clones since LC3-II levels were not increased in MDA-MB-231 cells overexpressing or silenced for another mitochondrial sirtuin, SIRT3 (). We also measured expression of LC3 paralogs GABARAP and GABARAPL2 that, sometimes, can be better indicators of autophagy.Citation52 In MDA-MB-231 cells, GABARAPL2 processing and GABARAP accumulation was observed only in SIRT5-silenced clones and in WT cells treated with the SIRT5 inhibitor (). We also determined SQSTM1 (sequestosome 1) levels as a marker of lysosome degradation of the autophagosome cargo. , shows that SQSTM1 degradation was impaired in SIRT5-overexpressing cells but not in SIRT5-silenced cells or in WT cells treated with SIRT5 inhibitor and that bafilomycinA1 treatment prevented SQSTM1 degradation in SIRT5-silenced cells and in WT cells treated with MC3482 (). To demonstrate that ammonia can increase accumulation of autophagic markers, we treated MDA-MB-231 cells with exogenous ammonia at a concentration similar to those reached in the cell medium after 4 d of culture. As shown in , ammonia at 2 mM concentration induced autophagy as demonstrated by accumulation of LC3-II, GABARAPL2, GABARAP, and SQSTM1 degradation. Similarly, Figure S8 shows LC3 puncta accumulation by immunofluorescence in NH4Cl-treated cells. Ammonia production derives from glutaminolysis since, as shown in , treatment of cells with GLS inhibitor BPTES or dimethyl-α-ketoglutarate, completely prevented LC3-II, GABARAPL2 accumulation as well as SQSTM1 degradation. Importantly, accumulation of LC3-II and degradation of SQSTM1 were prevented by L-glutamine withdrawal (). It must be noted that prolonged glutamine withdrawal was accompanied by significant cell death (not shown).
Figure 4. SIRT5 silencing or inhibition induces autophagy. MDA-MB-231 WT cells, either treated with MC3482 or left untreated, as well as SIRT5+ and SIRT5- cells were cultured for 24 h. The cells were then processed for electron microscopy as described under Materials and Methods. (A) WT control showing a few autophagosomes (magnification 21,000x). (B) SIRT5-overexpressing cells with very low or absent autophagy (Magnification 21,000x). (C) Autophagy in WT cells treated with MC3482. Black arrows point to autolysosomes in the cytoplasm (magnification 21,000x). (D) Autophagy in SIRT5-silenced cells. Black arrows point to autophagosomes and autolysosomes (magnification 15,500x). Inset Magnification 28,500x.
Figure 5 (See previous page). SIRT5 controls ammonia-induced autophagy. (A) MDA-MB-231 WT cells in the presence or absence of MC3482, as well as SIRT5+ and SIRT5− clones were processed to obtain whole cellular extracts. Alternatively, WT, SIRT5+ and SIRT5− cells were treated with 100 nM bafilomycinA1 for 2 and 17 h and processed. Finally, also MDA-MB-231 WT, SIRT3+ and SIRT3− cells were used. Autophagy induction was measured by using an anti-MAP1LC3B antibody as indicated under Materials and Methods. Densitometric analysis of the gels was performed as described under Materials and Methods. ACTB was used as loading control. *Significantly different from WT cells. Significance was set at P < 0.05. (B) MDA-MB-231 WT cells in the presence or absence of MC3482, as well as SIRT5+ and SIRT5− clones were processed to obtain whole cell extracts. SQSTM1, GABARAPL2, and GABARAP levels were determined by western blot as indicated under Materials and Methods. In addition, cells were treated with bafilomycinA1 for 17 h and SQSTM1 levels measured by western blot. Densitometric analysis of the gels was performed as described under Materials and Methods. ACTB was used as loading control. *Significantly different from WT cells. Significance was set at P < 0.05. (C) MDA-MB-231 WT cells were either left untreated or treated with NH4Cl 1 or 2 mM for 24 h. Subsequently, cells were processed to obtain whole extracts. MAP1LC3B, GABARAPL2, GABARAP and, SQSTM1 levels were measured by western blot as indicated under Materials and Methods. Densitometric analysis of the gels was performed as described under Materials and Methods. ACTB was used as loading control. *Significantly different from WT cells. Significance was set at P < 0.05. (D) MDA-MB-231 WT cells in the presence or absence of MC3482, as well as SIRT5+ and SIRT5− clones were treated with either BPTES or dimethyl-α-ketoglutarate. Cells were then processed to obtain whole extracts. MAP1LC3B, GABARAPL2, and, SQSTM1 levels were measured by western blot as indicated under Materials and Methods. Densitometric analysis of the gels was performed as described under Materials and Methods. ACTB was used as loading control. *Significantly different from WT cells. Significance was set at P < 0.05. (E) MDA-MB-231 WT cells in the presence or absence of MC3482, as well as SIRT5+ and SIRT5− clones were cultured without L-glutamine for 24 h. Cells were then processed to obtain whole extracts. MAP1LC3B and SQSTM1 levels were measured by western blot as indicated under Materials and Methods. Densitometric analysis of the gels was performed as described under Materials and Methods. ACTB was used as loading control. *Significantly different from WT cells. Significance was set at P < 0.05. (F) C2C12 WT cells treated in the presence or absence of MC3482, as well as SIRT5+ and SIRT5− clones were processed to obtain whole cell extracts. Cells were also treated with NH4Cl 1 or 2 mM for 24 h. To asses autophagy induction MAP1LC3B, GABARAPL2, and GABARAP levels were determined by western blot as indicated under Materials and Methods. Densitometric analysis of the gels was performed as described under Materials and Methods. ACTB was used as loading control. *Significantly different from WT cells. Significance was set at P < 0.05.
Similar results were obtained in C2C12 cells where SIRT5 silencing as well as SIRT5 pharmacological inhibition and ammonia supplementation, increased LC3-II, GABARAPL2, and GABARAP levels ().
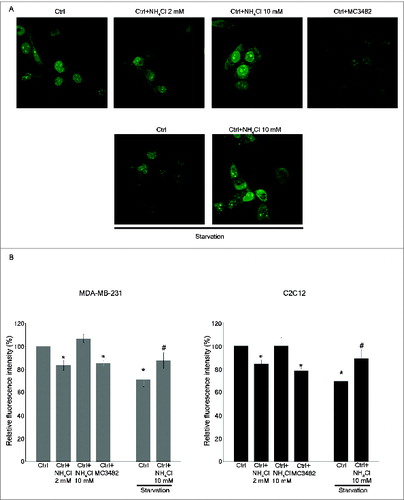
Autophagic proteolysis was measured by labeling long-lived proteins by the Click-iT AHA method as described in Materials and Methods. In fact, AHA is a surrogate for L-methionine with an azide group that is incorporated into proteins during protein synthesis. In particular, cells can be pulsed with AHA to label long-lived proteins followed by a short incubation in medium without AHA to chase out short-lived proteins. At this point the Click reaction allows the binding of a fluorescent alkyne group to the azide. In this way increased autophagy will result in a reduction of fluorescent long-lived proteins. By contrast, inhibition of autophagy or inhibition of lysosome proton pump activity, as in the case of bafilomycinA1 treatment, will increase the signal from fluorescent long-lived proteins. Our results are shown in . Confocal analysis of autophagic proteolysis showed a decrease in fluorescence in WT MDA-MB-231 cells treated for 3 h with 2 mM NH4Cl or with 50 μM MC3482. By contrast no decrease was observed in cells treated with 10 mM NH4Cl. Importantly, 10 mM NH4Cl also prevented starvation-induced autophagic proteolysis in WT cells (). These results were quantified by reading the fluorescence intensity in a fluorimeter as reported in . Fluorescence from long-lived proteins decreased by about 15% in MDA-MB-231 WT cells treated with 2 mM NH4Cl or with MC3482 for 3 h. Interestingly, treatment of MDA-MB-231 WT cells with 10 mM NH4Cl did not increase autophagic proteolysis but prevented starvation-induced protein degradation. Similar results were obtained in C2C12 cells although we had to prolong treatments up to 6 h ( right panel).
Figure 6. Ammonia increases proteolysis of long-lived proteins. (A) MDA-MB-231 WT cells were labeled with AHA as described under Materials and Methods and then cultured in complete medium in the presence or absence of 2 mM NH4Cl, 10 mM NH4Cl or 50 μM MC3482 for 3 h. Alternatively, cells were cultured in starvation medium in the presence or absence of 10 mM NH4Cl for 3 h. Cells were then fixed, permeabilized and stained for 2 h with alkine-Alexa Fluor 488 as described under Materials and Methods. Fluorescence from long-lived proteins was observed using a LSM 510 confocal microscopy (Zeiss). (B) MDA-MB-231 and C2C12 WT cells were placed in a 96-well plate, labeled and treated as described in (A). However, C2C12 cells treatments were prolonged to 6 h. Fluorescence from labeled long-lived proteins was measured using Glomax multi detection system (Promega). The fluorescence intensity of the assay buffer was subtracted from each experimental sample. *Significantly different from control (ctrl) cells. #Significantly different from control starved (ctrl) cells. Significance was set at P < 0.05.
Mitophagy regulation by SIRT5
Our results indicates that SIRT5 controls glutamine metabolism and the consequent ammonia-induced autophagy. We next investigated if ammonia regulation by SIRT5 could also influence the selective degradation of mitochondria through so-called mitophagy. In fact, mitophagy is a tightly regulated process that selectively sequesters and degrades superfluous, damaged, or potentially dysfunctional mitochondria representing, as in the case of autophagy, both a cell death and a survival process.Citation5,52 Induction of mitophagy, in our system, was assessed by measuring different markers and precisely, BNIP3 (BCL2/adenovirus E1B 19kDa interacting protein 3) and the PINK1 (PTEN induced putative kinase 1) and PARK2 (parkin RBR E3 ubiquitin protein ligase) system. BNIP3 is a autophagy receptor on the mitochondria that interacts with MAP1LC3B and GABARAP committing dysfunctional mitochondria to mitophagy.Citation5,52,53 Our results show that in SIRT5-silenced MDA-MB-231 cells as well as in WT cells treated with the SIRT5 inhibitor MC3482, there is an increase of BNIP3 in the mitochondria whereas a decrease was observed in SIRT5-overexpressing cells (). Interestingly, when cells were treated with bafilomycinA1 we observed a BNIP3 increase that was, however, more marked in SIRT5-silenced cells. The central role of GLS-dependent glutaminolysis with ammonia accumulation for mitophagy was demonstrated by treating cells with BPTES, dimethyl-α-ketoglutarate, NH4Cl and glutamine withdrawal (). In fact, BPTES, dimethyl-α-ketoglutarate and glutamine withdrawal completely inhibited BNIP3 accumulation whereas, ammonia supplementation increased BNIP3 levels in the cells. This result suggests that the mitochondrial degradation following association between the autophagy receptor BNIP3 on the mitochondria and the autophagy marker MAP1LC3B is reduced after SIRT5 overexpression and increased after SIRT5 silencing or inhibition.
Figure 7. SIRT5 controls ammonia-induced mitophagy and mitochondrial fusion proteins. (A) Upper panel: MDA-MB-231 WT cells in the presence or absence of MC3482, as well as SIRT5+ and SIRT5− clones were processed to obtain mitochondrial fractions. Alternatively, WT, SIRT5+ and SIRT5− cells were treated with 100 nM bafilomycinA1, BPTES, dimethyl-α-ketoglutarate, NH4Cl or grown without L-glutamine for 17 h and processed. BNIP3 expression levels were determined by western blot as indicated under Materials and Methods. Densitometric analysis of the gels was performed as described under Materials and Methods. COX4I1 was used as a loading control. *Significantly different from WT cells. Significance was set at P < 0.05. Middle panel: MDA-MB-231 WT cells in the presence or absence of MC3482, as well as SIRT5+ and SIRT5− clones were processed to obtain mitochondrial fractions. Alternatively, WT, SIRT5+ and SIRT5− cells were treated with NH4Cl for 17 h. PINK1 and PARK2 levels were assessed by western blot as indicated under Materials and Methods. Densitometric analysis of the gels was performed as described under Materials and Methods. COX4I1 was used as a loading control. *Significantly different from WT cells. Significance was set at P < 0.05. Lower panel: MDA-MB-231 WT cells in the presence or absence of MC3482, as well as SIRT5+ and SIRT5− clones were processed to obtain whole cellular extracts. MFN2 and OPA1 levels were assessed by western blot as indicated under Materials and Methods. Densitometric analysis of the gels was performed as described under Materials and Methods. ACTB was used as loading control. Data are representative of at least 3 separate experiments. *Significantly different from WT cells. Significance was set at P < 0.05. (B) Upper panel: C2C12 WT cells in the presence or absence of MC3482, as well as SIRT5+ and SIRT5− clones were processed to obtain mitochondrial fractions. Alternatively, WT, SIRT5+ and SIRT5− cells were treated with NH4Cl for 17 h. BNIP3 expression levels were determined by western blot as indicated under Materials and Methods. Densitometric analysis of the gels was performed as described under Materials and Methods. COX4I1 was used as a loading control. *Significantly different from WT cells. Significance was set at P < 0.05. Lower panel: C2C12 WT cells in the presence or absence of MC3482, as well as SIRT5+ and SIRT5− clones were processed to obtain whole cellular extracts. MFN2 and OPA1 levels were assessed by western blot as indicated under Materials and Methods. Densitometric analysis of the gels was performed as described under Materials and Methods. ACTB was used as loading control. Data are representative of at least 3 separate experiments. *Significantly different from WT cells. Significance was set at P < 0.05.
The PINK1-PARK2 pathway is another system to control mitophagy.Citation5,54-56 In particular, PINK1 accumulates in the mitochondria thereby recruiting PARK2 through an unknown mechanism. PARK2, in turn, ubiquitinases mitochondrial proteins serving as a signal for mitophagy.Citation57 shows that both PINK1 and PARK2 accumulates in mitochondrial fractions of SIRT5-silenced cells, in WT cells treated with MC3482 as well as in WT cells treated with NH4Cl. By contrast, PINK1 and PARK2 levels decreased in SIRT5-overexpressing cells. MFN2 (mitofusin 2) is one of the few substrates that is ubiquitinated by PARK2 on the mitochondria.Citation57 MFN2 ubiquitination and degradation serves, then, as a signal for mitophagy.Citation57 As shown in , MFN2 levels decreased in both SIRT5-silenced and WT cells treated with SIRT5 inhibitor. Interestingly, we also observed that OPA1 (optic atrophy 1 [autosomal dominant]), another protein of the mitochondrial fusion machinery, was increased in SIRT5-overexpressing cells and decreased when SIRT5 was silenced or inhibited ().
Similar results were obtained in C2C12 cells. shows an increase in BNIP3 in SIRT5-silenced cells, in WT cells treated with MC3482 or with NH4Cl. We also observed a decrease in MFN2 and OPA1 in SIRT5-silenced cells and in WT cells after SIRT5 inhibition, whereas BNIP3 decreased and MFN2 levels increased in SIRT5-overexpressing cells.
SIRT5 influences mitochondrial dynamics
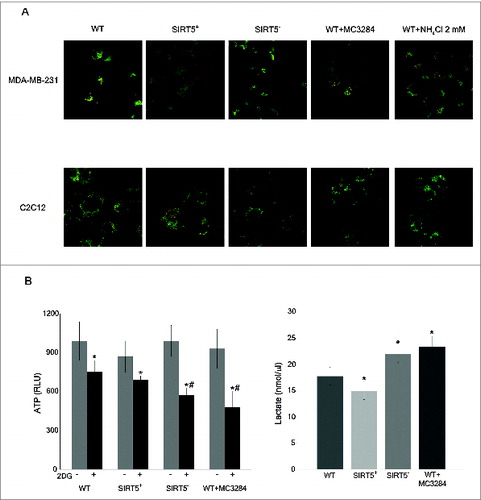
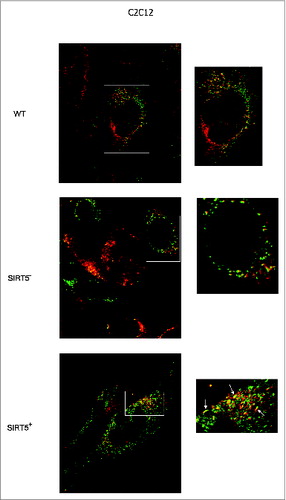
Glutamine homeostasis influences mitochondrial dynamics suggesting that the energetic status of the cell and mitochondrial morphology are somehow interlinked.Citation57-59 Moreover, increased MFN2 and OPA1 levels that we observed, could alter mitochondrial dynamics favoring mitochondrial fusion. In addition, mitochondrial membrane potential is influenced by the organelle's morphology with higher potential in large fused mitochondria.Citation59 We therefore measured mitochondrial morphology and potential in SIRT5-overexpressing and silenced cells. shows that SIRT5-overexpressing MDA-MB-231 and C2C12 cells had a greater number of mitochondria with a red JC-1 staining indicating higher mitochondrial membrane potential. Almost no red mitochondria were present in SIRT5-silenced cells and in WT cells treated with MC3482 or with NH4Cl (). Additionally, JC-1 mitochondrial staining showed that SIRT5-overexpressing cells had large elongated mitochondria well distributed along the cellular processes whereas, SIRT5-silenced cells as well as WT cells treated with MC3482 or NH4Cl had small round mitochondria clustered around the nucleus (). ATP levels and lactate production were measured in our cells. shows that ATP levels were similar in WT cells and in SIRT5 clones. Addition of 2-deoxy-D-glucose (2DG), an inhibitor of glycolysis, reduced ATP levels in WT as well as in SIRT5 clones (). However, reduction of ATP levels was more significant in SIRT5-silenced cells and in WT cells treated with MC3482 (). Importantly, lactate production was decreased in SIRT5-overexpressing cells and increased in SIRT5-silenced or in WT cells after SIRT5 inhibition ().
Figure 8. Mitochondrial morphology, membrane potential, ATP and lactate levels in WT cells and in SIRT5 clones. (A) MDA-MB-231 and C2C12 WT, SIRT5+ and SIRT5- cells as well as WT cells treated with NH4Cl for 24 h were incubated with JC-1 to assess mitochondrial membrane potential as described under Material and Methods. Pictures of mitochondria were taken at 60x with a LSM510 Zeiss Confocal Microscope. (B) Left side. MDA-MB-231 WT cells, either treated with MC3482 or left untreated, as well as SIRT5+ and SIRT5- cells were processed to obtain whole cellular extracts. ATP levels were measured using an ATP/ADP assay kit according to the manufacturer's protocol. Alternatively, ATP levels were also measured in the presence of the glycolysis inhibitor 2DG for 17 h. Data are representative of at least 3 separate experiments. *Significantly different from non treated cells. #Significantly different from WT and SIRT5+ cells treated with 2DG (P < 0.01). Significance was set at P < 0.05. Right side. MDA-MB-231 cells in the presence or absence of MC3482, as well as SIRT5+ and SIRT5- clones were kept in culture for 3 d Lactate levels were measured in the culture medium as reported under Materials and Methods. Data are representative of at least 3 separate experiments. *Significantly different from WT cells. Significance was set at P < 0.05.
The presence of large fused mitochondria in SIRT5-overexpressing cells and the increase in the fusion proteins MFN2 and OPA1 prompted us to investigate if this was due to a shift of mitochondrial dynamics in favor of fusion. Fusion of the mitochondria was studied by the PEG fusion assay as indicated in Materials and Methods. shows that, compared to WT C2C12 cells, SIRT5-silenced cells had a lower number of fused yellow mitochondria whereas SIRT5-overexpressing cells had a higher number of fused yellow mitochondria as well as mitochondria with red or green extremities and yellow center as indicated by the arrows.
Figure 9. Mitochondrial fusion in WT cells and in SIRT5 clones. Two separate populations of C2C12 WT, or SIRT5+ or SIRT5- cells were incubated with either MitoTrackerGreen or MitoTrackerRed. Subsequently the 2 populations were cocultured in the presence of PEG to stimulate cellular fusion as described under Materials and Methods. Cells with green-labeled mitochondria fused with cells with red-labeled mitochondria were analyzed under confocal microscope (LSM510 Zeiss). The presence of mitochondria fusion was assessed by the appearance of yellow mitochondria. Pictures on the right side are enlargements of the images in the white box on the left. White arrows in the lower right panel indicate the presence of large fused or fusing mitochondria. Pictures of mitochondria were taken at 60x with a LSM510 Zeiss Confocal Microscope.
Discussion
In the present study we demonstrate that SIRT5 regulates ammonia production by influencing glutamine metabolism through the binding and desuccinylation of GLS. Ammonia increases autophagy in a paracrine and autocrine fashion.Citation29,30 SIRT5 overexpression reduces ammonia accumulation whereas, SIRT5-silencing or inhibition increases ammonia production and ammonia-induced autophagy. Finally, SIRT5 also regulates mitochondrial dynamics and mitophagy probably by controlling glutamine metabolism and ammonia accumulation.
Glutamine is the most abundant nonessential amino acid and serves as a storage form of glutamate and ammonia.Citation60 Glutamine is important for anaplerosis of the Krebs cycle.Citation60 Therefore, in tumor cells, where glucose is mainly used through glycolysis, glutamine metabolism is accelerated and glutamine represents an important source of energy.Citation37,61,62 GLS is the main enzyme for glutaminolysis and catalyzes the transformation of glutamine in glutamate and ammonia. GLS resides in the mitochondria and its functionally relevant domain faces the mitochondrial matrix.Citation36 Interestingly, tumor cells show a higher GLS activity and expression than normal cells.Citation37 Therefore, in growing tumors, glutamine addiction and utilization releases ammonia that is then used by surrounding tumor cells to increase autophagy and autophagic removal of toxic by-products.Citation29 To this effect, our results show that GLS expression increases in SIRT5-silenced cells () with a corresponding increased accumulation of ammonia and autophagy induction. The central role of GLS for ammonia production is demonstrated by the fact that BPTES, a GLS inhibitor, completely prevents ammonia accumulation as well as autophagy induction (). Similarly, autophagy was induced by adding ammonia to the culture medium at a concentration equivalent to that reached after 4 d of culture. Importantly, the increase of autophagic markers observed when ammonia was added to the cells was accompanied by an increase of autophagic proteolysis of long-lived protein demonstrating the presence of a correct lysosomal activity ().
It is worth noting that SIRT5 is downregulated in tumorsCitation63 and that in our hands, a newly specific SIRT5 inhibitor reproduced the same increase of ammonia production and autophagy and mitophagy induction as SIRT5-silencing. Our results also show a coimmunoprecipitation between SIRT5 and GLS () that was reduced after pharmacological inhibition of SIRT5. In addition, SIRT5 inhibition resulted in an increased succinylation of GLS (). Moreover, glutamate production is reduced in SIRT5-overexpressing cells and increased in SIRT5-silenced or in WT cells treated with MC3482 demonstrating a regulation of GLS activity (). To this regard, it is worth noting that recently, Park et al. have shown that SIRT5 has structural preferences for its enzymatic activity.Citation28 In particular, motif analysis identified AK, GK, KF and KA motifs as significantly overrepresented for Lys succinylation sites.Citation28 A screening analysis identified, among a total of about 800 proteins, GLS as a putative succinylated substrate.Citation28 In particular Lys 253 of mouse GLS2 was identified as a putative succinylation site.Citation28 According to this, our docking protein-protein analysis of human GLS and SIRT5 suggests that: i) SIRT5 fits in the cavity of a tetramer of GLS; ii) Lys 320, that corresponds to the mouse 253, and also Lys 245 are on opposite sides of the GLS active site; iii) these 2 lysines may be accessible to the SIRT5 catalytic pocket; iiii) these 2 lysines and the amino acids at position −1 and +1 are highly conserved among different species (Fig. S5 to S7).
Our results also demonstrate that SIRT5 regulates mitophagy and mitochondrial dynamics. In fact, we showed that the mitophagy markers BNIP3 and PINK1-PARK2 system are reduced in SIRT5-overexpressing and increased in SIRT5-silenced cells or in WT cells treated with a SIRT5 inhibitor. Again these biological effects of SIRT5 manipulation are due to the control of glutamine metabolism and ammonia-induced autophagy by SIRT5. In fact, inhibition of GLS with BPTES, inhibition of anaplerosis with dimethyl-α-ketoglutarate and, L-glutamine withdrawal reduced mitophagy marker BNIP3 (). By contrast, ammonia supplementation increased mitophagy by accumulating BNIP3, PINK1, and PARK2 (). Our results suggest that SIRT5 downregulation observed in tumors can activate the protective effects of ammonia-induced autophagy toward stressful conditions such as for example hypoxia or chemotherapy. Activation of mitophagy observed in SIRT5-silenced cells is probably due to the loss of membrane potential and to the reduced size of mitochondria observed in these cells and may, again, represent a protective mechanism for these cells by removing damaged and dysfunctional mitochondria that could, for example, produce high levels of toxic products. All these effects are absent when SIRT5 is present or overexpressed. In this case, we observed mitochondria with elongated shape, widely distributed in the cells and, with high membrane potential (). Mitochondria from SIRT5-silenced cells or cells treated with a SIRT5 inhibitor, also show a decrease of ATP content when treated with the glycolysis inhibitor 2DG and increased lactate production. However, the drop of extracellular pH was from 7.4 to 6.7 in WT cells as well as in SIRT5 clones. One possible explanation is that glutamate produced by GLS is further oxidized to yield CO2 and HCO3−. Bicarbonate accumulation can, in turn, buffer protons in culture medium. Therefore, the situation could be similar to that reported by Atkinson and BourkeCitation64 to explain how metabolic acidosis can be counteracted by increasing GLS activity in the kidney, an event that generates bicarbonate that, in turn, prevents the drop of systemic pHCitation64. In the case of SIRT5-silenced cells, increased GLS activity, herewith documented, would determine an increase glutamate accumulation and oxidation to generate bicarbonate that, in turn, can buffer excess of protons and reduce pH drop.
We also documented a decreased probability of mitophagy induction as testified by lower expression of BNIP3 as well as PINK1 and PARK2 (). The increased mitochondrial size in SIRT5-overexpressing cells was also due to accumulation of fusion proteins MFN2 and OPA1, an event, that, at least for MFN2 was probably due to the reduction of PINK1-PARK2 system that, when accumulating on the mitochondrial membrane, ubiquitinates MFN2 activating the mitophagic process.Citation57 Therefore, we show that, by controlling glutamine metabolism, SIRT5 also controls 2 interlinked processes such as autophagy and mitophagy.
Recently a metabolic characterization of a Sirt5-deficient mouse model has been reported.Citation65 Interestingly, sirt5 KO mice have elevated ammonia blood levels after 24 h fasting, but do not show any metabolic change compared to WT mice under basal conditions.Citation65 These results raise the question about the importance of Sirt5 for metabolic homeostasis. However, as in the case of sirt3 KO mice, it may be necessary to increase or prolong the stress to observe a metabolic difference between sirt5 KO and Sirt5 WT mice. Moreover, the observation of a prenatal loss of 40% of sirt5 KO offspring is particularly interesting for 2 reasons: i) it may be related to an imbalance in glutamine metabolism and autophagy that would result in embryonic malformations and death;Citation66 ii) it may be that the surviving offspring are born because were able to bypass the metabolic imbalance, due to Sirt5 absence, by increasing the activity or expression of other sirtuins or mitochondrial enzymes. In fact, as also suggested by Yu et al., mitochondrial sirtuins may be involved in sensing and removal of erroneous acyl modifications in proteins.Citation65 These would be the reasons why it may be necessary to prolong the stress on sirt5 KO mice in order o observe metabolic changes. Finally, it would be interesting to measure glutamine metabolism in sirt5 KO mice as well as behavioral abnormalities under prolonged fasting that may be caused by increased damage to the brain because of excessive ammonia.
Another interesting aspect is that our results are in agreement and complete those recently published by Csibi et al., in which the authors report that the CRTC1 (CREB-regulated transcription coactivator 1) pathway increases glutamine metabolism by removing SIRT4 inhibition on GLUD1.Citation67 In fact, GLUD1 is the enzyme that, in glutaminolysis, follows the GLS catalysis of the reaction that transforms glutamate in α-ketoglutarate with ammonia release.Citation67 Studies show that SIRT4 is downregulated in human cancer and that SIRT4 overexpression reduces tumor formation, however, they do not report ammonia levels in the absence or overexpression of SIRT4 and autophagy induction. Citation67 Based on their and our results, we can predict that both SIRT5 and SIRT4 controls the 2 sequential steps of glutamine metabolism. SIRT5 would inhibit GLS activity and transformation of glutamine to glutamate with ammonia production whereas, SIRT4 would inhibit GLUD1 activity and transformation of glutamate to α-ketoglutarate with, again, ammonia production. However, in our experiments we could not detect an interaction, through immunoprecipitation, between SIRT5 with GLUD1 whereas we were able to observe a GLUD1-SIRT3 coimmunoprecipitation (Fig. S3). Therefore, both SIRT4 and SIRT5 would regulate glutamine homeostasis and ammonia levels. It is also interesting to notice that SIRT5 and SIRT4 inhibitory effects are achieved by 2 different post-translational modifications, that is: desuccinylation and ADP-ribosylation, respectively. According to us this allows for a tighter control of an important metabolic pathway such as glutamine homeostasis. Finally, additionally the other mitochondrial sirtuin SIRT3 controls glutamine homeostasis by deacetylating and activating GLUD1 to regulate the TCA cycle.Citation68 Therefore, glutamine homeostasis may represent the first example of a pathway regulated by all 3 mitochondrial sirtuins and for this reason is an important metabolic target.
A schematic representation of our findings explaining the central role of SIRT5 in controlling ammonia-induced autophagy and mitophagy is drawn in . SIRT5 by inhibiting the activity of GLS reduces ammonia released in the presence of glutamine. Ammonia reduction is accompanied by a reduction of ammonia-induced autophagy and mitophagy as measured by the markers listed in the figure.
Figure 10. Schematic representation of SIRT5 control of glutamine metabolism and ammonia-induced autophagy and mitophagy. SIRT5 controls ammonia-induced autophagy and mitophagy by regulating glutamine metabolism.
Our new findings on the role of SIRT5 in glutamine metabolism are important because of potential implication in numerous human pathologies such as tumor development, neurodegenerative diseases, hepatic encephalopathy, etc. that are due to blood ammonia accumulation.Citation69-71 In fact, one could foresee that SIRT5 activation would result in a decrease of ammonia produced in the presence of glutamine. In the case of tumor development, ammonia-induced autophagy has been regarded as a protective mechanism for tumor cells. Therefore, SIRT5 activation would reduce ammonia-induced autophagy reducing also the ability of tumor cells to survive to chemotherapy or other stresses such as hypoxia or nutrient starvation. In the case of pathologies related to ammonia accumulation, SIRT5 activation could be beneficial for reducing damage to cells sensitive to ammonia accumulation such as astrocytes.Citation39,70
Materials and Methods
Cell culture
The MDA-MB-231 human breast carcinoma cell line and the C2C12 mouse myoblast cell line were purchased from LGC Standards (HTB-26 and CRL-1772, respectively). MDA-MB-231 were maintained in RPMI 1640 medium (Sigma-Aldrich, R0883), C2C12 were maintained in Dulbecco's Modified Eagle's Medium (DMEM; Sigma-Aldrich, D65446). Both mediums were supplemented with 1% penicillin/streptomycin, 2 mM L-glutamine (Sigma-Aldrich, G7513) and 10% heat-inactivated fetal bovine serum (Sigma-Aldrich, F9665). Cells were maintained at 37°C in a humidified atmosphere of 5% CO2 and 95% air. Under these conditions, pH of DMEM was about 7.7. For glutamine withdrawal experiments, cells were grown, for the time indicated, in complete medium without the addition of L-glutamine.
Treatment protocols and antibodies
Bafilomycin A1 (Sigma-Aldrich, B1793) was dissolved in Me2SO and added to a final concentration of 100 nM for the times indicated. BPTES (Sigma-Aldrich, SML0601) was dissolved in Me2SO and added to a final concentration of 10 μM for the times indicated. Hexachlorophene (Sigma-Aldrich, H4625) was dissolved in Me2SO and added to a final concentration of 5 μM for 24 h. Dimethyl-α-ketoglutarate was synthesized and provided by Prof. Mai and added to a 1 mM final concentration. Ammonium chloride (NH4Cl) (Sigma Aldrich, A0171) was dissolved in water and added to a final concentration of 1, 2, or 10 mM for the indicated times. 2DG (Sigma Aldrich, D8375) was dissolved in water and added to a final concentration of 10 mM.
Antibodies used: SIRT5 (Abcam, 13697), MAP1LC3B (Novus Biologicals, NB600-1384), GABARAP and GABARAPL2 (MBL International Corporation, PM037 and PM038, respectively), SQSTM1 (Santa Cruz Biotechnology, sc-48402), BNIP3 (Santa Cruz Biotechnology, sc-56167), MFN2 (Abnova, H00009927-M07), OPA1 (Novus Biologicals, H00004976-D01P), PINK1 (Santa Cruz Biotechnology, sc-33796), PARK2 (Santa Cruz Biotechnology, sc-32282), GLS (Novus Biologicals, H00002744-M01), GLUL (Novus Biologicals, H00002752-M02), GLUD1 (Santa Cruz Biotechnology, sc-160382), SIRT3 (Cell Signaling Technology, 2627), succinyl lysine (PTM-Biolabs, PTM 419), acetylated lysine (Cell Signaling Technology, 9447), ACTB (Santa Cruz Biotechnology, sc-8432), COX4I1 (Santa Cruz Biotechnology, sc-69359).
Biochemical assays
Accumulation of lactate in the culture medium was determined using lactate assay kit II (Sigma-Aldrich, MAK065) according to the manufacturer's protocol. ATP levels in cells were determined by using the ADP/ATP ratio assay kit (Sigma-Aldrich, MAK135) according to the manufacturer's protocol. Glutamate levels in cell lines were determined by using the glutamate assay kit (Sigma-Aldrich, MAK004) according to the manufacturer's protocol. GLUD1 activity was determined by using the glutamate dehydrogenase activity assay kit (Sigma-Aldrich, MAK099) according to the manufacturer's protocol. All assays were performed in triplicate and the results compared to the control values.
SIRT5 inhibitor
Unless otherwise stated, in all experiments, cells were treated with 50 μM of SIRT5 inhibitor MC3482 for 24 h. The synthesis and characterization of MC3482 is reported in supplementary materials.
Generation of SIRT5-overexpressing and silenced stable transfectants
MDA-MB-231 and C2C12 cells were stably transfected with a pcDNA3.1 expression vector encoding human and mouse SIRT5-Flag (Addgene, 13816) for overexpression and for human SIRT5 and mouse Sirt5 shRNAs for silencing. Stable clones were generated by delivering plasmid DNA constructs into cells using TurboFectin 8.0 (Origene Technologies, TF81001) according to the manufacturer's recommendations. Briefly, cells were seeded on a 24-well plate. The following day the cells were transfected. TurboFectin reagents were first mixed with serum-free RPMI at room temperature for 5 min. Subsequently, plasmid DNA was added to the TurboFectin-containing media and incubated at room temperature for 30 min. After that, the mixtures were added to the cells. The selection of stable overexpressing and silenced clones was started 24 h later with the addition of 500 μg/ml of geneticin (Sigma-Aldrich, A1720).
SIRT5 desuccinylating activity assay
SIRT5 desuccinylating activity was determined using a SIRT5 Fluorimetric Activity Assay/Drug Discovery Kit (Enzo Life Science, BML-AK513-0001) following the manufacturer's protocol. In brief, the mitochondrial extract (5 μg) was incubated with the Fluor de Lys substrate buffer at 37°C for 40 min. followed by incubation with Fluor de Lys Developer at 37°C for 15 min. After excitation at 360 nm, emitted light was detected at 460 nm using Glomax multi detection system (Promega, 20137 Milan, Italy). The fluorescence intensity of the assay buffer was subtracted from each experimental sample.
SIRT1 and SIRT3 deacetylase activity assay
SIRT1 and SIRT3 deacetylase activity was determined using a SIRT1 or SIRT3 Fluorimetric Activity Assay/Drug Discovery Kit (Enzo Life Science, BML-AK555-0001 and BML-AK557-0001, respectively) following the manufacturer's protocol. In brief, the whole (for SIRT1) or mitochondrial (for SIRT3) extract (5 μg) was incubated with the Fluor de Lys substrate buffer at 37°C for 1 h followed by incubation with Fluor de Lys Developer at 37°C for 40 min. After excitation at 360 nm, emitted light was detected at 460 nm using a Glomax multi detection system. The fluorescence intensity of the assay buffer was subtracted from each experimental sample.
Ammonia-level assay
Ammonia levels in cell-conditioned medium was determined by using the ammonia assay kit (Sigma-Aldrich, AA0100) following the manufacturer's protocol. Briefly, cells were grown for several days and medium was collected every other day. 100 μl of cell medium was mixed with 1 ml of ammonia assay reagent and incubated or 5 min at room temperature. Afterwards, 10 μl of glutamate dehydrogenase solution was added. After 5 min absorbance was read at 340 nm in a Glomax multi detection system. In all measurements ammonia production in the absence of cells was subtracted from each experiments.
Autophagic proteolysis assessment
Autophagic proteolysis of long-lived proteins was determined by using the Click-iT metabolic labeling for proteins (Life Technologies, C10428) according to the methodology of Zhang et al.Citation72 Briefly, cells with 70% confluency were cultured in a 96-well plate (for fluorimeter measurements) or in a glass coverslip (for confocal microscopy). The day after cells were washed in phosphate buffered saline (PBS; Sigma-Aldrich, P4417) and then cultured in L-methionine-free medium for 2 h to deplete intracellular methionine reserves. Cells were then pulsed for 18 h with 50 μM Click-iT AHA (L-azidohomoalanine; Life Technologies, C10428) in methionine-free medium with 10% dialyzed fetal bovine serum to eliminate also this source of methionine. Afterward, cells were washed with PBS+3% BSA (Sigma-Aldrich, A2153) and cultured for 2 h in complete medium containing methionine to chase out short-lived proteins. Cells then underwent various treatments as indicated in the figures legends. Starvation was achieved by incubating cells in amino acid free medium supplemented with 0.1% BSA and 2 mM L-methionine. Subsequently, cells were fixed in 4% paraformaldehyde for 15 min and permeabilized in 0.5% Triton X-100 (Sigma-Aldrich, T9284) for 20 min at room temperature. Finally cells were washed in PBS + 3% BSA. The detection click reaction was obtained by incubating fixed cells for 2 h with alkine-Alexa Fluor 488 (Life Technologies, C10428) in Click-iT cell reaction buffer kit. The reaction mixture was removed by washing samples with PBS+3% BSA. Fluorescence from labeled long-lived proteins was measured using Glomax multidetection system. The fluorescence intensity of the assay buffer was subtracted from each experimental sample. Alternatively, fluorescence from labeled cells on the coverslips was observed using a LSM 510 confocal microscopy (Zeiss, 20020 Milan, Italy).
Docking protein-protein
The docking program Hex 6.1Citation37 has been used to evaluate possible interactions between SIRT5 and GLS. The X-ray structural coordinates of both SIRT5 and the catalytic domain of human kidney GLS have been obtained from the Protein Data Bank database (www.pdb.orgCitation73) with the ID codes: 3RIY and 3VOY, respectively.
A protein-protein docking analysis has been preformed with the GLS structure assembled into a tetramer. After adding the hydrogen atoms, removing the ligands and the water molecules, the molecular docking has been carried out using shape + electrostatics correlation mode, grid size of 0.4 Å to obtain 50000 solutions.Citation46 The first high score 200 docking models were examined to choose the best interaction complex, taking into account the surface complementarity and the total energy of the complex. Inspection of the complexes was performed using the Chimera version 1.8 molecular graphics program.Citation74 The complex chosen for the structural analysis shows a favorable value of protein-protein interaction energy of -242.3 kJ/mol.
Protein extraction and western blot assay
Cells (1 × 10Citation6) for whole cell lysate were pelleted at 700 × g (5 min at 4°C) and lysed in 50 μl of cell lysis buffer (20 mM Tris, pH 7.4, 100 mM NaCl, 1% Triton X-100, 1 mM phenylmethylsulfonyl fluoride [Sigma-Aldrich, P7626], 10 μg/ml leupeptin [Sigma-Aldrich, L9783], 10 μg/ml aprotinin [Sigma-Aldrich, A3428]). After 30 min on ice, the lysates were clarified by centrifugation (10 min at 4°C) and the supernatant fraction was collected. Protein concentration was determined by the Bradford assay (Bio-Rad, 500-0002). Equivalent amounts of protein were electrophoresed on SDS-polyacrylamide gels. Kaleidoscope Prestained Standards (Bio-Rad, 161-0375) were used to determine molecular weight. The gels were then electroblotted onto PVDF (Bio-Rad, 162-0219) membranes. After blocking with 5% milk, membranes where incubated with the primary antibody overnight. Finally, the relevant protein was visualized by staining with the appropriate secondary horseradish peroxidase-labeled antibody for 1 h followed by enhanced chemiluminescence. Densitometric analysis of the bands, relative to ACTB of COX4I1, was performed using Image J software (National Institutes of Health).
Mitochondria isolation
Cells (2 × 10Citation6) were plated in 100 mm dishes. Following treatment the cells were scraped off the plate using a rubber policeman and centrifuged at 700 × g for 10 min at 4°C. The cell pellets were resuspended in 1 ml of 20 mm HEPES-KOH, pH 7.5, 10 mm KCl, 1.5 mm MgCl2, 1 mm EDTA, 1 mm EGTA, 1 mm phenylmethylsulfonyl fluoride, 10 μg/ml leupeptin, 10 μg/ml aprotinin, and 250 mm sucrose (Sigma-Aldrich, S9378). The cells were broken open with 6 passages through a 26-gauge needle applied to a 1-ml syringe. The homogenate was centrifuged at 1000 g for 5 min at 4°C. The supernatant fraction was transferred to a high-speed centrifuge tube and centrifuged at 10,000 g for 25 min at 4°C. The pellet (mitochondrial) fraction was lysed in 50 mM Tris (tris[hydroxymethyl]aminomethane)–HCl, 150 mM NaCl, 1% Triton X-100, 0,1% Nonidet P-40 (Sigma-Aldrich, 74388), 1 mM phenylmethylsulfonyl fluoride, 10 μg/ml leupeptin, 10 μg/ml aprotinin. Protein concentration of the fraction was determined by the Bradford assay (Bio-Rad). The purity as well as equal loading of mitochondrial fraction was determined by measuring levels of mitochondrial protein COX4I1.
Electron microscopy
MDA-MB-231 cells were trypsinized and pelleted. The cells were then suspended and fixed overnight at 4°C in 2% glutaraldehyde with 1% tannic acid in 0.1 M sodium cacodylate, pH 7.3. The cells were rinsed 3 times in the sodium cacodylate buffer and then incubated in 2% osmium tetroxide in the same buffer for 2 h at room temperature. The cells were then rinsed 3 times in distilled water and exposed to 1% uranyl acetate in water for 15 min at room temperature. The cells were rinsed twice in distilled water, spun down into 3% agarose at 45°C, and cooled to form blocks. The agarose blocks were dehydrated in graded steps of acetone and embedded in Spurr’ low viscosity media. Following polymerization overnight at 65°C, 80-nm sections were cut on a Reighert-Jung Ultra cut E ultramicrotome (Leica Microsystems, 20132 Milan, Italy) and picked up on copper grids. The grids were post-stained in uranyl acetate and bismuth subnitrate. The sections were observed in a Philips CM-10 TEM (FEI Italia, 20122 Milan, Italy) and micrographs recorded on Kodak 4489 sheet film.
PEG fusion assay
Forty thousand cells labeled with Mitotracker Green (40 nM; Life Technologies, M7514) were cultured overnight on 25-mm coverslips with 40.000 cells labeled with Mitotracker Red (10 nM; Life Technologies, M22426). The next morning, cells were fused for 60 s with 50% PEG 1500 (Roche, 10783641001). The cells were washed and grown for 7 h in growth medium. Afterwards, coverslips were visualized in a LSM 510 confocal microscopy (Zeiss).
Mitochondria staining and determination of the ΔΨmt
Mitochondrial morphology and membrane potential (ΔΨmt), were analyzed by using the ΔΨmt sensitive dye 5,5′,6,6′-tetrachloro-1,1′,3,3′-tetraethylbenzimidazolylcarbocyanine iodide (JC-1) (Life Technologies, T3168). Cells (1 × 10Citation4) were cultured on 25-mm coverslips placed in a 6-well plate. The day after, cells were incubated in fresh media containing 10 μM JC-1 for 15 min at 37°C. After 2 washes in PBS to remove the excess of JC1, cell staining was determined by analysis on a LSM 510 confocal microscopy (Zeiss).
Immunoprecipitation assay
Proteins were extracted as mentioned above. After determining protein concentration using the Bradford assay, 500 μg of the lysate was brought to a final volume of 1 ml with PBS. Lysates were precleared with 1 μg of appropriate control IgG (Santa Cruz Biotechnology, sc-2763) and 20 μl of protein A/G PLUS-agarose (Santa Cruz Biotechnology, sc-2003) and kept on a rotator for 1 h at 4°C. Lysates were centrifuged (500 × g for 5 min at 4°C) and 2 μg of GLS, SIRT5 or GLUD1 antibody or corresponding IgG was added to the precleared lysates and kept on ice for approximately 3 to 5 h. Following incubation, 30 μl of protein A/G PLUS-agarose was added to each tube and kept on a rotator overnight at 4°C. Lysates were then centrifuged (500 × g for 5 min at 4°C). The pellet fractions were washed 4 times with PBS and then resuspended in 20 μl of loading buffer. Samples were electrophoresed on an 8% SDS-polyacrylamide gel and immunoblotted with the appropriate antibody as indicated in the figures.
Statistical analysis
The results are expressed as means + standard deviations (s.d.) and 95% confidence intervals (95% CI). Before using parametric tests, the assumption of normality was verified using the Shapiro-Wilk W-test. The Student paired t test was used to determine any significant differences before and after treatment. Significance was set at 0.05 (P ≤ 0.05). SPSS statistical software package (SPSS Inc., Version 13.0.1 for Windows Chicago, IL, USA) was used for all statistical calculations.
Disclosure of Potential Conflicts of Interest
No potential conflicts of interest were disclosed.
Supplemental Material
Supplemental data for this article can be accessed on the publisher's website.
SupplementaryMaterial.zip
Download Zip (3.3 MB)Acknowledgments
Authors wish to thank M. Falconi for his help with the protein-protein docking analysis and S. Ilari for her help with the glutamate measurements.
Funding
This work was partially supported by the Italian Space Agency grant DC-DTE-2011-2013, by FIRB RBFR10ZJQT, Sapienza Ateneo Project 2013, IIT-Sapienza Project, FP7 Project BLUEPRINT/282510, by PRIN 2012 (prot. 2012 CTAYSY) and by PRIN 2010-2011 (prot. 2010 S7CET4_004). This work was also supported by BMBF grant ProNet-T3 to M. Schutkowski.
References
- Mizushima N, Levine B, Cuervo AM, Klionsky DJ. Autophagy fights disease through cellular self-digestion. Nature 2008; 451:1069-75; PMID:1830553810.1038/nature06639
- Nakahira K, Cloonan SM, Mizumura K, Choi AM, Ryter SW. Autophagy: a crucial moderator of redox balance, inflammation, and apoptosis in lung disease. Antioxid Redox Signal 2014; 20:474-94; PMID:23879400; http://dx.doi.org/10.1089/ars.2013.5373
- Di Bartolomeo S, Corazzari M, Nazio F, Oliverio S, Lisi G, Antonioli M, Pagliarini V, Matteoni S, Fuoco C, Giunta L, et al. The dynamic interaction of AMBRA1 with the dynein motor complex regulates mammalian autophagy. J Cell Biol 2010; 191:155-68; PMID:20921139; http://dx.doi.org/10.1083/jcb.201002100
- Itakura E, Kishi C, Inoue K, Mizushima N. Beclin 1 forms two distinct phosphatidylinositol 3-kinase complexes with mammalian Atg14 and UVRAG. Mol Biol Cell. 2008; 19:5360-72; PMID:18843052; http://dx.doi.org/10.1091/mbc.E08-01-0080
- Kubli DA, Gustafsson ÅB. Mitochondria and mitophagy: the yin and yang of cell death control. Circ Res. 2012; 111:1208-21; PMID:23065344; http://dx.doi.org/10.1161/CIRCRESAHA.112.265819
- Chan EY, Longatti A, McKnight NC, Tooze SA. Kinase-inactivated ULK proteins inhibit autophagy via their conserved C-terminal domains using an Atg13-independent mechanism. Mol Cell Biol 2009; 29:157-71; PMID:18936157; http://dx.doi.org/10.1128/MCB.01082-08
- Nakagawa T, Guarente L. Sirtuins at a glance. J Cell Sci 2011; 124:833-8; PMID:21378304; http://dx.doi.org/10.1242/jcs.081067
- Merksamer PI, Liu Y, He W, Hirschey MD, Chen D, Verdin E. The sirtuins, oxidative stress and aging: an emerging link. Aging (Albany NY). 2013; 5:144-50; PMID:23474711
- Sauve AA, Youn DY. Sirtuins: NAD(+)-dependent deacetylase mechanism and regulation. Curr Opin Chem Biol 2012; 16:535-43; PMID:23102634; http://dx.doi.org/10.1016/j.cbpa.2012.10.003
- Radak Z, Koltai E, Taylor AW, Higuchi M, Kumagai S, Ohno H, Goto S, Boldogh I. Redox-regulating sirtuins in aging, caloric restriction, and exercise. Free Radic Biol Med 2013; 58:87-97; PMID:23339850; http://dx.doi.org/10.1016/j.freeradbiomed.2013.01.004
- Sack MN, Finkel T. Mitochondrial metabolism, sirtuins, and aging. Cold Spring Harb Perspect Biol 2012; 4 (12); PMID:23209156
- Lee IH, Cao L, Mostoslavsky R, Lombard DB, Liu J, Bruns NE, Tsokos M, Alt FW, Finkel T. A role for the NAD-dependent deacetylase Sirt1 in the regulation of autophagy. Proc Natl Acad Sci U S A 2008; 105:3374-9; PMID:18296641; http://dx.doi.org/10.1073/pnas.0712145105
- Nezis IP, Stenmark H. p62 at the interface of autophagy, oxidative stress signaling, and cancer. Antioxid Redox Signal 2012; 17:786-93; PMID:22074114; http://dx.doi.org/10.1089/ars.2011.4394
- Daitoku H, Sakamaki J, Fukamizu A. Regulation of FoxO transcription factors by acetylation and protein-protein interactions. Biochim Biophys Acta 2011; 1813:1954-60; PMID:21396404; http://dx.doi.org/10.1016/j.bbamcr.2011.03.001
- Kanamori H, Takemura G, Goto K, Tsujimoto A, Ogino A, Takeyama T, Kawaguchi T, Watanabe T, Morishita K, Kawasaki M, et al. Resveratrol reverses remodeling in hearts with large, old myocardial infarctions through enhanced autophagy-activating AMP kinase pathway. Am J Pathol 2013; 182:701-13; PMID:23274061; http://dx.doi.org/10.1016/j.ajpath.2012.11.009
- Wang P, Guan YF, Du H, Zhai QW, Su DF, Miao CY. Induction of autophagy contributes to the neuroprotection of nicotinamide phosphoribosyltransferase in cerebral ischemia. Autophagy 2012; 8:77-87; PMID:22113203; http://dx.doi.org/10.4161/auto.8.1.18274
- Morselli E, Maiuri MC, Markaki M, Megalou E, Pasparaki A, Palikaras K, Criollo A, Galluzzi L, Malik SA, Vitale I, et al. Caloric restriction and resveratrol promote longevity through the Sirtuin-1-dependent induction of autophagy. Cell Death Dis 2010; 1:e10 PMID:21364612
- Jeong JK, Moon MH, Lee YJ, Seol JW, Park SY. Autophagy induced by the class III histone deacetylase Sirt1 prevents prion peptide neurotoxicity. Neurobiol Aging 2013; 34:146-56; PMID:22575359; http://dx.doi.org/10.1016/j.neurobiolaging.2012.04.002
- Chen ML, Yi L, Jin X, Liang XY, Zhou Y, Zhang T, Xie Q, Zhou X, Chang H, Fu YJ, et al. Resveratrol attenuates vascular endothelial inflammation by inducing autophagy through the cAMP signaling pathway. Autophagy 2013; 9:2033-45; PMID:24145604; http://dx.doi.org/10.4161/auto.26336
- Zhao Y, Yang J, Liao W, Liu X, Zhang H, Wang S, Wang D, Feng J, Yu L, Zhu WG. Cytosolic FoxO1 is essential for the induction of autophagy and tumour suppressor activity. Nat Cell Biol 2010; 12:665-75; PMID:20543840; http://dx.doi.org/10.1038/ncb2069
- Gal J, Bang Y, Choi HJ. SIRT2 interferes with autophagy-mediated degradation of protein aggregates in neuronal cells under proteasome inhibition. Neurochem Int. 2012; 61:992-1000; PMID:22819792; http://dx.doi.org/10.1016/j.neuint.2012.07.010
- Petrilli A, Bott M, Fernández-Valle C. Inhibition of SIRT2 in merlin/NF2-mutant Schwann cells triggers necrosis. Oncotarget 2013; 4:2354-65; PMID:24259290
- Nakagawa T, Lomb DJ, Haigis MC, Guarente L. SIRT5 Deacetylates carbamoyl phosphate synthetase 1 and regulates the urea cycle. Cell 2009; 137:560-70; PMID:19410549; http://dx.doi.org/10.1016/j.cell.2009.02.026
- Nakagawa T, Guarente L. Urea cycle regulation by mitochondrial sirtuin, SIRT5. Aging (Albany NY) 2009; 1:578-81; PMID:20157539
- Du J, Zhou Y, Su X, Yu JJ, Khan S, Jiang H, Kim J, Woo J, Kim JH, Choi BH, et al. Sirt5 is a NAD-dependent protein lysine demalonylase and desuccinylase. Science 2011; 334:806-9; PMID:22076378; http://dx.doi.org/10.1126/science.1207861
- Tan M, Peng C, Anderson KA, Chhoy P, Xie Z, Dai L, Park J, Chen Y, Huang H, Zhang Y, et al. Lysine glutarylation is a protein posttranslational modification regulated by SIRT5. Cell Metab 2014; 19:605-17; PMID:24703693; http://dx.doi.org/10.1016/j.cmet.2014.03.014
- Rardin MJ, He W, Nishida Y, Newman JC, Carrico C, Danielson SR, Guo A, Gut P, Sahu AK, Li B, et al. SIRT5 regulates the mitochondrial lysine succinylome and metabolic networks. Cell Metab 2013; 18:920-33; PMID:24315375; http://dx.doi.org/10.1016/j.cmet.2013.11.013
- Park J, Chen Y, Tishkoff DX, Peng C, Tan M, Dai L, Xie Z, Zhang Y, Zwaans BM, Skinner ME, et al. SIRT5-mediated lysine desuccinylation impacts diverse metabolic pathways. Mol Cell 2013; 50:919-30; PMID:23806337; http://dx.doi.org/10.1016/j.molcel.2013.06.001
- Eng CH, Yu K, Lucas J, White E, Abraham RT. Ammonia derived from glutaminolysis is a diffusible regulator of autophagy. Sci Signal 2010; 3:ra31; PMID:20424262
- Eng CH, Abraham RT. Glutaminolysis yields a metabolic by-product that stimulates autophagy. Autophagy 2010; 6:968-70; PMID:20724823; http://dx.doi.org/10.4161/auto.6.7.13082
- Cheong H, Lindsten T, Wu J, Lu C, Thompson CB. Ammonia-induced autophagy is independent of ULK1/ULK2 kinases. Proc Natl Acad Sci U S A 2011; 108:11121-6; PMID:21690395; http://dx.doi.org/10.1073/pnas.1107969108
- Wise DR, Thompson CB. Glutamine addiction: a new therapeutic target in cancer. Trends Biochem Sci 2010; 35:427-33; PMID:20570523; http://dx.doi.org/10.1016/j.tibs.2010.05.003
- DeBerardinis RJ, Cheng T. Q's next: the diverse functions of glutamine in metabolism, cell biology and cancer. Oncogene 2010; 29:313-24; PMID:19881548; http://dx.doi.org/10.1038/onc.2009.358
- Cassago A, Ferreira AP, Ferreira IM, Fornezari C, Gomes ER, Greene KS, Pereira HM, Garratt RC, Dias SM, Ambrosio AL. Mitochondrial localization and structure-based phosphate activation mechanism of Glutaminase C with implications for cancer metabolism. Proc Natl Acad Sci U S A 2012; 109:1092-7; PMID:22228304; http://dx.doi.org/10.1073/pnas.1112495109
- Thangavelu K, Pan CQ, Karlberg T, Balaji G, Uttamchandani M, Suresh V, Schüler H, Low BC, Sivaraman J. Structural basis for the allosteric inhibitory mechanism of human kidney-type glutaminase (KGA and its regulation by Raf-Mek-Erk signaling in cancer cell metabolism. Proc Natl Acad Sci U S A 2012; 109:7705-10; PMID:22538822; http://dx.doi.org/10.1073/pnas.1116573109
- Aledo JC, de Pedro E, Gómez-Fabre PM, Núñez de Castro I, Márquez J. Submitochondrial localization and membrane topography of Ehrlich ascitic tumour cell glutaminase. Biochim Biophys Acta. 1997; 1323:173-84; PMID:9042341; http://dx.doi.org/10.1016/S0005-2736(96)00189-7
- Szeliga M, Obara-Michlewska M. Glutamine in neoplastic cells: focus on the expression and roles of glutaminases. Neurochem Int. 2009; 55:71-5; PMID:19428809; http://dx.doi.org/10.1016/j.neuint.2009.01.008
- DeBerardinis RJ, Mancuso A, Daikhin E, Nissim I, Yudkoff M, Wehrli S, Thompson CB. Beyond aerobic glycolysis: transformed cells can engage in glutamine metabolism that exceeds the requirement for protein and nucleotide synthesis. Proc Natl Acad Sci U S A 2007; 104:19345-50; PMID:18032601; http://dx.doi.org/10.1073/pnas.0709747104
- Rama Rao KV, Norenberg MD. Glutamine in the Pathogenesis of Hepatic Encephalopathy: The Trojan Horse Hypothesis Revisited. Neurochem Res. 2014; 39:593-8
- Wilkinson DJ, Smeeton NJ, Watt PW. Ammonia metabolism, the brain and fatigue; revisiting the link. Prog Neurobiol. 2010; 91:200-19; PMID:20138956; http://dx.doi.org/10.1016/j.pneurobio.2010.01.012
- Romero-Garcia S, Lopez-Gonzalez JS, Báez-Viveros JL, Aguilar-Cazares D, Prado-Garcia H. Tumor cell metabolism: an integral view. Cancer Biol Ther. 2011; 12:939-48; PMID:22057267; http://dx.doi.org/10.4161/cbt.12.11.18140
- Soga T. Cancer metabolism: key players in metabolic reprogramming. Cancer Sci 2013; 104:275-81; PMID:23279446; http://dx.doi.org/10.1111/cas.12085
- Katt WP, Cerione RA. Glutaminase regulation in cancer cells: a druggable chain of events. Drug Discov Today 2014; 19:450-7.
- Cooper AJ. The role of glutamine synthetase and glutamate dehydrogenase in cerebral ammonia homeostasis. Neurochem Res 2012; 37:2439-55; PMID:22618691; http://dx.doi.org/10.1007/s11064-012-0803-4
- DeBerardinis RJ, Lum JJ, Hatzivassiliou G, Thompson CB. The biology of cancer: metabolic reprogramming fuels cell growth and proliferation. Cell Metab 2008; 7:11-20; PMID:18177721; http://dx.doi.org/10.1016/j.cmet.2007.10.002
- Ghoorah AW, Devignes MD, Smaïl-Tabbone M, Ritchie DW. Protein docking using case-based reasoning. Proteins 2013; 81:2150-8; http://dx.doi.org/10.1002/prot.24433
- Verdin E, Hirschey MD, Finley LW, Haigis MC. Sirtuin regulation of mitochondria: energy production, apoptosis, and signaling. Trends Biochem Sci 2010; 35:669-75; PMID:20863707; http://dx.doi.org/10.1016/j.tibs.2010.07.003
- Zhou Y, Zhang H, He B, Du J, Lin H, Cerione RA, Hao Q. The bicyclic intermediate structure provides insights into the desuccinylation mechanism of human sirtuin 5 (SIRT5. J Biol Chem 2012; 287:28307-14; PMID:22767592; http://dx.doi.org/10.1074/jbc.M112.384511
- Godfrey S, Kuhlenschmidt T, Curthoys P. Correlation between activation and dimer formation of rat renal phosphate-dependent glutaminase. J Biol Chem. 1977; 252:1927-31; PMID:845154
- Morehouse RF, Curthoys NP. Properties of rat renal phosphate-dependent glutaminase coupled to Sepharose. Evidence that dimerization is essential for activation. Biochem J 1981; 193:709-16; PMID:7305957
- Sievers F, Wilm A, Dineen D, Gibson TJ, Karplus K, Li W, Lopez R, McWilliam H, Remmert M, Söding J, et al. Fast, scalable generation of high-quality protein multiple sequence alignments using Clustal Omega. Mol Syst Biol 2011; 7:539; PMID:21988835; http://dx.doi.org/10.1038/msb.2011.75
- Klionsky DJ, Abdalla FC, Abeliovich H, Abraham RT, Acevedo-Arozena A, Adeli K, Agholme L, Agnello M, Agostinis P, Aguirre-Ghiso JA, et al., Guidelines for the use and interpretation of assays for monitoring autophagy. Autophagy 2012; 8:445-544; PMID:22966490; http://dx.doi.org/10.4161/auto.19496
- Hanna RA, Quinsay MN, Orogo AM, Giang K, Rikka S, Gustafsson ÅB. Microtubule-associated protein 1 light chain 3 (LC3 interacts with Bnip3 protein to selectively remove endoplasmic reticulum and mitochondria via autophagy. J Biol Chem 2012; 287:19094-104; PMID:22505714; http://dx.doi.org/10.1074/jbc.M111.322933
- Narendra D, Tanaka A, Suen DF, Youle RJ. Parkin is recruited selectively to impaired mitochondria and promotes their autophagy. J Cell Biol 2008; 183:795-803; PMID:19029340; http://dx.doi.org/10.1083/jcb.200809125
- Geisler S, Holmström KM, Skujat D, Fiesel FC, Rothfuss OC, Kahle PJ, Springer W. PINK1/Parkin-mediated mitophagy is dependent on VDAC1 and p62/SQSTM1. Nat Cell Biol. 2010; 12:119-31; PMID:20098416; http://dx.doi.org/10.1038/ncb2012
- Poole AC, Thomas RE, Yu S, Vincow ES, Pallanck L. The mitochondrial fusion-promoting factor mitofusin is a substrate of the PINK1/parkin pathway. PLoS One 2010; 5:e10054; PMID:20383334; http://dx.doi.org/10.1371/journal.pone.0010054
- Gegg ME, Cooper JM, Chau KY, Rojo M, Schapira AH, Taanman JW. Mitofusin 1 and mitofusin 2 are ubiquitinated in a PINK1/parkin-dependent manner upon induction of mitophagy. Hum Mol Genet 2010; 19:4861-70; PMID:20871098; http://dx.doi.org/10.1093/hmg/ddq419
- Matés JM, Segura JA, Campos-Sandoval JA, Lobo C, Alonso L, Alonso FJ, Márquez J. Glutamine homeostasis and mitochondrial dynamics. Int J Biochem Cell Biol 2009; 41:2051-61; PMID:19703661; http://dx.doi.org/10.1016/j.biocel.2009.03.003
- Twig G, Shirihai OS. The interplay between mitochondrial dynamics and mitophagy. Antioxid Redox Signal 2011; 14:1939-51; PMID:21128700; http://dx.doi.org/10.1089/ars.2010.3779
- Newsholme P, Procopio J, Lima MM, Pithon-Curi TC, Curi R. Glutamine and glutamate–their central role in cell metabolism and function. Cell Biochem Funct 2003; 21:1-9; PMID:12579515; http://dx.doi.org/10.1002/cbf.1003
- Medina MA, Sánchez-Jiménez F, Márquez J, Rodríguez Quesada A, Núñez de Castro I. Relevance of glutamine metabolism to tumor cell growth. Mol Cell Biochem 1992; 113:1-15; PMID:1640933; http://dx.doi.org/10.1007/BF00230880
- Medina MA, Núñez de Castro I. Glutaminolysis and glycolysis interactions in proliferant cells. Int J Biochem 1990; 22:681-3; PMID:2205518; http://dx.doi.org/10.1016/0020-711X(90)90001-J
- Lai CC, Lin PM, Lin SF, Hsu CH, Lin HC, Hu ML, Hsu CM, Yang MY. Altered expression of SIRT gene family in head and neck squamous cell carcinoma. Tumour Biol 2013; 34:1847-54; PMID:23475622; http://dx.doi.org/10.1007/s13277-013-0726-y
- Atkinson DE, Bourke E. Metabolic aspects of the regulation of systemic pH. Am J Physiol. 1987; 252(6 Pt 2: F947-56; PMID:3296786
- Yu J, Sadhukhan S, Noriega LG, Moullan N, He B, Weiss RS, Lin H, Schoonjans K, Auwerx J. Metabolic characterization of a Sirt5 deficient mouse model. Sci Rep. 2013; 3:2806; PMID:24076663
- Wada Y, Sun-Wada GH, Kawamura N, Aoyama M. Role of autophagy in embryogenesis. Curr Opin Genet Dev 2014; 27C:60-66; PMID:24861852; http://dx.doi.org/10.1016/j.gde.2014.03.010
- Csibi A, Fendt SM, Li C, Poulogiannis G, Choo AY, Chapski DJ, Jeong SM, Dempsey JM, Parkhitko A, Morrison T, et al. The mTORC1 pathway stimulates glutamine metabolism and cell proliferation by repressing SIRT4. Cell 2013; 153:840-54; PMID:23663782; http://dx.doi.org/10.1016/j.cell.2013.04.023
- Lombard DB, Alt FW, Cheng HL, Bunkenborg J, Streeper RS, Mostoslavsky R, Kim J, Yancopoulos G, Valenzuela D, Murphy A, et al. Mammalian Sir2 homolog SIRT3 regulates global mitochondrial lysine acetylation. Mol Cell Biol 2007; 27:8807-14; PMID:17923681; http://dx.doi.org/10.1128/MCB.01636-07
- Chen JQ, Russo J. Dysregulation of glucose transport, glycolysis, TCA cycle and glutaminolysis by oncogenes and tumor suppressors in cancer cells. Biochim Biophys Acta 2012; 1826:370-84; PMID:22750268
- Albrecht J, Zielińska M, Norenberg MD. Glutamine as a mediator of ammonia neurotoxicity: A critical appraisal. Biochem Pharmacol. 2010; 80:1303-8; PMID:20654582; http://dx.doi.org/10.1016/j.bcp.2010.07.024
- Häussinger D, Görg B. Interaction of oxidative stress, astrocyte swelling and cerebral ammonia toxicity. Curr Opin Clin Nutr Metab Care. 2010; 13:87-92; PMID:Can't; http://dx.doi.org/10.1097/MCO.0b013e328333b829
- Zhang J, Wang J, Ng S, Lin Q, Shen HM. Development of a novel method for quantification of autophagic protein degradation by AHA labeling. Autophagy. 2014; 10:901-12; PMID:24675368; http://dx.doi.org/10.4161/auto.28267
- Berman HM, Westbrook J, Feng Z, Gilliland G, Bhat TN, Weissig H, Shindyalov IN, Bourne PE. The protein data bank. Nucleic Acids Res 2000; 28:235-42; PMID:10592235; http://dx.doi.org/10.1093/nar/28.1.235
- Pettersen EF, Goddard TD, Huang CC, Couch GS, Greenblatt DM, Meng EC, Ferrin TE. UCSF Chimera–a visualization system for exploratory research and analysis. J Comput Chem 2004; 25:1605-12; PMID:15264254; http://dx.doi.org/10.1002/jcc.20084