
Abstract
Cisplatin is commonly used in ovarian cancer treatment by inducing apoptosis in cancer cells as a result of lethal DNA damage. However, the intrinsic and acquired resistance to cisplatin in cancer cells remains a big challenge for improving overall survival. The cyto-protective functions of autophagy in cancer cells have been suggested as a potential mechanism for chemoresistance. Here, we reported MIR152 as a new autophagy-regulating miRNA that plays a role in cisplatin-resistance. We showed that MIR152 expression was dramatically downregulated in the cisplatin-resistant cell lines A2780/CP70, SKOV3/DDP compared with their respective parental cells, and in ovarian cancer tissues associated with cisplatin-resistance. Overexpression of MIR152 sensitized cisplatin-resistant ovarian cancer cells by reducing cisplatin-induced autophagy, enhancing cisplatin-induced apoptosis and inhibition of cell proliferation. A mouse subcutaneous xenograft tumor model using A2780/CP70 cells with overexpressing MIR152 was established and displayed decreased tumor growth in response to cisplatin. We also identified that ATG14 is a functional target of MIR152 in regulating autophagy inhibition. Furthermore, we found that EGR1 (early growth response 1) regulated the MIR152 gene at the transcriptional level. Ectopic expression of EGR1 enhanced efficacy of chemotherapy in A2780/CP70 cells. More importantly, these findings were relevant to clinical cases. Both EGR1 and MIR152 expression levels were significantly lower in ovarian cancer tissues with high levels of ERCC1 (excision repair cross-complementation group 1), a marker for cisplatin-resistance. Collectively, these data provide insights into novel mechanisms for acquired cisplatin-resistance. Activation of EGR1 and MIR152 may be a useful therapeutic strategy to overcome cisplatin-resistance by preventing cyto-protective autophagy in ovarian cancer.
Abbreviations:
- ANXA5, annexin A5
- ATG14, autophagy-related 14
- CSF1, colony stimulating factor 1 (macrophage)
- EGR1, early growth response 1
- ERCC1, excision repair cross-complementation group 1
- FOXO, forkhead box O
- GFP, green fluorescent protein
- MAPILC3/LC3, microtubule-associated protein 1 light chain 3
- MTOR, mechanistic target of rapamycin
- PI, propidium iodide
- RPS6KB1, ribosomal protein S6 kinase, 70kDa, polypeptide 1
- SQSTM1, sequestosome 1
Introduction
Epithelial ovarian cancers (EOC) remain the most lethal gynecological malignancy due to the heterogeneous nature of the disease and late diagnosis. The standard therapy includes maximum surgical debulking of tumor mass followed by platinum/taxane chemotherapy in which initial response rates may reach 80% high.Citation1 However, the recurrence rate exceeds 75%, and the success of subsequent chemotherapy is limited because of the progressive development of drug resistance.Citation2 Moreover, recurrent ovarian tumors are more aggressive and likely to metastasize to secondary tissues in patients. It is of importance to understand new mechanism(s) of chemoresistance and to develop new strategies for ovarian cancer treatments.
The potential mechanisms underlying platinum-based chemotherapy involve the nuclear excision repair (NER) system, acquired genetic mutation, and oncogenic pathways activated by cisplatin-induced DNA lesions.Citation3 Recent findings support the theory that the cyto-protective functions of autophagy in cancer cells may serve as a potential mechanism for therapeutic resistance. Autophagy is a lysosome degradation response to cellular stressors whereby cellular proteins, organelles, and cytoplasm are engulfed, digested, and recycled to maintain cellular homeostasis.Citation4 Except for its role in physiological process, the implication of autophagy in cancer is complicated and context-dependent. Researchers generally agree that autophagy protects cells from genotoxic stress that can lead to oncogenic transformation by killing cells to prevent tumor initiation. Once tumors are established, autophagy can be used as a survival strategy by cancer cells to overcome the stresses caused by radiation, chemotherapy, or other treatments.Citation5 However, how tumor cells utilize autophagy to prevent radiation- or chemotherapy-mediated cell death remains elusive.
MiRNAs are small, noncoding RNA molecules, which function by modulating the expression levels of target genes through sequence complementarity between miRNAs and their target mRNAs, thus leads to either protein translation inhibition or mRNA degradation.Citation6 Deregulations of miRNA expression profiles have been associated with cancer development and progression, and have been well documented as one of hallmarks of cancer.Citation7 With regards to autophagy, the contribution of post-transcriptional control of autophagy mediated by miRNAs in cancer emerged just recently. It has been shown that miRNAs play roles in regulating autophagy by modulating expression of key autophagy-related proteins.Citation8 As most cancer treatments induce autophagy in drug-resistant cancer cells, we hereby utilized 2 cisplatin-resistant ovarian cancer cell lines A2780/CP70, SKOV3/DDP, and their parental A2780 and SKOV3 cells as well as human ovarian cancer tissues to identify: 1) roles of miRNA(s) in cisplatin-induced autophagy associated with the drug resistance; 2) functional target genes of the miRNA(s) that conveys drug resistance; 3) the relevant signaling pathway for regulating the process; and 4) the clinical implication of these findings.
Results
Cisplatin induces autophagic flux in cisplatin-resistant ovarian cancer cells
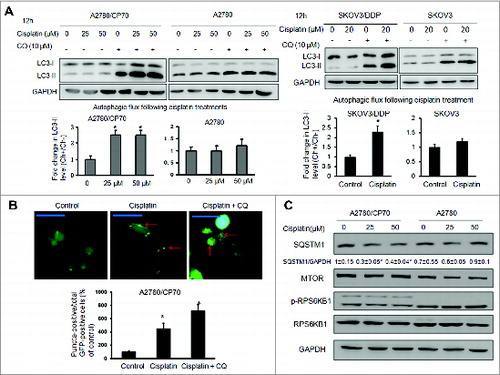
Detection of MAP1LC3/LC3 (microtubule-associated protein 1 light chain 3), a mammalian ortholog of yeast Atg8, is a common way to monitor autophagy. During autophagy induction, the nonlipidated form of LC3 (LC3-I) is conjugated with phosphatidylethanolamine (PE), then converted into the lipidated form of LC3 (LC3-II), which is associated with autophagosome biogenesis.Citation9 As LC3-II is rapidly degraded by lysosomal turnover during autophagy, we treated cells with cisplatin in the presence or absence of the lysosome inhibitor chloroquine (CQ). The autophagic flux can be reflected by the fold change in LC3-II levels with or without chloroquine.Citation10,11 We found that the fold change in LC3-II levels in cisplatin-resistant A2780/CP70 cells after lysosome inhibition via chloroquine was remarkably upregulated in response to cisplatin treatment, suggesting autophagy induction (). No significant change was observed in parental cisplatin-sensitive A2780 cells. We performed the same experiments in cisplatin-resistant SKOV3/DDP cells and their parental cisplatin-sensitive SKOV3 cells. The results were consistent with those from A2780/CP70 and A2780 cells. Next, we transiently transfected A2780/CP70 cells with a GFP-LC3 plasmid to monitor autophagosome formation through fluorescence microscopy, measured as an increase in puncta-positive cells. Consistent with LC3-II accumulation, the percentage of LC3 puncta-positive cells in GFP-positive cells significantly increased when treated with cisplatin in A2780/CP70 cells. The number of GFP-LC3 puncta-positive cells further increased in the presence of chloroquine (). In addition to LC3-II, the receptor SQSTM1 has also been used as a marker of autophagy induction. The SQSTM1 protein links LC3 and ubiquitinated substrates,Citation12 which are degraded during autophagic flux. As expected, SQSTM1 levels were decreased with cisplatin treatment in A2780/CP70 cells (). It is known that the MTOR complex is a negative regulator of autophagy.Citation13 No significant change was observed in MTOR activation, as reflected by the phosphorylation of RPS6KB1/p70S6K1, indicating that cisplatin-induced autophagy in cisplatin-resistant cells was MTOR-independent ().
Figure 1. Cisplatin induces autophagic flux in cisplatin-resistant cells. (A) Cells were treated with cisplatin at indicated doses for 12 h in the presence or absence of 10 μM chloroquine (CQ). Upper panels: LC3 protein levels were determined by western blotting. Lower panels: the autophagic flux was quantified by the fold change in LC3-II levels in the presence or absence of CQ. The experiments were performed in triplicate. * Indicates significant difference compared with control (P < 0.05). (B) A2780/CP70 cells were transfected with a GFP-LC3 plasmid for 48 h, followed by cisplatin (25 μM) and/or chloroquine (10 μM) treatments for 12 h. LC3 puncta was observed with fluorescence microscopy. Representative images captured by a fluorescence microscope are shown. Scale bar = 80 μm. Data were quantified as the percentage of puncta-positive cells in total GFP positive cells. (C) Cells were treated with cisplatin as described above. The protein levels of SQSTM1, MTOR, p-RPS6KB1, RPS6KB1 were determined by western blotting.
A MIR152 mimic sensitizes ovarian cancer cells to cisplatin-induced cell death
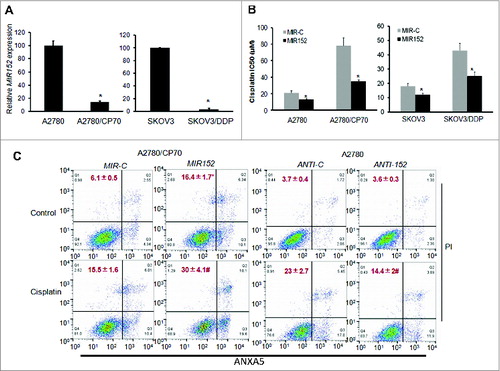
Recent studies suggest that miRNAs may regulate autophagic activity by directly targeting autophagy-related proteins or pathways.Citation8 We screened a number of miRNAs, which are differentially expressed in ovarian cancer tissues relative to normal tissues based on literature reviews (data not shown). We found MIR152 expression levels were dramatically repressed in cisplatin-resistant ovarian cancer cells with 6.5-fold lower expression in A2780/CP70 cells compared to A2780 and 33-fold lower expression in SKOV/DDP cells compared to SKOV3 (). To investigate whether the repression of MIR152 in A2780/CP70 and SKOV3/DDP cells is functional in cisplatin-induced resistance, we transfected the cells with a MIR152 mimic or a negative control MIR-C followed by cisplatin treatment, then performed a MTT assay. Transient MIR152 transfection efficiency was shown in Fig. S1. MIR152 overexpression significantly decreased the inhibitory concentration (IC50) of cisplatin in both cell lines (). We further investigated the role of MIR152 in cisplatin-induced cell death by a flow cytometry assay. Cisplatin-induced A2780/CP70 cell death was measured by ongoing apoptotic cells featured by ANXA5/annexin V-positive staining and propidium iodide (PI)-negative staining and necrotic cells, which were characterized by ANXA5 and PI double-positive staining. As shown in , overexpression of MIR152 alone in A2780/CP70 cells induced cell apoptosis compared with MIR-C cells, which further enhanced the number of apoptotic and secondary necrotic cells in response to cisplatin treatments. Inhibition of MIR152 in A2780 cells by transfection with oligo inhibitor anti-152 decreased cell apoptosis when treated with cisplatin. These results indicate that MIR152 is capable of sensitizing ovarian cancer cells to cisplatin treatment.
Figure 2. The MIR152 mimic sensitizes ovarian cancer cells to cisplatin-mediated cell death. (A) MIR152 expression levels in A2780/CP70, A2780, SKOV3 and SKOV3/DDP cells were determined by Taqman RT-PCR. (B) Cells were transfected with the MIR152 mimic or miR-control MIR-C for 48 h and reseeded into 96-well plates followed by cisplatin treatments at various concentrations for 72 h. Cell viability was measured by MTT assay. The IC50 of cisplatin in these cells was presented as mean ± SD. * Indicates significant difference compared with control (P < 0.05). (C) A2780/CP70 cells were transfected with the MIR152 mimic or control MIR-C for 48 h, followed by cisplatin treatments (50 μM, 12 h). A2780 cells were transfected with ANTI-152 or control ANTI-C for 48 h, followed by cisplatin (25 μM, 12 h) treatments. Cell death was measured by ANXA5 and PI staining. The number of apoptotic and secondary necrotic cells is shown as the sum of ANXA5-positive and ANXA5 and PI double-positive cells and is presented as mean ± SD from 3 independent experiments. * Indicates significant difference compared with MIR-C without cisplatin treatment (P<0.05). # Indicates significant difference compared with MIR152 without cisplatin treatment (P < 0.05).
Overexpression of MIR152 inhibits cisplatin-induced autophagy in A2780/CP70 cells
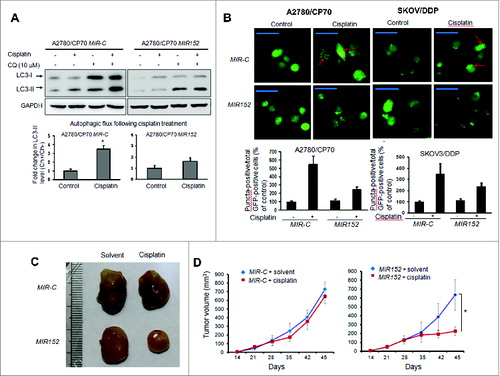
To investigate the functional role of MIR152 in cisplatin-induced autophagy, we established A2780/CP70 cells stably expressing MIR152 or MIR-C by transfection of lentiviral vectors carrying the MIR152 plasmid or the negative miR-control plasmid followed by puromycin selection (Fig. S2). Exposure of A2780/CP70 MIR-C cells to cisplatin increased autophagic flux reflected by 3.5-fold higher LC3-II levels. However, overexpression of MIR152 partly reversed cisplatin-mediated LC3-II accumulation (). As expected, A2780/CP70-MIR152 and SKOV3/DDP-MIR152 cells transfected with GFP-LC3 exhibited less puncta formation in response to cisplatin treatment compared with A2780/CP MIR-C cells (). We next assessed the potential action of MIR152 in drug sensitivity in vivo. We generated xenograft tumors by the injection of stable cells A2780/CP70-MIR152 and A2780/CP70-MIR-C subcutaneously in nude mice. Cisplatin treatments initiated on the third d of implantation were administered intraperitoneally 3 times a wk. Cisplatin reduced tumor volume by 60% in MIR152-overexpressing tumors on 45 d after implantation, but not in MIR-C-overexpressing tumors (). These results demonstrate that MIR152 is a negative regulator in cisplatin-induced autophagy in A2780/CP70 cells. Overexpression of MIR152 increases sensitivity of cancer cells to cisplatin treatment via autophagy inhibition.
Figure 3. Overexpression of MIR152 inhibits cisplatin-induced autophagy in A2780/CP70 cells. (A) A2780/CP70 cells stably expressing MIR152 or MIR-C were treated with cisplatin (25 μM, 12 h) in the presence or absence of chloroquine (CQ). LC3 protein levels were determined by western blotting. Data were quantified as described in Fig.1 A. (B) Upper left: A2780/CP70 cells stably expressing MIR152 or MIR-C were transfected with the GFP-LC3 plasmid for 48 h, and followed by cisplatin treatment (25 μM) for 12 h. Upper right: SKOV3/DDP cells were transiently transfected with the GFP-LC3 plasmid and MIR152/ MIR-C for 48 h and this was followed by cisplatin treatment (20 μM) for 12 h. Representative images captured with a fluorescence microscope are shown. Scale bar = 80 μm. Lower: The percentage of GFP-LC3 puncta-positive cells was quantified as described in Fig.1B. (C, D) A2780/CP70-MIR-C cells or A2780/CP70-MIR152 cells were injected in the flank of nude mice. Mice were treated 3 times a wk with control solvent (1% DMSO) or cisplatin (3 mg/kg, i.p.) initiated 3 d after the cell injection. Representative tumors are shown (C). Tumor volumes were measured and expressed as mean ± SEM (n = 8 to 10)(D). *P < 0.05.
ATG14 is a direct target of MIR152
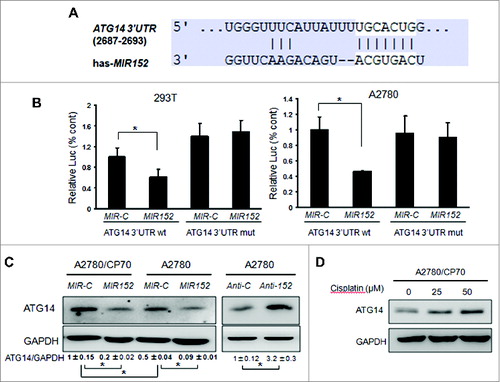
To reveal the mechanism of autophagy inhibition by MIR152, we searched autophagy-related genes using a bioinformatic database using Targetscan, and found that ATG14 is predicted to bind with 3’UTR regions of ATG14 mRNA. We constructed the 3’ UTR reporters of ATG14 containing the putative MIR152 binding sites and corresponding mutant constructs downstream of the luciferase reporters. Then we cotransfected 293T cells and A2780 cells with reporter constructs, the MIR152 mimic or MIR-C, and a β-gal plasmid, then performed the luciferase activity assay 48 h after transfection. As shown in , cotransfection of the MIR152 mimic with the wild-type reporter construct significantly decreased the luciferase activities in both cells, whereas cotransfection with a reporter containing point mutations at putative MIR152 binding sites did not affect the luciferase activities, an indication of direct interaction between MIR152 and ATG14 mRNA. Western blots showed that the basal levels of ATG14 in A2780/CP70 cells were higher than those in A2780 cells, and overexpression of MIR152 inhibited ATG14 protein levels in both cells. On the contrary, repression of MIR152 in A2780 cells increased ATG14 protein level (). In addition, ATG14 was induced with cisplatin treatments in a dose-dependent manner ().
Figure 4. MIR152 directly targets ATG14. (A) Sequence alignment of 3’UTR of ATG14 mRNA and human MIR152 with potential binding sites. (B) 293T cells and A2780 cells were cotransfected with ATG14 3’UTR wild-type or mutant luciferase reporter, MIR152 mimic or negative control MIR-C and β-gal plasmid for 48 h, then harvested for the luciferase activity assay. The luciferase activities were presented as relative luciferase activities normalized to those of the cells cotransfected with wild-type 3’UTR reporter and miR-control. *Indicates significant difference compared with control (P < 0.05). All tests were performed in triplicate and presented as mean ± SD. (C) A2780/CP70 cells and A2780 cells were transiently transfected with 25 μM MIR152 mimic or MIR-C for 72 h. A2780 cells were transiently transfected with 25 μM ANTI-152 or control ANTI-C for 72 h. ATG14 expression was determined by western blotting. (D) A2780/CP70 cells were treated with cisplatin at indicated doses for 12 h. ATG14 protein levels were determined by western blotting.
Knockdown of ATG14 inhibits basal autophagy and promotes cisplatin-induced cell death in ovarian cancer cells
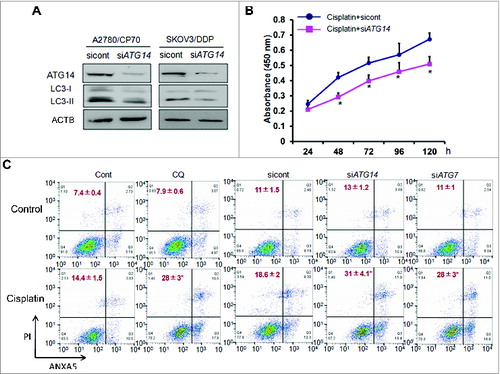
ATG14, a core component of the class III Ptdlns 3-kinase complex I, directs the complex to function in autophagy by targeting it to the site of autophagosome formation.Citation14 Studies suggest that ATG14 regulates autophagy in several cell types, Citation15 but its role in ovarian cancer remains unknown. We knocked down ATG14 in cisplatin-resistant cells using specific siRNAs. The basal levels of autophagy indicated by lower LC3-II expression levels were reduced in ATG14 knockdown cells (). Then we treated A2780/CP70 cells with cisplatin in ATG14 knockdown cells and control cells to assess cell proliferation. Compared to the control cells, ATG14 knockdown enhanced cisplatin-inhibited cell proliferation as shown in . Next, we performed a flow cytometry assay by ANXA5 and PI staining. To test the hypothesis that cisplatin resistance is due to autophagy protection, we treated cells with chloroquine to determine whether autophagy inhibition will enhance cisplatin-induced apoptosis. The percentage of apoptotic and necrotic cells treated with chloroquine was about 28% relative to 14% in control cells. Then we assessed the action of ATG14 on cisplatin resistance. ATG14 was silenced by siRNA in A2780/CP70 cells treated with cisplatin. Knockdown of ATG14 resulted in 31% cisplatin-induced apoptosis compared with 18% in scrambled siRNA control cells (). To further confirm the finding, we also tested the effect of ATG7 on cisplatin resistance. ATG7 is one of well-established autophagy related proteins, which is critical in autophagosomal biogenesis. It was reported that ATG7 deficiency promoted cisplatin-induced apoptotic death in human esophageal squamous cell carcinoma cells.Citation16 As expected, we observed an increased cisplatin-induced apoptosis and necrosis in ATG7 knockdown cells. These results indicate that ATG14 is capable of sensitizing cisplatin-resistant ovarian cancer cells to chemotherapy.
Figure 5. Knockdown of ATG14 inhibits basal autophagy and promotes cisplatin-induced inhibition of cell proliferation and cell death. (A) A2780/CP70 and SKOV3/DDP cells were transiently transfected with 50 nM siATG14 Smartpool or negative siRNA control for 72 h. ATG14 and LC3 expression levels were determined by western blotting. (B) A2780/CP70 cells were transfected with siATG14 Smartpool or negative siRNA control for 48 h, and reseeded into 96-well plates treated with 25 μM cisplatin for 72 h. MTT assay was performed at the indicated time points. * Indicates significant difference compared with siRNA control at the same time point. (C) A2780/CP70 cells were treated with cisplatin (25 μM) with or without chloroquine (CQ, 10 μM) for 12 h, or transfected with siATG14, siATG7, or siRNA control for 48 h, followed by cisplatin treatments (25 μM, 12 h). Cell apoptosis was measured by ANXA5 and PI staining. The number of apoptotic and secondary necrotic cells is shown as the sum of ANXA5-positive and ANXA5 and PI double-positive cells and is presented as mean ± SD from 3 independent experiments. * Indicates significant difference compared with control or sicont (P < 0.05).
Downregulation of EGR1 mediates cisplatin-resistance through MIR152, at the transcriptional level
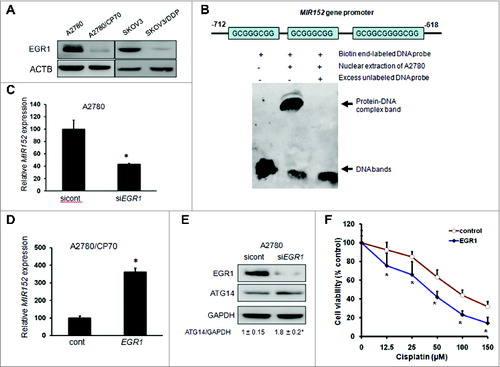
The transcription factor EGR1 promotes cell apoptosis under stress by regulating its downstream effectors including TP53/p53 (TRP53 in mice), TNF/TNF-α, RB1/Rb, and BAX.Citation17 Western blotting results showed that both A2780/CP70 and SKOV3/DDP cells exhibited very low levels of EGR1 protein expression compared with their parental control (). Interestingly, we found that the MIR152 gene promoter harbored candidate EGR1 DNA-binding consensus target sequences. To validate the direct interaction between EGR1 and the MIR152 gene, we performed an EMSA assay. Incubation of the biotin-labeled DNA probe containing putative binding sites with nuclear protein fractions resulted in gel shift, which was completely inhibited by an excess of unlabeled DNA probe (). To further confirm that MIR152 is a transcriptional target of EGR1, we silenced EGR1 using specific EGR1 siRNA in A2780 cells, or overexpressed EGR1 in A2780/CP70 cells. As a result, MIR152 expression levels were about 2.5-fold lower in EGR1 knockdown cells, whereas 3.5-fold higher in EGR1-overexpressing cells (). EGR1 expression levels were also inversely correlated with ATG14 expression levels as genetic inhibition of EGR1 by siRNA caused the increase of ATG14 protein level (). To determine the role of EGR1 in cisplatin-resistance, we overexpressed EGR1 in A2780/CP70 cells, and then treated them with cisplatin, followed by a MTT assay. EGR1 overexpression significantly enhanced cisplatin-inhibited cell proliferation in cisplatin-resistant cells (). Taken together, EGR1 is an upstream regulator of the MIR152-ATG14 pathway, and is functional in cisplatin-resistance.
Figure 6. Downregulation of EGR1 mediates cisplatin-resistance through MIR152 at the transcriptional level. (A) EGR1 protein levels were determined by western blotting in cells. (B) Upper: sequence alignment of the MIR152 gene promoter containing EGR1 consensus DNA-binding sites. Lower: The biotin end-labeled MIR152 promoter DNA fragment was incubated with or without A2780 nuclear extraction and an excess (100-fold) unlabeled DNA fragment. The EMSA assay was performed as described in Materials and Methods. (C) A2780 cells were transiently transfected with a siEGR1 Smartpool or a negative siRNA control for 72 h. MIR152 expression was determined by Taqman RT-PCR. (D) A2780/CP70 cells were transiently transfected with an EGR1 plasmid for 72 h. MIR152 expression was determined by Taqman RT-PCR. Data are presented as mean ± SD. * Indicates significant difference compared with control (P < 0.05). (E) A2780 cells were transiently transfected with a siEGR1 Smartpool or a negative siRNA control for 72 h. EGR1 and ATG14 expression levels were determined by western blotting. (F) A2780/CP70 cells were transfected with the EGR1 plasmid for 48 h, and reseeded into 96-well plates followed by cisplatin treatments at various concentrations for 72 h. Cell viability was measured by MTT assay. *Indicates significant difference compared with control at the same time point (P < 0.05).
Lower levels of EGR1 and MIR152 in ovarian tumors are associated with cisplatin-resistance
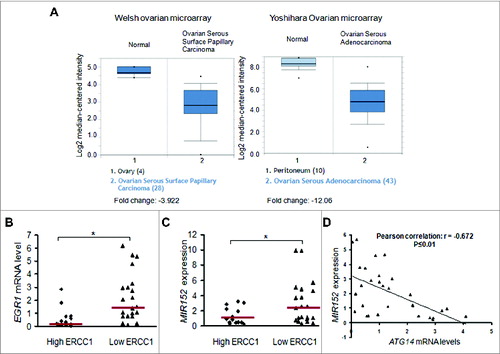
To explore the clinical relevance of the above findings, we first searched the publicly available microarray database Oncomine to analyze EGR1 expression in ovarian cancer tissues and normal ovarian tissues. Two individual microarray datasets showed a statistical decrease of EGR1 expression in ovarian cancers compared with normal ovarian tissues (). The Welsh ovarian microarray reports a 4-fold lower EGR1 expression in ovarian carcinoma, whereas the Yoshihara ovarian microarray revealed a 12-fold reduction.Citation18,19 ERCC1 is closely related with DNA repair and platinum resistance and is widely accepted as a biomarker for platinum resistance.Citation20 High ERCC1 expression represents strong DNA repair capacity, and thus leads to drug resistance and vice versa. To explore the clinical implication of the proposed pathway, we utilized human ovarian tumors with ERCC1 scores defined by RT-PCR as described in the previous publication ().Citation21 We analyzed EGR1 mRNA levels and MIR152 expression levels using quantitative real-time PCR, and found that both EGR1 and MIR152 expression levels were significantly higher in low ERCC1 tumors compared with high ERCC1 tumors, suggesting that EGR1 and MIR152 expression levels are positively correlated with potential cisplatin-sensitive tumors (). ATG14 expression levels were inversely correlated with MIR152 expression levels in ovarian tumors (). These results suggest that the EGR1/MIR152 pathway is associated with potential cisplatin-resistant ovarian cancer samples, thus validating the clinical relevance of our in vitro findings.
Table 1. Patient characteristics.
Figure 7. Lower levels of EGR1 and MIR152 in ovarian tumors are associated with cisplatin-resistance. (A) EGR1 expression levels in normal ovarian tissues vs. ovarian cancer tissues in 2 individual microarrays were shown using the Oncomine gene expression tool. (B) EGR1 mRNA levels were determined by SYBR-Green RT-PCR in 14 high ERCC1 ovarian tumors (ERCC1 score ≥ 1) and 21 low ERCC1 ovarian tumors (ERCC score < 1). Bars are indicated as median of the group. (C) MIR152 expression levels were determined by Taqman RT-PCR in 14 high ERCC1 ovarian cancer tissues and 21 low ERCC1 ovarian cancer tissues. Bars are indicated as the median of the group. *Indicates significant difference (P < 0.05). (D) ATG14 mRNA levels were determined by SYBR-Green RT-PCR in 30 ovarian tumors. Correlation analysis between MIR152 and ATG14 levels in human ovarian cancer tissues was performed.
Discussion
The cytotoxic-based platinum compound cisplatin has been commonly used in ovarian cancer treatment for almost three decades, as it induces apoptosis in cancer cells as a result of lethal DNA damage.Citation22 But the intrinsic and acquired resistance to cisplatin in cancer cells remains a big challenge for overall survival. Multiple mechanisms contribute to cisplatin resistance such as a defective DNA repair system, enhanced drug clearance and detoxification, epigenetic regulation, and abnormal signaling pathways.Citation23,24 A growing body of evidence indicates a role of autophagy as a prosurvival and resistance mechanism against chemotherapy. With regards to cisplatin, recent studies demonstrated that cisplatin can induce autophagy in ovarian cancer cells through the ubiquitin-binding protein SQSTM1 or HMGB1 (high mobility group box 1).Citation25,26 Here, we describe a new mechanism in which downregulation of ATG14 by EGR1-MIR152 mediates cisplatin-induced autophagy in cisplatin-resistant ovarian cancer cells.
MTOR is a negative regulator of the autophagy process Citation1,27 and the combinational use of MTOR inhibitors with cisplatin is able to sensitize cancer cells to chemotherapy.Citation28,29 We found that cisplatin treatment by itself couldn't significantly affect MTOR expression and activation in A2780/CP70 cells, an indication of an MTOR-independent modulation of autophagy. Epigenetic regulation of autophagy involves DNA methylation and histone acetylation.Citation1 Recently, miRNAs have been reported to act as important epigenetic modulators of autophagy in cancer cells by regulating key autophagy-related proteins.Citation8 In this study, we report MIR152 as a new autophagy regulating miRNA, as a result of targeting ATG14. Ectopic expression of MIR152 in cancer cells enhances cisplatin-induced apoptosis and inhibits cisplatin-induced autophagy. We and others have shown that MIR152 acts as a tumor suppressor in breast cancer, ovarian cancer, and other cancers by targeting IGF1R, IRS1, and CSF1 (colony stimulating factor 1 [macrophage]) and so on.Citation30,31 Overexpression of MIR152 can inhibit cancer cell proliferation, migration, and induce cellular senescence.Citation32,33 In this study, we observed that MIR152 alone can induce cell apoptosis. We speculate that MIR152, in addition to be involved in cisplatin-induced autophagy, may directly regulate certain known or unidentified targets, which can regulate apoptotic induction. Further investigation is needed to understand the mechanism underlying MIR152-induced apoptosis in the future. Given the multiple roles involved in cancer cell inhibition and chemosensitivity, MIR152 should be a very promising therapeutic approach for overcoming cisplatin resistance in ovarian cancer.
ATG14 functions in two aspects during autophagy initiation. One is to form the class III Ptdlns3K complex I as a key component, which is essential for phagophore nucleation; the other is to direct complex I to function in autophagy by targeting it to the phagophore assembly site.Citation14 ATG14 is required for both basal and inducible autophagy. A recent study reveals a new function in which an autophagy-dependent phosphorylation of BECN1/Beclin 1 at serines 90 and 93 is controlled by the binding partner ATG14, and is required for full autophagic activity.Citation34 Our results also showed that knockdown of ATG14 reduced basal autophagy in both cisplatin-resistant ovarian cancer cell lines. It is reported ATG14 can be transcriptional regulated by FOXO (forkhead box O) transcription factors and has a role in hepatic autophagy and lipid metabolism.Citation35 However, its role in cancer and potential regulatory mechanisms are not known yet. Here we demonstrated ATG14 regulates cisplatin-induced autophagy and subsequent drug resistance in ovarian cancer cells, which is regulated by upstream molecules EGR1 and MIR152. Genetic inhibition of ATG14 by siRNA resulted in increased cisplatin-mediated cell proliferation inhibition and cell death in cisplatin-resistant cells.
We further explored the upstream regulation of the MIR152-ATG14 pathway underlying cisplatin resistance in ovarian cancer. The role of EGR1 protein in cancers can be cancer-type specific. It is considered as a tumor suppressor in lung cancer, gliomas, and hepatocellular and esophageal carcinomas; whereas also as a tumor enhancer in prostate cancer. Citation36–39 We explored the Oncomine database and found lower expression levels of EGR1 in human ovarian cancer tissues compared with normal ovarian tissues according to results from independent tissue microarrays, suggesting that EGR1 could be a tumor suppressor in ovarian cancer. EGR1 is a strong transcription activator of its target genes including TNF, TP53, RB1, and BAX that are involved in the cell death pathway upon radiation or chemotherapy.Citation17 A study utilizing mouse embryonic fibroblasts with various genomic status for the EGR1 gene shows that cells with deletion of both EGR1 alleles are significantly resistant to radiation-induced apoptosis compared with cells with intact EGR1 alleles.Citation40 In this study, we identified the MIR152 gene as a new EGR1 downstream target. Loss of EGR1 protein in drug resistant cells A2780/CP70 and SKOV3/DDP contributes to the low expression levels of MIR152 in both cells. Overexpression of the EGR1 protein increased efficacy of chemotherapy in A2780/CP70 cells at least partly through MIR152 and ATG14. ERCC1 expression levels are inversely correlated with the response of cancers to platinum-based chemotherapy and have been widely recognized as a biomarker for potential chemoresistance in ovarian cancer.Citation21,41,42 EGR1 and MIR152 expression levels in ovarian cancer tissues were inversely correlated with ERCC1 expression, which further confirmed their roles in chemoresistance. It is noted that the direct relationship between EGR1 and MIR152 expression, and chemosensitivity should be investigated when more relevant clinical data become available in the future.
Anti-autophagy strategies have been initiated in clinical trials that aim to overcome the development of resistance to radiation or chemotherapy treatments. Chloroquine, a commonly used autophagy inhibitor, has been used as a sensitizer in cancer therapies.Citation43 However, a controversy exists in terms of chloroquine efficacy.Citation44 One explanation is that normal cells also use autophagy to maintain homeostasis, and inhibition of autophagy by chloroquine would also sensitize healthy organs such as kidneys to chemotherapy resulting in severe side effects.Citation45 Given that basal levels of EGR1 and MIR152 are relatively high in normal cells, activation of the EGR1-MIR152 pathway may not affect signaling of normal cells, but will greatly increase the therapeutic response in cancer cells. Collectively, our data provide insights into novel mechanisms for acquired cisplatin-resistance. Activation of EGR1 and MIR152 may be a useful strategy to overcome ovarian cancer cell resistance by preventing cyto-protective autophagy.
Materials and Methods
Cell culture, establishment of stable cells, reagents, and antibodies
Ovarian cancer cells A2780 and cisplatin-resistant A2780/CP70 cells were cultured in RPMI-1640 medium (Invitrogen, MT10040CV) supplemented with 10% fetal bovine serum. SKOV3/DDP cells were purchased from Shanghai Kenqiang Equipment Co., Ltd (ZY1088). Stable cell lines of A2780/CP70 overexpressing MIR152 or MIR-C were generated by the infection of lentivirus carrying MIR152 or a negative control precursor (Open Biosystems, HMR5147) followed by puromycin (Life Technologies, A113803) selection. Cisplatin and chloroquine were purchased from Sigma Aldrich (Z730645, C6628). Antibodies against EGR1, LC-3, ATG14, and SQSTM1 were obtained from Cell Signaling Technology (4153S, 4108, 5504, 5114S).
Clinical material
Frozen GOG (Gynecologic Oncology Group) ovarian cancer samples were obtained from the Cooperative Human Tissue Network (CHTN), Pediatric Division of Children's Hospital, Columbus, OH, USA. All samples were collected in a HIPAA-compliant way. The tumor specimens were collected at primary surgery, freshly frozen in liquid nitrogen, and stored at -80°C until RNA extraction. The procedures are in accordance with Helsinki Declaration of 1975.
miRNA transfection and RNA interference
The negative control miRNA and MIR152 mimics were from Applied Biosystem (AM17100). Cells were cultured in 6-well plates to reach 60% confluency, and transfected with 25 nM MIR152 mimic or miR-control using Lipofectamine RNAiMAX reagent (Invitrogen, 13778–150) according to the manufacturer's instruction. Total proteins and RNAs were prepared from the cells 60 to 72 h after the transfection, and were used for subsequent analysis. Nontargeting siRNAs pool control (sicont), siRNA Smartpools against EGR1 and ATG14 were purchased from Dharmacon (D-001810, L-006526, L-020438). Cells were cultured in 6-well plates to reach 60% confluency and transfected with 50 nM specific siRNAs or control siRNA using X-tremeGENE reagent (Roche, 04476093) according to the instructions.
Reporter constructs and luciferase activity assay
The 3′UTR-ATG14 luciferase reporter constructs containing the wild-type and mutant binding sites of MIR152 were amplified using PCR method. The PCR products were cloned into the pMiR-Report luciferase vector (Ambion, AM5795), immediately downstream of the luciferase gene. The mutant 3’UTR constructs were made by introducing 4 mismatch mutations into the putative seed regions of ATG14. All the constructs containing 3’UTR inserts were sequenced and verified. Cells cotransfected with reporter constructs, the miRNA mimic and the β-gal plasmid were harvested 48 h after transfection and lysed with reporter lysis buffer (Promega, E397A). The luciferase activities in the cellular extracts were determined using the luciferase assay system (Promega, E1501). The β-gal activities were measured with assay buffer at absorbance 405 nm. The relative luciferase activities were calculated by the ratio of luc/β-gal activity, and normalized to that of the control.
RNA extraction and real-time quantitative PCR
Total RNAs were extracted using TRIzol (Invitrogen, 15596–018). The cDNA synthesis was performed using oligo(dT)18 primers and M-MLV reverse transcriptase (Promega, 29473101). SYBR-Green RT-PCR was performed to detect EGR1, ATG14 and GAPDH mRNA levels using Power SYBR Green PCR Master Mix Kit (Applied Biosystems, 4309155). Quantitative real-time PCR primers for EGR1 and ATG14 were purchased from (Origene, HP205725, HP211256). Taqman RT-PCR was performed to detect miRNA expression levels using the Taqman miRNA reverse transcription kit (Applied Biosystem, 4366597) and the Taqman universal PCR master mix (Applied Biosystem, 4440038).
Flow cytometry analysis
Cells were transfected with the miRNA mimics or specific siRNAs followed by cisplatin treatment as indicated. ANXA5 and PI double-staining was performed using the Alexa Fluor 488 Annexin V Dead Cell Apoptosis Kit (Life technology, V13241) according to the manusfacturer's instruction. The cells were analyzed by flow cytometry (BD Bioscience, FACSCalibur, Singapore), measuring the fluorescence emission at 530 nm and 585 nm using 488 nm excitation. Data were analyzed using FlowJo software.
GFP-LC3 analysis
Cells were transiently transfected with a GFP-LC3 plasmid (Cell Biolabs, LTV-801) for 48 h. Then cells were treated with cisplatin for 12 h, fixed in ice-cold methanol for 10 min, mounted with coverslips using Prolong Gold antifade reagent (Invitrogen, P36935), and stored at -20 °C until the use. Images were captured using a fluorescence microscope (Olympus, I×71, Center Valley, PA, US). A total of 50 GFP-positive cells were counted and cells with more than 5 puncta were considered as GFP-LC3 puncta-positive cells.
EMSA assay
A2780 cellular nuclear extracts was prepared using a nuclear extraction kit (Cayman, 10009277). MIR152 DNA fragments (probe) in the promoter region containing EGR1 DNA-binding consensus sequences were amplified by PCR and followed by gel purification. Then the probe was labeled using a Biotin 3’end DNA labeling kit (Thermo Scientific, 89818). Binding reactions were performed using a Lightshift EMSA Optimization and Control kit (Thermo Scientific, 20148X) according to the instruction of the manufacturer. Blots were detected using Chemiluminescent Nucleic Acid Detection Module (Thermo Scientific, 89880) and visualized with an ImageQuant LAS 4000 imaging system (GE Healthcare, Tokyo, Japan). Primers for the MIR152 probe are shown as follows:
Forward: 5′- GGGCCCCGAGGAAAGGGAG - 3′;
Reverse: 5′- CCGCCTCGCACTGACAGCG - 3′.
Tumor xenograft assay
Female CrTac: NCr-Foxn1nu mice (6-wk-old) were purchased from Taconic (Hudson, NY, USA), and maintained in pathogen-free conditions. A total 2 × 10⁶ A2780/CP70-MIR-C cells or A2780/CP70-MIR152 cells (A2780/CP70 cells stably overexpressing MIR-C or MIR152) in 80 μl were injected subcutaneously into the flank of nude mice (n = 10/group). Cisplatin was administered intraperitoneally at 3 mg/kg 3 times a wk 3 d after the cell injection into the mice. DMSO was given as a solvent in control mice. Tumor volumes were measured with calipers (volume = a × b2 × 0.52, where a is the widest width and b is the perpendicular length) once every 3 d. Mice were euthanized 45 d post-injection. Animals used in research have been treated humanely according to Institutional Animal Care and Use Committee, Thomas Jefferson University.
Statistical Analysis
Data are presented as mean ± SD from 3 independent experiments and analyzed by a 2-tailed Student t test and/or Pearson Correlation using SPSS 11.5 for Windows. Differences were considered significant at a value of P ≤ 0.05.
Disclosure of Potential Conflicts of Interest
No potential conflicts of interest were disclosed.
Supplemental Material
Supplemental data for this article can be accessed on the publisher's website.
SupplemetaryMaterial.zip
Download Zip (1.5 MB)Acknowledgments
We thank Dr. Dong-Ying Chen (Thomas Jefferson University) for his technical support on fluorescence imaging.
Funding
This study was supported in part by Natural Science Foundation of China (81320108019, 81270736, 81472944, 81071642), and by National Institutes of Health grants R01ES020868 and R21CA175975–01.
References
- Peracchio C, Alabiso O, Valente G, Isidoro C. Involvement of autophagy in ovarian cancer: a working hypothesis. J Ovarian Res 2012; 5:22; PMID:22974323; http://dx.doi.org/10.1186/1757-2215-5-22
- Bookman MA. First-line chemotherapy in epithelial ovarian cancer. Clin Obstet Gynecol 2012; 55:96-113; PMID:22343232; http://dx.doi.org/10.1097/GRF.0b013e31824b45da
- Galluzzi L, Senovilla L, Vitale I, Michels J, Martins I, Kepp O, Castedo M, Kroemer G. Molecular mechanisms of cisplatin resistance. Oncogene 2012; 31:1869-83; PMID:21892204; http://dx.doi.org/10.1038/onc.2011.384
- Mathew R, Karantza-Wadsworth V, White E. Role of autophagy in cancer. Nat Rev Cancer 2007; 7:961-7; PMID:17972889; http://dx.doi.org/10.1038/nrc2254
- Hu YL, Jahangiri A, Delay M, Aghi MK. Tumor cell autophagy as an adaptive response mediating resistance to treatments such as antiangiogenic therapy. Cancer Res 2012; 72:4294-9; PMID:22915758; http://dx.doi.org/10.1158/0008-5472.CAN-12-1076
- Ventura A, Jacks T. MicroRNAs and cancer: short RNAs go a long way. Cell 2009 136: 586-91; PMID:19239879; http://dx.doi.org/10.1016/j.cell.2009.02.005
- Hanahan D, Weinberg RA. The hallmarks of cancer. Cell 2000; 100:57-70; PMID:10647931; http://dx.doi.org/10.1016/S0092-8674(00)81683-9
- Zhai H, Fesler A, Ju J. MicroRNA: a third dimension in autophagy. Cell Cycle 2013 12:246-50; PMID:23255136; http://dx.doi.org/10.4161/cc.23273
- Kirisako T, Ichimura Y, Okada H, Kabeya Y, Mizushima N, Yoshimori T, Ohsumi M, Takao T, Noda T, Ohsumi Y. The reversible modification regulates the membrane-binding state of Apg8/Aut7 essential for autophagy and the cytoplasm to vacuole targeting pathway. J Cell Biol 2000; 151:263-76; PMID:11038174; http://dx.doi.org/10.1083/jcb.151.2.263
- Mizushima N, Yoshimori T, Levine B. Methods in mammalian autophagy research. Cell 2010; 140:313-26; PMID:20144757; http://dx.doi.org/10.1016/j.cell.2010.01.028
- Stanton MJ, Dutta S, Zhang H, Polavaram NS, Leontovich AA, Honscheid P, Sinicrope FA, Tindall DJ, Muders MH, Datta K. Autophagy control by the VEGF-C/NRP-2 axis in cancer and its implication for treatment resistance. Cancer Res 2013; 73:160-71; PMID:23149913; http://dx.doi.org/10.1158/0008-5472.CAN-11-3635
- Bjorkoy G, Lamark T, Brech A, Outzen H, Perander M, Overvatn A, Stenmark H, Johansen T. p62/SQSTM1 forms protein aggregates degraded by autophagy and has a protective effect on huntingtin-induced cell death. J Cell Biol 2005; 171:603-14; PMID:16286508; http://dx.doi.org/10.1083/jcb.200507002
- Jung CH, Ro SH, Cao J, Otto NM, Kim DH. mTOR regulation of autophagy. FEBS Lett 2010; 584:1287-95; PMID:20083114; http://dx.doi.org/10.1016/j.febslet.2010.01.017
- Obara K, Ohsumi Y. Atg14: a key player in orchestrating autophagy. Int J Cell Biol 2011; 2011:713435; PMID:22013444; http://dx.doi.org/10.1155/2011/713435
- Fan W, Nassiri A, Zhong Q. Autophagosome targeting and membrane curvature sensing by Barkor/Atg14(L). Proc Natl Acad Sci U S A 2011; 108:7769-74; PMID:21518905; http://dx.doi.org/10.1073/pnas.1016472108
- Zhu L, Du H, Shi M, Chen Z, Hang J. ATG7 deficiency promote apoptotic death induced by cisplatin in human esophageal squamous cell carcinoma cells. Bull Cancer 2013; 100:15-21; PMID:23823853; http://dx.doi.org/10.1684/bdc.2013.1749
- Ahmed MM. Regulation of radiation-induced apoptosis by early growth response-1 gene in solid tumors. Curr Cancer Drug Targets 2004; 4:43-52; PMID:14965266; http://dx.doi.org/10.2174/1568009043481704
- Welsh JB, Zarrinkar PP, Sapinoso LM, Kern SG, Behling CA, Monk BJ, Lockhart DJ, Burger RA, Hampton GM. Analysis of gene expression profiles in normal and neoplastic ovarian tissue samples identifies candidate molecular markers of epithelial ovarian cancer. Proc Natl Acad Sci U S A 2001; 98:1176-81; PMID:11158614; http://dx.doi.org/10.1073/pnas.98.3.1176
- Yoshihara K, Tajima A, Komata D, Yamamoto T, Kodama S, Fujiwara H, Suzuki M, Onishi Y, Hatae M, Sueyoshi K., et al. Gene expression profiling of advanced-stage serous ovarian cancers distinguishes novel subclasses and implicates ZEB2 in tumor progression and prognosis. Cancer Sci 2009; 100:1421-8; PMID:19486012; http://dx.doi.org/10.1111/j.1349-7006.2009.01204.x
- Yan BX, Ma JX, Zhang J, Guo Y, Riedel H, Mueller MD, Remick SC, Yu JJ. PSP94 contributes to chemoresistance and its peptide derivative PCK3145 represses tumor growth in ovarian cancer. Oncogene 2014; 33:5288-94; PMID:24186202; http://dx.doi.org/10.1038/onc.2013.466
- Reed E, Yu JJ, Davies A, Gannon J, Armentrout SL. Clear cell tumors have higher mRNA levels of ERCC1 and XPB than other histological types of epithelial ovarian cancer. Clin Cancer Res 2003 9:5299-305; PMID:14614013
- Muggia F Platinum compounds 30 years after the introduction of cisplatin: implications for the treatment of ovarian cancer. Gynecol Oncol 2009 112:275-81; PMID:18977023; http://dx.doi.org/10.1016/j.ygyno.2008.09.034
- Xiang Y, Ma N, Wang D, Zhang Y, Zhou J, Wu G, Zhao R, Huang H, Wang X, Qiao Y., et al. MiR-152 and miR-185 co-contribute to ovarian cancer cells cisplatin sensitivity by targeting DNMT1 directly: a novel epigenetic therapy independent of decitabine. Oncogene 2014; 33:378-86; PMID:23318422; http://dx.doi.org/10.1038/onc.2012.575
- Ali AY, Farrand L, Kim JY, Byun S, Suh JY, Lee HJ, Tsang BK Molecular determinants of ovarian cancer chemoresistance: new insights into an old conundrum. Ann N Y Acad Sci 2012; 1271:58-67; PMID:23050965; http://dx.doi.org/10.1111/j.1749-6632.2012.06734.x
- Yu H, Su J, Xu Y, Kang J, Li H, Zhang L, Yi H, Xiang X, Liu F, Sun L p62/SQSTM1 involved in cisplatin resistance in human ovarian cancer cells by clearing ubiquitinated proteins. Eur J Cancer 2011; 47:1585-94; PMID:21371883; http://dx.doi.org/10.1016/j.ejca.2011.01.019
- Zhang Y, Cheng Y, Ren X, Zhang L, Yap KL, Wu H, Patel R, Liu D, Qin ZH, Shih IM., et al. NAC1 modulates sensitivity of ovarian cancer cells to cisplatin by altering the HMGB1-mediated autophagic response. Oncogene 2012; 31:1055-64; PMID:21743489; http://dx.doi.org/10.1038/onc.2011.290
- Alexander A, Cai SL, Kim J, Nanez A, Sahin M, MacLean KH, Inoki K, Guan KL, Shen J, Person MD., et al. ATM signals to TSC2 in the cytoplasm to regulate mTORC1 in response to ROS. Proc Natl Acad Sci U S A 2010; 107:4153-8; PMID:20160076; http://dx.doi.org/10.1073/pnas.0913860107
- Gaur S, Chen L, Yang L, Wu X, Un F, Yen Y. Inhibitors of mTOR overcome drug resistance from topoisomerase II inhibitors in solid tumors. Cancer Lett 2011; 311:20-8; PMID:21764510; http://dx.doi.org/10.1016/j.canlet.2011.06.005
- Santiskulvong C, Konecny GE, Fekete M, Chen KY, Karam A, Mulholland D, Eng C, Wu H, Song M, Dorigo O. Dual targeting of phosphoinositide 3-kinase and mammalian target of rapamycin using NVP-BEZ235 as a novel therapeutic approach in human ovarian carcinoma. Clin Cancer Res 2011; 17:2373-84; PMID:21372221; http://dx.doi.org/10.1158/1078-0432.CCR-10-2289
- Woo HH, Laszlo CF, Greco S, Chambers SK. Regulation of colony stimulating factor-1 expression and ovarian cancer cell behavior in vitro by miR-128 and miR-152. Mol Cancer 2012; 11:58; PMID:22909061; http://dx.doi.org/10.1186/1476-4598-11-58
- Xu Q, Jiang Y, Yin Y, Li Q, He J, Jing Y, Qi YT, Xu Q, Li W, Lu B., et al. A regulatory circuit of miR-148a/152 and DNMT1 in modulating cell transformation and tumor angiogenesis through IGF-IR and IRS1. J Mol Cell Biol 2013; 5:3-13; PMID:22935141; http://dx.doi.org/10.1093/jmcb/mjs049
- Mancini M, Saintigny G, Mahe C, Annicchiarico-Petruzzelli M, Melino G, Candi E. MicroRNA-152 and -181a participate in human dermal fibroblasts senescence acting on cell adhesion and remodeling of the extra-cellular matrix. Aging (Albany NY) 2012; 4:843-53; PMID:23238588
- Wu Y, Huang A, Li T, Su X, Ding H, Li H, Qin X, Hou L, Zhao Q, Ge X., et al. MiR-152 reduces human umbilical vein endothelial cell proliferation and migration by targeting ADAM17. FEBS Lett 2014; 588:2063-9; PMID:24813629; http://dx.doi.org/10.1016/j.febslet.2014.04.037
- Fogel AI, Dlouhy BJ, Wang C, Ryu SW, Neutzner A, Hasson SA, Sideris DP, Abeliovich H, Youle RJ. Role of membrane association and Atg14-dependent phosphorylation in beclin-1-mediated autophagy. Mol Cell Biol 2013; 33:3675-88; PMID:23878393; http://dx.doi.org/10.1128/MCB.00079-13
- Xiong X, Tao R, DePinho RA, Dong XC. The autophagy-related gene 14 (Atg14) is regulated by forkhead box O transcription factors and circadian rhythms and plays a critical role in hepatic autophagy and lipid metabolism. J Biol Chem 2012; 287:39107-14; PMID:22992773; http://dx.doi.org/10.1074/jbc.M112.412569
- Calogero A, Arcella A, De GG, Porcellini A, Mercola D, Liu C, Lombari V, Zani M, Giannini G, Gagliardi FM., et al. The early growth response gene EGR-1 behaves as a suppressor gene that is down-regulated independent of ARF/Mdm2 but not p53 alterations in fresh human gliomas. Clin Cancer Res 2001; 7:2788-96; PMID:11555594
- McDoniels-Silvers AL, Nimri CF, Stoner GD, Lubet RA, You M. Differential gene expression in human lung adenocarcinomas and squamous cell carcinomas. Clin Cancer Res 2002; 8:1127-38; PMID:11948124
- Gitenay D, Baron VT. Is EGR1 a potential target for prostate cancer therapy? Future Oncol 2009 5:993-1003; PMID:19792968; http://dx.doi.org/10.2217/fon.09.67
- Wu MY, Liang YR, Wu XY, Zhuang CX. Relationship between Egr-1 gene expression and apoptosis in esophageal carcinoma and precancerous lesions. World J Gastroenterol 2002; 8:971-5; PMID:12439908
- Das A, Chendil D, Dey S, Mohiuddin M, Mohiuddin M, Milbrandt J, Rangnekar VM, Ahmed MM. Ionizing radiation down-regulates p53 protein in primary Egr-1-/- mouse embryonic fibroblast cells causing enhanced resistance to apoptosis. J Biol Chem 2001; 276:3279-86; PMID:11035041; http://dx.doi.org/10.1074/jbc.M008454200
- Deloia JA, Bhagwat NR, Darcy KM, Strange M, Tian C, Nuttall K, Krivak TC, Niedernhofer LJ. Comparison of ERCC1/XPF genetic variation, mRNA and protein levels in women with advanced stage ovarian cancer treated with intraperitoneal platinum. Gynecol Oncol 2012; 126:448-54; PMID:22609620; http://dx.doi.org/10.1016/j.ygyno.2012.05.006
- Weberpals J, Garbuio K, O'Brien A, Clark-Knowles K, Doucette S, Antoniouk O, Goss G, Dimitroulakos J. The DNA repair proteins BRCA1 and ERCC1 as predictive markers in sporadic ovarian cancer. Int J Cancer 2009; 124:806-15; PMID:19035454; http://dx.doi.org/10.1002/ijc.23987
- Solomon VR, Lee H. Chloroquine and its analogs: a new promise of an old drug for effective and safe cancer therapies. Eur J Pharmacol 2009; 625:220-33; PMID:19836374; http://dx.doi.org/10.1016/j.ejphar.2009.06.063
- Bristol ML, Emery SM, Maycotte P, Thorburn A, Chakradeo S, Gewirtz DA. Autophagy inhibition for chemosensitization and radiosensitization in cancer: do the preclinical data support this therapeutic strategy? J Pharmacol Exp Ther 2013; 344:544-52; PMID:23291713; http://dx.doi.org/10.1124/jpet.112.199802
- Kimura T, Takabatake Y, Takahashi A, Isaka Y. Chloroquine in cancer therapy: a double-edged sword of autophagy. Cancer Res 2013; 73:3-7; PMID:23288916; http://dx.doi.org/10.1158/0008-5472.CAN-12-2464