
Abstract
Phagophore nucleates from a subdomain of the endoplasmic reticulum (ER) termed the omegasome and also makes contact with other organelles such as mitochondria, Golgi complex, plasma membrane and recycling endosomes during its formation. We have used serial block face scanning electron microscopy (SB-EM) and electron tomography (ET) to image phagophore biogenesis in 3 dimensions and to determine the relationship between the phagophore and surrounding organelles at high resolution. ET was performed to confirm whether membrane contact sites (MCSs) are evident between the phagophore and those surrounding organelles. In addition to the known contacts with the ER, we identified MCSs between the phagophore and membranes from putative ER exit sites, late endosomes or lysosomes, the Golgi complex and mitochondria. We also show that one phagophore can have simultaneous MCSs with more than one organelle. Future membrane flux experiments are needed to determine whether membrane contacts also signify lipid translocation.
Abbreviations:
- 3D, 3 dimensional
- ATG, autophagy-related
- BSA, bovine serum albumin
- COPII, coat protein II
- ER, endoplasmic reticulum
- ET, electron tomography
- GOLGA2/GM130, golgin A2
- immunoEM, immuno electron microscopy
- LAMP1, lysosomal-associated membrane protein 1
- MAP1LC3/LC3, microtubule-associated protein 1 light chain 3
- MCS, membrane contact site
- PBS, phosphate-buffered saline
- SB-EM, serial block-face scanning electron microscopy
- SEC31A, SEC31 homolog A (S. cerevisiae)
- TFRC, transferrin receptor
- WIPI2, WD repeat domain, phosphoinositide interacting 2
Introduction
The phagophore membrane is a poorly defined structure, yet it is pivotal in understanding the process of autophagy. Advancing technologies and 60 y of research are yet to yield conclusive evidence identifying the origin of the lipid source from which the phagophore membrane forms, with conflicting ideologies still existing today. The reason for this interest is that unlike most other cellular organelles which undergo proliferation as a result of fusion and fission events such as the mitochondria,Citation1 phagophores form de novo. In yeast cells, phagophore formation is restricted to a particular area of the cell termed the phagophore assembly site,Citation2,3 while phagophore formation in mammalian cells, is less predictable and phagophores can form anywhere throughout the cytoplasm.Citation4-6 Many researchers agree that phagophore formation adheres to the maturation model, whereby lipids which are critical for phagophore formation are derived from direct membrane flow or vesicular traffic from preexisting cytoplasmic organelles.Citation7 A consolidated overview is emerging which reveals that the ER is the most frequently occurring proximal organelle to forming phagophores and autophagosomes and that the potential site for the nucleation of the phagophore arises from an ER subdomain enriched in phosphatidylinositol 3-phosphate termed the omegasome.Citation8,9 More interestingly, the ER exhibits the most extensive cellular membrane network and forms well noted membrane contact sites (MCSs) with almost every membrane-bound organelle in the cell including, mitochondria, Golgi complex, lysosomes, endosomes, peroxisomes and the plasma membrane,Citation10-12 with lipid exchange being the primary function to be described for the ER–mitochondria contact sites.Citation13 This is of significance because 2 ET studies have demonstrated that the ER membrane was found cradling the inner and outer membranes of the phagophore with oneCitation14 or severalCitation15 MCSs evident. These MCSs were primarily with the inner ER membrane and could be the morphological confirmation of the nucleation site termed the omegasome.Citation14 Nonetheless, the phagophore may also be included as yet another organelle that establishes membrane contacts with the ER.
After nucleation is complete, the phagophore undergoes a period of rapid growth whereby it can achieve a final diameter of 1000 nm, hence rapid membrane acquisition is essential during this phase. The organelles which have been implicated as possible membrane sources for a growing phagophore are the ER,Citation15-18 Golgi complex,Citation19,20 plasma membrane,Citation21-23 mitochondria,Citation24-26 and recycling endosomes.Citation27,28 More recently, novel data is emerging that shows that phagophore biogenesis occurs at the ER mitochondria contact sites,Citation29,30 and that several organelles may contribute to their formation including ER exit sitesCitation31 and specific coat protein II (COPII)-coated vesicles budding off the ER exit sites,Citation32 as well as at the ER-Golgi intermediate compartment.Citation33 All of these findings show the lack of consensus among researchers on the membrane source for the growing phagophore or it may be that all these membranes are somehow involved.
Determining phagophore membrane assembly is challenging since autophagic membranes are rich in lipid but poor in protein.Citation7,34,35 In recent years researchers have adopted a more molecular approach to identify and characterize autophagic compartments as a result of the discovery of over 30 autophagy-related (ATG) proteins.Citation36 Although the identification of these ATG proteins has advanced the field tremendously, this approach has some limitations particularly when trying to investigate the formation of the phagophore. Nearly all ATG proteins appear transiently in association with the phagophore membraneCitation37 and have no known integral membrane domainsCitation38,39 apart from ATG9;Citation38 however, ATG9 also appears transiently. Only MAP1LC3/LC3 (microtubule-associated protein 1 light chain 3) has been observed on all autophagic structures (i.e., phagophores, autophagosomes, and autolysosomes).Citation40 Recently WIPI2 has been found to be recruited to early autophagosomal structures (phagophores) and is required for the formation of LC3-positive autophagosomes, but is no longer present in sealed autophagosomes.Citation41 These 2 markers have been employed in our investigation for immuno electron microscopy (immunoEM) and immunofluorescence respectively. However, the reliability of immunolabelling is dependent on several factors including quality of the antibodies and accessibility of the epitopes in the samples. Hence, electron microscopy still continues to be the most reliable method to study phagophore biogenesis as one can easily identify the 2 tightly packed membrane bilayers of the phagophore as it nucleates to form an electron-dense c-shaped structure, particularly when contrasted with reduced osmium.Citation16,42 The phagophore can also appear to have a cleft or an empty space separating the 2 membranes, but in a morphological paper by Kovacs et al., this cleft is suggested to be an artifact of fixation.Citation18 Collectively, all the aforementioned investigative approaches may justify why we observe so many discrepancies in the possible membrane supply for the emerging phagophore. It is also possible that phagophores are opportunistic and may utilize more than one membrane source.
In addition to immunolabelling, this investigation has utilized serial block face scanning electron microscopy (SB-EM) to help quantify and characterize the spatial distribution of phagophores within the cell and their relationship with adjoining organelles. This method allows for the ultrastructural morphology of the whole cell volume to be sampled and generated in a 3D model.Citation43 In this method, a resin block with the cell monolayer is mounted onto a platform inside a scanning electron microscope. An inbuilt ultramicrotome within the chamber sections 40-nm slices of the block and the electron beam scans the highly contrasted block face and images are recorded using a backscatter detector. Since the block face is imaged, this technique results in the acquisition of a perfectly aligned high resolution data stack of the whole cell volume. This data is then ready for segmentation and modeling and generates vital information about which organelles are encapsulating the phagophore in a 3-dimensional space. In a pioneering paper on ER and mitochondria interactions, Achleitner et al, propose that a distance of less than 30 nm between 2 organelles is indicative of organelle interaction.Citation44 This is based on the fact that membrane surface proteins (and there may be several), which mediate the organelle-organelle interaction have a hypothetical size of 300 amino acids and therefore could be anywhere from 4 to 45 nm in diameter. Hence the resolution achieved with SB-EM complies with the distance proposed by Achleitner et al.
Nevertheless, even though SB-EM allows the verification of which organelles are surrounding the phagophore at an ultrastructural level, the double heavy metal staining with osmium used in this method reduces the resolution to precisely conclude which organelles are making direct membrane contacts with the phagophore, either by membrane bridges or membrane continuity, so for this to be confirmed an even more powerful imaging tool is required.
Hence, after initial mapping with SB-EM is conducted, this study further employs dual-axis ET. Electron tomography is the key in generating detailed organellar characterization at the nanometer scale and is essential for the confirmation of direct membrane contacts between 2 organelles. In this method a thick (250 nm) section is inserted into a tomographic holder in a transmission electron microscope which allows for the section to be tilted over ±62° in dual axis. The back projection of acquired images allows for a 3D reconstruction to be achieved. With this method tomographic slices which are 1.6-nm thick allow for intricate detail of membrane contacts to be analyzed. This technique has been readily implemented within our laboratories and has been utilized to show that the region of the ER cisternae found next to the forming phagophore, makes several connections with the phagophore membrane,Citation16 thus implicating the ER in initial phagophore biogenesis. This finding was consistent with the work of Hayashi-Nishino et al, who also use ET to show that the phagophore membrane (referred to as the isolation membrane in that paper) originates in a subdomain of the ER.Citation15,42 Both of these studies used similar agents to induce autophagy but different cell lines, however, both confirmed a similar finding.
Here we will report on the findings that a multifaceted approach utilizing immunolabelling at the light and electron microscope level as well as SB-EM and ET is generating on the relationships of phagophores with surrounding organelles. Our results show that in addition to the ER, phagophores can have simultaneous contacts with other organelles including mitochondria, late endosomes or lysosomes, Golgi complex and putative ER exit sites.
Results
Golgi complex, recycling endosome, late endosome and ER exit site markers colocalize with the phagophore marker WIPI2 in NRK cells
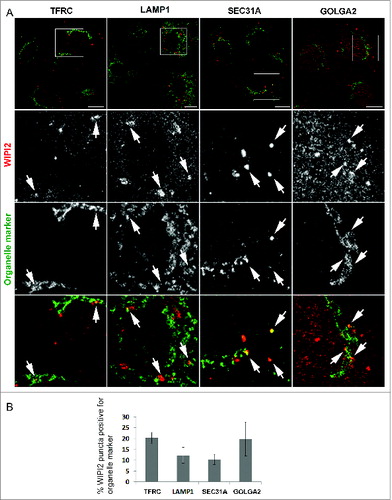
In order to estimate how often phagophores localize in the vicinity of organelles that have been implicated to play a role in their biogenesis, we performed double immunofluorescence staining with an established phagophore marker, WIPI2,Citation41 and different organelle markers (). Confocal image stacks were taken of immunolabelled NRK cells and optical sections from approximately the middle of the stacks were analyzed for overlapping of the WIPI2 and organelle markers TFRC (transferrin receptor; recycling endosomes), LAMP1 (lysosomal-associated membrane protein 1; late endosomes or lysosomes), SEC31A (SEC31 homolog A [S. cerevisiae]; ER exit sites), and GOLGA2/GM130 (golgin A2; Golgi complex). Optical sections from 17 to 26 cells were analyzed for each organelle marker. Clear overlap of WIPI2 and the marker was counted for a positive event, meaning that phagophores form in the close vicinity of the organelle in question. We found that approximately 20% of the existing WIPI2 puncta were also positive for TFRC. Approximately the same percentage of WIPI2 puncta was positive for GOLGA2. Approximately 12% of WIPI2 puncta were positive for LAMP1 and 10% of the WIPI2 puncta overlapped with SEC31A (). These results indicate that phagophores frequently form in close vicinity to recycling endosomes, Golgi complex, late endosomes or lysosomes, and ER exit sites.
Figure 1. Immunofluorescence micrographs showing that the phagophore marker WIPI2 colocalizes with organelle markers TFRC, LAMP1, SEC31A, and GOLGA2. (A) Clear overlapping of the 2 labels was counted as a colocalization event (arrows). Scale bars: 10 μm. (B) Percentage of WIPI2 puncta positive for the organelle markers. Chart and error bars show the mean and SEM from 17 to 26 cells.
Pre-embedding immunoEM further confirms that LC3-positive structures lie in close proximity to the Golgi complex, recycling endosomes and late endosomes or lysosomes, putative ER exit sites and mitochondria
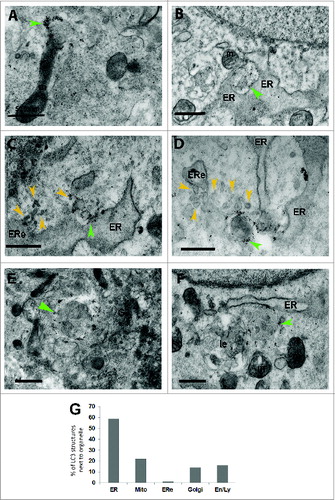
Immunofluorescence can visualize only those proteins that are labeled with antibodies, in practice this means that only a few proteins can be localized simultaneously. In transmission electron microscopy, however, all membrane-bound organelles are visible and most of them can be identified by morphology. To complement the immunofluorescence analysis, we also performed electron microscopy, using 3 different approaches starting with immunoEM. In order to facilitate the identification of phagophores and early autophagosomes, we performed immunoEM of endogenous LC3. This approach revealed that several organelles lie adjacent (within 20 nm) to LC3-positive early autophagosomes (). Further, the analysis showed that 1 phagophore or early autophagosome typically localizes next to several other organelles, typically next to the ER and one or more other organelles such as mitochondria (), Golgi complex (), putative ER exit sites or putative COPII coated vesicles (), and recycling or late endosomes (). Putative ER exit sites and COPII vesicles were identified as ribosome-free regions of the ER with associated coated and uncoated 50- to 100-nm vesicles. When 51 LC3-positive phagophores or early autophagosomes were identified via both LC3 immunolabelling and morphology, 59% were close to the ER, 22% were close to 1 or more mitochondria, 16% were close to a recycling endosome or a late endosome or lysosome, 14% were close to the Golgi complex and 1% were close to a putative ER exit site (). These findings are in agreement with the immunofluorescence results presented in , and in addition show that one phagophore is typically close to more than one other organelle.
Figure 2. Immunolabeling at the electron microscope level showing that LC3-positive phagophores and early autophagosomes are found in close proximity to mitochondria, ER, putative ER exit sites, Golgi complex and late or recycling endosomes or lysosomes. LC3-positive structures (green arrowheads) with the morphology of phagophores or early autophagosomes are found very close to a mitochondrion (m) (A and B, F), close to the ER (B to D, F), close to a putative ER exit site (ERe and yellow arrowheads) (C and D), close to a Golgi complex (Go) (E), and close to a recycling or late endosome, or a lysosome (le) (F). Percentage of LC3-positive phagophores and early autophagosomes lying in close proximity to other organelles (G). A total of 51 LC3-positive structures were scored for this analysis.
SB-EM and ET revealed that one phagophore can have contacts with more than one organelle
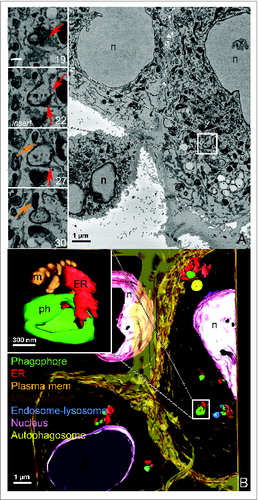
In order to study the relationship of phagophores to other organelles at high resolution in whole cells in 3D images, we performed SB-EM. Data acquired using SB-EM generated valuable information about the spatial distribution of phagophores in regards to their surrounding organelles. Using SB-EM, phagophores were identified as highly contrasted open c-shaped structures (, Fig. S1 and S2, Movie S1 and S2). Analysis of aligned stacks revealed that even if all the cells in the monolayer were exposed to an identical starvation treatment, the number of phagophores and autophagosomes varied greatly in cells. This was probably due to cells undergoing different stages of autophagy with some cells exhibiting no phagophores. Phagophores did not exhibit a preferential spatial distribution however most phagophores appeared to be perinuclear and midway along the z axis, that is, equal distance from the upper and lower surface of the cells attached to the cover slip. SB-EM also revealed that while all phagophores were located next to ER, most of them also had other organelles (mitochondria, endosomes or lysosomes) in their immediate vicinity in more than 55% of phagophores examined.
Figure 3. SB-EM reveals the spatial localization of phagophores and autophagosomes in whole cells. (A) Micrograph of SB-EM showing the overview of the cell with phagophores present (box outline depicts 1 of them). Inserts show 1 phagophore of interest, which is identified as an electron-dense open c-shaped structure, and the sequential SB-EM slices of the same phagophore are numbered. Orange arrow in the inserts depicts a mitochondrion in close proximity to the phagophore; the red arrows depict ER in close proximity to the phagophore. Figures S1 and S2 show serial images and a 3D model of additional phagophores and other organelles from this same cell. n, nucleus. (B) A 3D model of the SB-EM data shown in panel (A), and the spatial distribution of some of the phagophores within the cell. The color codes are assigned as follows; phagophores (ph) are green, the ER (ER) is red, plasma membrane is orange, mitochondria (m) are brown, endosomes or lysosomes are blue, nuclei (n) are pink and autophagosomes are yellow. The insert depicts the close communication between the phagophore and adjoining ER and mitochondria. Movies S1 and S2 show this same dataset.
ET was performed to collect high-resolution information on the contacts between phagophores and the organelles in their vicinity. For ET, the double membrane of the phagophore was selectively contrasted with reduced osmium stainingCitation16,42 (, Movies S3 and S4). As demonstrated by Kovacs et al., the 2 limiting membranes of the phagophores were attached to each other, without an empty space between them (, , Movies S3 and S4).Citation18 We performed high pressure freezing followed by freeze-substitution to confirm the morphology of the double membranes. The data revealed that autophagosomes do not exhibit an empty cleft between the 2 limiting membranes (Fig. S3). Raw data from tomographic slices was used to search for membrane contacts between the phagophores and adjoining organelles. 3D modeling was carried out independently by 2 researchers and findings were consistent. As a result, ET revealed contact sites between the phagophore membrane and several surrounding organelles, as detailed below.
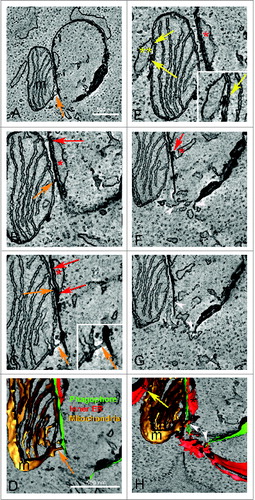
Figure 4. One phagophore can have simultaneous contacts with several organelles. Tomographic slices (1.6 to 2 nm) of a phagophore surrounded by several organelles (B and C, E–G) and the corresponding 3D model (D, H). (A) Electron micrograph taken from the 250-nm section showing the phagophore and associated organelles. The phagophore (ph) is visible as a dark curved membrane. The dark blue arrowheads indicate the contour of the late endosome or lysosome (le) below the phagophore. A dark structure inside the late endosome or lysosome is connected with the phagophore by a narrow dark line. Go indicates the Golgi apparatus. The boxed area was used for the tomography. Tomographic slices reveal that the electron-dense c-shaped phagophore is lying between the inside (red *) and outer (yellow **) ER sheets (B–E). Red arrows depict the membrane contact sites between the phagophore and the inside ER (B and C) and the yellow arrow indicates contact between the phagophore and an ER membrane next to the long tail of the phagophore (F). A putative ER exit site (ERe) which is depicted as an area of ER void of ribosomes, made up of tubular and sheet-like morphology and containing coated buds (c in panel F insert), putative COPII coated buds, is found on the right hand side of the phagophore (B and C, E–H). Coated vesicles (v) are seen next to the putative ER exit site (F insert, G and H). Blue arrows indicate membrane contacts between the phagophore and the putative ER exit site (B, E and F). In addition to the characteristic cup shape, the phagophore has an elongated tail portion of the membrane indicated by green arrowheads (E–G). The tail portion of the phagophore communicates with the thin cisterna of the Golgi complex (Go) as is indicated by light blue arrowheads (G, insert). The Golgi cisterna bends toward the phagophore and touches it, while the phagophore forms a dent in the area contacting the cisterna. The purple arrowheads indicate membrane continuity between the phagophore and the electron-dense structure contained within the lumen of the late endosome or lysosome (E, G and H). The limiting membrane of the late endosome or lysosome (G, dark blue arrowhead) forms a tunnel through which the dark structure reaches out of the late endosome or lysosome (E, G and H, insert) and communicates with the phagophore. Color code in panel H: green, phagophore; red and yellow, ER; gold, putative ER exit site; light blue, Golgi apparatus; purple, late endosome or lysosome limiting membrane; dark blue, electron-dense structure inside the late endosome or lysosome. Figure S5 shows the serial slices through the membrane continuity of the phagophore and the dark structure inside the late endosome or lysosome.
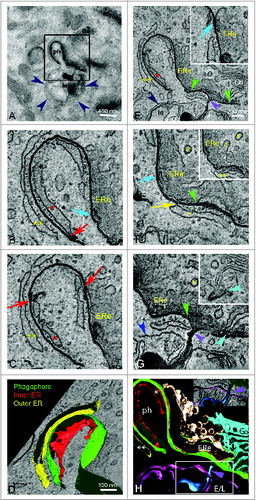
Figure 5. One phagophore can have contacts with both ER and a mitochondrion. Tomographic slices (1.6 to 2 nm) of the phagophore and its communication with a mitochondrion (A–C), contacts between the mitochondrion with ER (E), and the corresponding 3D models (D, H). (A) The electron-dense c-shape of the phagophore is found in close proximity to a mitochondrion (m). Membrane contact sites (orange arrows) depicted as membrane bridges are evident between the phagophore and the outer mitochondrial membrane (A–D, C insert). Figure S4 shows the serial slices through the contacting extension between the mitochondrial outer membrane and the phagophore shown in panel (C). The red arrows depict membrane contacts between the phagophore and the inner ER membrane (red *) (B and C, F). Yellow arrows indicate regions of contact between the outer mitochondrial membrane and the ER (E, insert, H). White arrowheads indicate the open end of the phagophore communicating with a cluster of tubules originating from the ER (F–H). The 3D model shows one of the membrane bridges between the phagophore membrane and the outer mitochondrial membrane (D, orange arrow) as well as 2 areas of communication which exist between the ER and the phagophore (H); one from the inner ER (red *, see panel F for confirmation of contact) and 2 at the base of the phagophore (white arrowheads). One ER cisterna (red **) communicates with the mitochondrion (H, yellow arrow).
Collectively SB-EM and ET identified 20 phagophores (in 12 cells sampled) and in 100% of all observations they were present in close proximity to the ER (within 10 nm using SB-EM) (, Movie S1 and S2) or making contact with the ER as seen with ET data (, and , Movies S3 and S4). In addition to the ER, phagophores were also observed making contact with a putative ER exit site in 0.5% of all observations (, Movie S3), a mitochondrion in 29% of all observations (, Movie S3, Fig. S4), an endosome or lysosome in 17% of all observations (, Movie S3, Fig. S5) and the Golgi complex in 0.5% of all observations (, Movie S3).
ET revealed that membranes of a putative ER exit site and Golgi complex communicate with the phagophore
A close communication between the phagophore and a putative ER exit site was observed (, Movie S3). The putative ER exit site was identified as a cup shaped region of ER void of ribosomes, consisting of tubules and coated buds, likely to be COPII-coated vesicles budding off. The putative ER exit site spanned one-third of the outside region of the phagophore (). Close proximity of early autophagosomes and putative ER exit sites were also detected using high-pressure freezing and freeze substitution (Fig. S3A).
The tomogram in also revealed a contact site between the phagophore membrane and the Golgi complex (, light blue arrowhead, Movie S3). The Golgi complex was identified as a region of thin sheets that were arranged into thin cisternae, which were void of ribosomes and were surrounded by coated vesicles (60 to 80 nm in diameter). Only one contact site was detected in the tomographic slices. This contact site was in close proximity to the ER and the putative ER exit site. One of the Golgi cisternae was bending toward the phagophore and touching it, making a dent in the phagophore membrane (, Movie S3).
Membranes from a late endosome or lysosome were continuous with the phagophore membrane
shows that a late endosome or lysosome is located next to the phagophore described in . The late endosome or lysosome was identified by its size and morphology and by the arrangement of the internal membranes (). Using immunogold labeling we confirmed that organelles with similar morphology were LAMP1-positive (not shown). The tomographic slices revealed that the phagophore membrane was continuous with an electron-dense structure located inside the late endosome or lysosome ( purple arrows, Fig. S5, Movie S3). The continuity between the phagophore membrane and the structure inside the late endosome or lysosome was evident on the elongated tail of the phagophore membrane. The electron-dense structure was reaching out from the lumen of the late endosome or lysosome via a tunnel formed by the limiting membrane of the endosome or lysosome ( and S5).
To conclude, the phagophore membrane depicted in and Movie S3 made contact with ER, a putative ER exit site and Golgi cisternae, and was continuous with an electron-dense structure that was contained within the limiting membrane of a late endosome or lysosome.
Mitochondrial membranes made direct contacts with the phagophore membrane
Contact sites between the phagophore membrane and the outer mitochondrial membrane were also detected by ET (, , Movie S4). From the tomogram depicted in and Movie 4 showing tomographic slices, 4 independent contact sites were present between the phagophore and the outer mitochondrial membrane (Movie S4). Similar contact sites were also detected using high-pressure freezing and freeze substitution (Fig. S3A and B). Furthermore, on the opposite side of the mitochondrion in the tomogram, we observed a close communication between the mitochondrial membrane and the ER (, insert, , Movie S4). This tomogram also identified a region consisting of a cluster of ER tubules connected to the open end of the forming phagophore (, white arrowheads). Similar structures were recently shown to be positive for the omegasome marker ZFYVE1/DFCP1.Citation14 In addition, the phagophore had contact with the ER located inside it (). Taken together the phagophore depicted in has membrane contacts with ER and a mitochondrion.
Discussion
A multifaceted approach using immunolabeling at the light- and electron microscope level as well as 2 advanced imaging platforms namely SB-EM and ET have yielded important information about phagophore distribution within the cell and the relationships of phagophores to other organelles. Double immunolabeling at the light microscope level revealed that the phagophore marker WIPI2 frequently colocalized with various cellular compartments including the Golgi complex (20% colocalization), recycling endosomes (20% colocalization), late endosomes or lysosomes (12% colocalization) as well as ER exit sites (10% colocalization). ImmunoEM further confirmed these findings and also found that LC3-positive early autophagosomes were found in close proximity to mitochondria (22% colocalization). These findings are in agreement with previous results reporting that ER, mitochondria, recycling endosomes, and ER exit sites contribute to autophagosome formation.Citation16,24,31,42,45 Even though some of the organelle markers exhibit lower colocalization percentages with the phagophore marker, this does not infer that the organelle is less likely to contribute to phagophore membrane assembly, it might however infer that the putative interaction is short lived. Hamasaki et al. reported that ATG5, which only binds to the phagophore membrane but not to autophagosomes, showed a stable association with the ER, however, the association of ATG5 with the mitochondria oscillated dynamically (but remained within 0.5 μm).Citation30 Nevertheless that study still reports that 79% of ATG5-positive puncta localize within 0.88 μm of the mitochondria.
Hence, the immunolabeling data provided information about which organelles should be sampled further at an ultrastructural level to determine whether these same cytoplasmic organelles have a relationship with the phagophore in a 3D space. SB-EM was incorporated to screen the whole cell volume to help quantify which organelles lie close to phagophores and ET was used to determine whether the phagophore membrane was indeed communicating with the adjoining organelles and establishing MCSs. Hence, this ultrastructural investigation reports on direct membrane contacts between the phagophore membrane and the ER, (putative) ER exit sites, mitochondria, the Golgi complex, as well as late endosomes or lysosomes.
Cells generally favor newly synthesized phospholipids for the production of organellar membranes and specialized vesicles.Citation46-48 The ER is the largest membrane bound organelle in the eukaryotic cell and the main source for the de novo synthesis of all bilayer-forming phospholipids within the entire endomembrane system.Citation49 Therefore the involvement of the ER in phagophore nucleation is highly probable and is further supported by the findings that several gene products necessary for ER export are also required for autophagy.Citation32,50 In addition, some autophagosomes have been shown to form in omegasomes, which are a subcompartment of the ER.Citation8 Further, the thickness of all autophagosomal membranes, which are 6 to 7 nm, also corresponds with the thickness of the ER membranes.Citation7,35
In this current investigation we identified several sites of direct membrane contact between the phagophore membrane and the ER cisternae found on the inside of the forming phagophore which is consistent with previous literature.Citation14,16,42 In addition, the tomogram featured in , also revealed that the open end of the phagophore communicated with an area of ER made up of a cluster of tubules. Similar clusters of tubules were recently shown to be positive for the omegasome marker ZFYVE1.Citation8,14 Additionally, our investigation also revealed that another specific domain of the ER, known as the ER exit site, can communicate with the phagophore membrane. The ER exit site is a region of the ER involved in the transport of proteins from the ER via specific COPII vesicles.Citation50,51 Our finding is consistent with previous literature which reported that RAB1-labeled vesicles that originate from the ER exit site colocalize with the autophagy protein LC3 upon induction of autophagy.Citation50 Other recent papers showed that ER exit sites are physical and functional components of autophagosome biogenesis in yeast,Citation31 and that COPII coated vesicles are required for autophagosome formation in yeast.Citation32 Further to this, a cell free assay used to investigate LC3 lipidation demonstrated that the ER-Golgi intermediate compartment may be a key membrane source for autophagosome biogenesis.Citation33 These results support the idea that the initial double membrane cistern which later curves to give rise to the phagophore could originate from a membrane source supplied by the ER. Our present findings are consistent with this and further show that ER exit sites can form very close spatial contacts with phagophores.
This investigation also identified a direct continuation between the phagophore membrane and an electron-dense membrane structure located inside a late endosome or lysosome. Continuity between autophagosomes and lysosomes, has been observed in one study upon serial sectioning as far back as 1978Citation52 and in another study whereby it is hypothesized that phagophores can recycle from the lysosomal lumen.Citation53 In addition, based on EM data, the phagophore membrane is suggested to recycle from the lysosome back to the cytoplasm to perform repeated rounds of sequestration.Citation53 The phagophore is indeed reported to have physical connections with the lysosomes,Citation53 however this study did not use ET to confirm these findings. Although MCS between phagophores and autophagosomes and endosomes and lysosomes have been reported in 3 studies (Refs. 52 and 53, and the present study), they seem to be either seldom or very short lived, or both, since they are observed only occasionally even in 3D images.
The electron-dense structure that is continuous with the phagophore shown in is heavily stained with reduced osmium tetroxide, which suggests that like phagophores, the structure is rich in unsaturated fatty acids. Since the whole structure is heavily stained, it is not possible to see whether there is a limiting membrane bilayer around the structure. However, the finding that the electron-dense structure is continuous with the phagophore membrane (which is formed by 2 adjacent lipid bilayers) suggests that the electron-dense structure is also membrane bound. Another possibility is that the electron-dense structure is some kind of lipid accumulation without a limiting membrane bilayer.
More interestingly, recycling endosomes have recently been shown by several groups to be involved in phagophore formationCitation27,45,54,55 with one study suggesting that SNX18 is needed for lipidation of LC3 and tubulation of recycling endosomes to provide membranes for phagophore expansion.Citation54 These observations as well as our own results, suggest that membrane communication between the phagophore and the endosomal or lysosomal compartment could be a direct route for lipid transport between the 2 structures.
Several recent investigations have suggested that mitochondria can supply membranes or lipids to forming autophagosomes.Citation24,56,57 Previous literature has also demonstrated that a diffusion barrier which exists between the mitochondrion and the autophagosome only allows for mitochondrial membrane lipids, but not proteins to be translocated to the autophagosome.Citation24 Hailey et al., have also demonstrated that a domino effect of lipid translocation exists whereby lipid from the ER is first transported into the mitochondria followed by a subsequent lipid translocation into the autophagosome.Citation24 The communication between the ER and the mitochondria was suggested to resupply lipid to the mitochondria to compensate for lipid transport into the autophagosomes. Data generated by our investigation supports these hypotheses, as ET revealed contacts between the outer mitochondrial membrane and the phagophore via thin connecting bridges on chemically fixed tissue. Our preliminary high pressure freezing data also show similar contact sites (Fig. S3A and B). In addition to this, new data from Hamasaki et al., have indicated that phagophores form at the ER-mitochondria contact sites.Citation30 A major source of mitochondrial phospholipids is the ER, and this contact region is suggested to be an area of lipid synthesis and lipid exchange via thin membrane bridges between the 2 organellesCitation58,44,59,60 as mitochondria are not connected to the vesicular trafficking pathway like most other organelles.Citation61 Interestingly, our current investigation demonstrated that when the growing phagophore is communicating with a mitochondrion, that same mitochondrion is simultaneously communicating with an adjoining ER membrane. This finding is in agreement with the results reported by Hamasaki et al.Citation30
Previous literature has implicated the Golgi complex as a possible source for phagophore membrane biogenesis,Citation62 in particular, as a potential source of ATG9 vesicles that are needed for autophagosome biogenesis.Citation37,63-66 The present investigation concentrated on membrane contacts between phagophores and other morphologically identifiable organelles. Thus we did not detect small vesicles (such as ATG9 vesicles) in this study. However, we did detect considerable colocalization between the phagophore marker WIPI2 and the Golgi marker GOLGA2, as well as a close communication between the membranes of a phagophore and a Golgi cisternae, which has not been shown before using electron tomography. However, LC3 has been reported to be recruited to the trans Golgi network. Upon association with a specific trans Golgi network domain, LC3 vesicles were reported to carry LC3 to the phagophore membranes derived from the ER or other membrane compartments.Citation67 These findings, as well as our own current data further suggest that the Golgi complex may mediate membrane transport to the newly developing phagophore.
Further to this, mammalian ATG9 was recently shown to transiently interact with autophagosomes.Citation38 Earlier studies reported that ATG9 cycles between the trans Golgi network and late endosomes,Citation68 and that ATG9 vesicles are transported to forming autophagosomes from the Golgi.Citation66 In contrast to this, Rubinszstein's group reports that mammalian ATG9 traffics from the plasma membrane to recycling endosomes, where it meets ATG16L1, which also arrives from the plasma membrane but in separate vesicles.Citation27 According to these results, ATG9 vesicles arriving to the phagophores would originate from the recycling endosomes, not from the Golgi complex. SNAREs are transmembrane proteins that drive the fusion process between 2 opposing membranes. Several SNAREs have recently been shown to regulate autophagosome formation in both mammalian cells and in yeast.Citation69 SNARE proteins regulate the formation of tubulovesicular ATG9-positive structures that are proposed to form phagophore precursors. Citation69 Future studies will be needed to show the high-resolution 3D morphology of the ATG9-positive phagophore precursors and whether they form membrane contacts with other organelles such as the Golgi complex and recycling endosomes.
Nonetheless, intracellular trafficking and lipid exchange is not mediated exclusively via vesicular transport that depends on SNARE-mediated membrane fusion.Citation12 Increasing evidence suggests that MCSs are optimal sites for short-distance lipid exchange in organelles which have limited lipid synthesis ability and do not rely on vesicular transport pathways such as the mitochondria and peroxisomes.Citation70 MCSs are regions where the membranes of 2 organelles are closely apposed, typically 10 to 20 nm apart.Citation10-12 Ongoing research as well as this current investigation have revealed that phagophores indeed form MCSs with several surrounding organelles. Our tomography data suggests that with one exception (), the phagophore membrane is tethered to the adjacent organelle, rather than being continuous with it. Thus, we call these contacts MCSs. More importantly, we also show that one phagophore can form simultaneous MCSs with more than one organelle.
It has been reported that lipid transport is greatly facilitated at MCSs and can occur via several mechanisms. In monomeric lipid exchange, lipid molecules are transported through an aqueous phase from the outer leaflet of the donor membrane to the outer leaflet of an acceptor membrane.Citation71 Another mode of lipid exchange at MCSs occurs via lateral diffusion whereby transport of lipid occurs via membrane bridgesCitation71 between 2 membranes. These membrane continuities have been previously described between the ER and the outer mitochondrial membrane as well as the plasma membrane and lipid droplets.Citation72,73 Further to this, many lipid transporting proteins which catalyze lipid transport are also targeted to MCS, with CERT being one example of ceramide transport at the Golgi-ER MCS.Citation74 Therefore it is highly likely that MCSs that are present between the phagophore and the ER, Golgi complex, mitochondria and late endosomes and lysosomes may indeed participate in some form of cross talk and exchange between the 2 organelles.
Hence, SB-EM as well as ET data are revealing that MCSs between the phagophore and other organelles are a common but largely overlooked phenomenon that is only surfacing due to advanced techniques in 3D microscopy such as ET. This network of contact sites is however functionally important, it is suggested to coordinate cellular activity between the membranes of different organelles and create microdomains that favor exchange between 2 organelles.Citation11
Nevertheless, whether these contact sites between phagophores and other organelles also infer that lipid translocation is taking place requires further investigation. This study can serve as a guide and direct future lipid translocation experiments to determine whether these organelles are undeniably supplying lipid to the growing phagophore. If Achleitner´s proposition about organellar interaction is to be considered, then a direct membrane contact between 2 organelles may be indicative of more than just simple organelle-organelle association.
Our study also revealed that one phagophore can have simultaneous MCS with more than one other organelle. In our 3D ET images, we observed that all phagophores have MCS with the ER, and in addition, in over 80% of images the phagophores had MCS with a second organelle: mitochondria, endosome or lysosome, Golgi complex, ER exit site (this study), or lipid droplets (Ylä-Anttila et al. 2009). At present we are not able to provide experimental evidence to show that MCS with more than one organelle are required for autophagosome biogenesis. However, the frequency at which we observe these multiple connections or contacts suggests that this is a frequent event during autophagosome formation.
Materials and Methods
Cell culture and induction of autophagy
Normal rat kidney (NRK-52E, ATCC CRL-1571) cells were grown in Dulbecco's modified Eagle's medium (DMEM; Sigma, D6546) supplemented with 10% fetal calf serum, 100 U/ml penicillin-streptomycin and 100 U/ml glutamine in an incubator with 5% CO2 at 37°C. In all experiments, autophagy was induced by starvation in serum and amino acid free Earle's balanced salt solution (EBSS; Gibco, 24010043) for 1 h.
Immunofluorescence
Cells were grown on glass coverslips to semiconfluency. Cells were fixed in 4% paraformaldehyde (PFA; J.T. Baker, 1157) in phosphate-buffered saline (PBS; 137 mM NaCl; 2.7 mM KCl; 10 mM Na2HPO4; 18 mM KH2PO4) for 20–30 min at room temperature or in methanol at −20°C for 2 min, or using a combination of both treatments. PFA fixed cells were permeabilized with 0.1% Triton X-100 (MP Biomedicals, 9002-93-1) in PBS for 5 min and free aldehyde groups were blocked with 0.12% glycine in PBS for 10 min. The cells were double labeled with an antibody against the phagophore marker WIPI2 (Abcam, ab105459; or Sigma, HPA021488) and antibodies against the organelle markers LAMP1 (rabbit anti-rat, gift from Yoshitaka Tanaka, Kyushu University, Japan), GOLGA2 (BD Laboratories, 610823), SEC31A (BD Laboratories, 612351), and TFRC (transferrin receptor; Invitrogen, 136800), followed by goat secondary antibodies conjugated to Alexa Fluor 488 or 594 (Invitrogen, A11029, A11037). After antibody labeling the coverslips were mounted on object glasses with Mowiol (Calbiochem, 475904) containing 1,4-Diazabicyclo[2.2.2]octane (Dabco; Sigma, D-2522) as antifading agent and 4',6-diamidine-2-phenyl indole (DAPI; Pierce, 62247) to stain the nuclei. Images were obtained with a confocal microscope (Leica DM5000, HCX APO 63x/1,30 Corr [glycerol] CS 21 objective). Optical sections from the middle of the image stack, transversing the nucleus, were analyzed for colocalization of WIPI2 staining and each organelle marker staining. Colocalization was determined by the presence of both immunofluorescence signals in vesicular or punctate organelles.
Pre-embedding immunoEM
Cells were grown on glass coverslips to semi confluency. Cells were fixed in 4% PFA in 0.1 M phosphate buffer (PB, pH 7.4) for 1 h at room temperature. After washing with PB, free aldehyde groups were quenched with 4% glycine in PB for 10 min. The cells were then dipped in liquid nitrogen to permeabilize the membranes (in accordance with manufacturer's instructions, Cosmo Bio, CTB-LC3-2-IC) and blocked with 5% BSA (Biowest, P6154), 5% normal goat serum (PAA Laboratories, B11-035), 0.005% saponin (Sigma, S7900) and 0.1% cold water fish skin gelatin (Sigma, G7765) in PB. The cells were labeled with antibodies against LC3-positive compartments within the cell using mouse monoclonal anti-LC3 (Cosmo Bio, CTB-LC3-2-IC) for 1 h at RT. Cells were washed in PB containing 0.01% saponin and 0.1% BSA and incubated in goat anti-mouse IgG conjugated to 1.4-nm nanogold particles (Nanoprobes, 142002). Cells were washed with PB and fixed with 1.5% glutaraldehyde in PB for 10 min. After washing, the gold labeling was intensified by using a HQ silver enhancement kit (Nanoprobes, 2012) and gold toning was performed to stabilize the silver enhancement by subsequent washes in 2% sodium acetate, 0.05% gold (III) chloride trihydrate and 0.3% sodium thiosulphate pentahydrate (Sigma, S2889; G4022 and S292, respectively). After washing in distilled water, cells were postfixed in 1% OsO4 containing K4[Fe(CN)6] (15 mg/ml) in 0.1 M sodium cacodylate buffer at room temperature for 1 h, washed in distilled water, dehydrated with a graded series of ethanol, infiltrated with resin (TAAB Laboratories, Epon 812) for 1 h and polymerized at 60°C overnight. Ultrathin sections were collected onto pioloform-coated grids (EMS, G2010-Cu), post stained with uranyl acetate and lead citrate and viewed using a Tecnai 12 (FEI, the Netherlands) electron microscope.
Serial block-face scanning electron microscopy
NRK-52E cells were grown on 3-cm dishes (Greiner bio-one, 627160) containing Thermanox coverslips (EMS, 72274) or sapphire discs (Leica, 16706849) to subconfluency. The cells were fixed in 2% glutaraldehyde in 0.1 M sodium cacodylate buffer, pH 7.4, postfixed using a double osmication method,Citation75 and embedded in resin (Fluka, Durcupan ACM) between 2 objective glasses.Citation43 The block was imaged with a 2.5 kV beam voltage using a back scattered electron detector (Gatan Inc.., 25650-30, Pleasanton, CA) in a FEG-SEM Quanta 250 microscope (FEI Company, Hillsboro, OR). The microscope chamber was equipped with an ultramicrotome (3View, Gatan Inc.., Pleasanton, CA), which allowed for serial sectioning (40-nm sections) of the block face. Images of the block face were captured using Gatan Digital Micrograph software, captured images were converted to MRC format and IMOD software was used to segment each slice by hand to generate a 3D model of the image stack. Quantification of phagophores was carried out from data generated from 4 SB-EM acquisitions.
3D tomography
NRK-52E cells were grown on 3-cm dishes containing glass cover slips to subconfluency. The cells were fixed in 2% glutaraldehyde in 0.1 M sodium cacodylate buffer, pH 7.4, postfixed in reduced osmium tetroxide, and flat embedded in Epon.Citation76 Semithick 250-nm sections were prepared and picked up on single slot grids. Colloidal gold particles, 10 nm in diameter, were placed on top of the sections to serve as fiducial markers for alignment of the tomograms. Dual axis tilt series were acquired using SerialEM softwareCitation77 running on a Tecnai FEG 20 microscope (FEI, the Netherlands) operating at 200 kV with a nominal magnification of 19 000 x giving a final pixel size of 0.56 nm. Images were recorded at 1 degree intervals for the a-axis and 1.5 degree intervals for the b-axis with either a 1 k × 1 k or a 4 k × 4 k CCD camera (Gatan Inc., USA) over a tilt range of ±62 degrees. IMOD software was used to create 3D reconstructions from the tilt series and to create 3D models of the membranes.Citation78 Tilt series were captured from 6 regions (from different cells) and segmentation and 3D modeling was performed on 3 of those tomographic sequences.
Reduced osmium specifically stains the double bonds of unsaturated lipids and as a result the 2 tightly apposed membranes of the phagophore appear as dense osmiophillic structures. In addition to the dense staining, the phagophore membrane was identified by its characteristic size and c-shaped morphology as the structure has not completed full closure yet. The rough ER was identified by its characteristic structure and the presence of ribosomes on the membrane surface and the putative ER exit sites were identified as regions in among the ER which are void of ribosomes and consist of either coated buds or several 100 to 400 nm long membrane protrusions and vesicles (putative COP II-coated buds and vesicles). The Golgi complexes were identified by their characteristic shape and organization into thin flat cisternae (30- to 40-nm intercisternal space). Late endosomes and lysosomes were identified by their morphology, size and arrangement of internal membranes while mitochondria were identified by their characteristic shape and cristae arrangement.
High pressure freezing and freeze substitution
Cells for high pressure freezing were cultured on 3-mm sapphire discs, cryoprotected with 20% BSA, high pressure frozen using a Leica EM HPM100 (Leica Microsystems) and transferred to the automated freeze substitution apparatus (Leica EM AFS) under liquid nitrogen in a solution containing 2% osmium tetroxide, 0.3% uranyl acetate in acetone. Samples were maintained at −95°C for 4 h, slowly warmed to −60°C (5°C per h) and maintained for 2 h, slowly warmed to −30°C (5°C per h) and maintained for 2 h. Two washes with cold acetone were carried out at 0°C and cells were infiltrated in Epon resin at room temperature for 2 h and polymerized at 60°C.
Disclosure of Potential Conflicts of Interest
No potential conflicts of interest were disclosed.
Supplemental Material
Supplemental data for this article can be accessed on the pub-lisher's website.
1017178_Supplemental_Videos_and_Data.zip
Download Zip (32.4 MB)Acknowledgments
The authors would like to thank Mervi Lindman and Antti Salminen (Institute of Biotechnology, Electron Microscopy Unit) for technical help with ET and SB-EM sample preparation as well as Kèvin Knoops for his advice and insight on sample preparation for cryofixation.
Funding
The study was supported by the Academy of Finland and Biocenter Finland.
References
- Chan DC. Mitochondrial fusion and fission in mammals. Annu Rev Cell Dev Biol 2006; 22:79-99; PMID:16704336
- Suzuki K, Kirisako T, Kamada Y, Mizushima N, Noda T, Ohsumi Y. The pre-autophagosomal structure organized by concerted functions of APG genes is essential for autophagosome formation. EMBO J 2001; 20:5971-81; PMID:11689437; http://dx.doi.org/10.1093/emboj/20.21.5971
- Suzuki K, Ohsumi Y. Current knowledge of the pre-autophagosomal structure (PAS). FEBS Lett 2010; 584:1280-6; PMID:20138172; http://dx.doi.org/10.1016/j.febslet.2010.02.001
- Abounit K, Scarabelli TM, McCauley RB. Autophagy in mammalian cells. World J Biol Chem 2012; 3:1-6; PMID:22312452
- Klionsky DJ. The molecular machinery of autophagy: unanswered questions. J Cell Sci 2005; 118:7-18; PMID:15615779; http://dx.doi.org/10.1242/jcs.01620
- Longatti A, Tooze SA. Vesicular trafficking and autophagosome formation. Cell Death Differ 2009; 16:956-65; PMID:19373247; http://dx.doi.org/10.1038/cdd.2009.39
- Juhasz G, Neufeld TP. Autophagy: a forty-year search for a missing membrane source. PLoS Biol 2006; 4:e36; PMID:16464128
- Axe EL, Walker SA, Manifava M, Chandra P, Roderick HL, Habermann A, Griffiths G, Ktistakis NT. Autophagosome formation from membrane compartments enriched in phosphatidylinositol 3-phosphate and dynamically connected to the endoplasmic reticulum. J Cell Biol 2008; 182:685-701; PMID:18725538; http://dx.doi.org/10.1083/jcb.200803137
- Ktistakis NT, Andrews S, Long J. What is the advantage of a transient precursor in autophagosome biogenesis? Autophagy 2011; 7:118-22; PMID:20935487; http://dx.doi.org/10.4161/auto.7.1.13697
- Friedman JR, Voeltz GK. The ER in 3D: a multifunctional dynamic membrane network. Trends Cell Biol 2011; 21:709-17; PMID:21900009; http://dx.doi.org/10.1016/j.tcb.2011.07.004
- Helle SC, Kanfer G, Kolar K, Lang A, Michel AH, Kornmann B. Organization and function of membrane contact sites. Biochim Biophys Acta 2013; 1833:2526-41; PMID:23380708; http://dx.doi.org/10.1016/j.bbamcr.2013.01.028
- Levine T. Short-range intracellular trafficking of small molecules across endoplasmic reticulum junctions. Trends Cell Biol 2004; 14:483-90; PMID:15350976
- Kornmann B. The molecular hug between the ER and the mitochondria. Curr Opin Cell Biol 2013; 25:443-8; PMID:23478213
- Uemura T, Yamamoto M, Kametaka A, Sou YS, Yabashi A, Yamada A, Annoh H, Kametaka S, Komatsu M, Waguri S. A cluster of thin tubular structures mediates transformation of the endoplasmic reticulum to autophagic isolation membrane. Mol Cell Biol 2014; 34:1695-706; PMID:24591649; http://dx.doi.org/10.1128/MCB.01327-13
- Hayashi-Nishino M, Fujita N, Noda T, Yamaguchi A, Yoshimori T, Yamamoto A. Electron tomography reveals the endoplasmic reticulum as a membrane source for autophagosome formation. Autophagy 2010; 6:301-3; PMID:20104025; http://dx.doi.org/10.4161/auto.6.2.11134
- Yla-Anttila P, Vihinen H, Jokitalo E, Eskelinen EL. 3D tomography reveals connections between the phagophore and endoplasmic reticulum. Autophagy 2009a; 5:1180-5; PMID:19855179; http://dx.doi.org/10.4161/auto.5.8.10274
- Yorimitsu T, Klionsky DJ. Eating the endoplasmic reticulum: quality control by autophagy. Trends Cell Biol 2007; 17:279-85; PMID:17481899; http://dx.doi.org/10.1016/j.tcb.2007.04.005
- Kovacs AL, Palfia Z, Rez G, Vellai T, Kovacs J. Sequestration revisited: integrating traditional electron microscopy, de novo assembly and new results. Autophagy 2007; 3:655-62; PMID:17603297; http://dx.doi.org/10.4161/auto.4590
- van der Vaart A, Griffith J, Reggiori F. Exit from the Golgi is required for the expansion of the autophagosomal phagophore in yeast Saccharomyces cerevisiae. Mol Biol Cell; 21:2270-84; PMID:20444982
- van der Vaart A, Reggiori F. The Golgi complex as a source for yeast autophagosomal membranes. Autophagy; 6:800-1; PMID:20714226
- Cuervo AM. The plasma membrane brings autophagosomes to life. Nat Cell Biol 2010; 12:735-7; PMID:20680002; http://dx.doi.org/10.1038/ncb0810-735
- Ravikumar B, Moreau K, Rubinsztein DC. Plasma membrane helps autophagosomes grow. Autophagy 2010; 6:1184-6; PMID:20861674; http://dx.doi.org/10.4161/auto.6.8.13428
- Ravikumar B, Moreau K, Jahreiss L, Puri C, Rubinsztein DC. Plasma membrane contributes to the formation of pre-autophagosomal structures. Nat Cell Biol 2010; 12:747-57; PMID:20639872; http://dx.doi.org/10.1038/ncb2078
- Hailey DW, Rambold AS, Satpute-Krishnan P, Mitra K, Sougrat R, Kim PK, Lippincott-Schwartz J. Mitochondria supply membranes for autophagosome biogenesis during starvation. Cell 2010; 141:656-67; PMID:20478256; http://dx.doi.org/10.1016/j.cell.2010.04.009
- Rambold AS, Lippincott-Schwartz J. Starved cells use mitochondria for autophagosome biogenesis. Cell Cycle 2010; 9:3633-4; PMID:20855967; http://dx.doi.org/10.4161/cc.9.18.13170
- Luo S, Chen Q, Cebollero E, Xing D. Mitochondria: one of the origins for autophagosomal membranes? Mitochondrion 2009; 9:227-31; PMID:19398041; http://dx.doi.org/10.1016/j.mito.2009.04.004
- Puri C, Renna M, Bento CF, Moreau K, Rubinsztein DC. Diverse autophagosome membrane sources coalesce in recycling endosomes. Cell 2013; 154:1285-99; PMID:24034251; http://dx.doi.org/10.1016/j.cell.2013.08.044
- Longatti A, Tooze SA. Recycling endosomes contribute to autophagosome formation. Autophagy 2012; 8:1682-3; PMID:22874560; http://dx.doi.org/10.4161/auto.21486
- Bockler S, Westermann B. ER-mitochondria contacts as sites of mitophagosome formation. Autophagy 2014; 10:1346-7; PMID:24905224; http://dx.doi.org/10.4161/auto.28981
- Hamasaki M, Furuta N, Matsuda A, Nezu A, Yamamoto A, Fujita N, Oomori H, Noda T, Haraguchi T, Hiraoka Y, et al. Autophagosomes form at ER-mitochondria contact sites. Nature 2013; 495:389-93; PMID:23455425; http://dx.doi.org/10.1038/nature11910
- Graef M, Friedman JR, Graham C, Babu M, Nunnari J. ER exit sites are physical and functional core autophagosome biogenesis components. Mol Biol Cell 2013; 24:2918-31; PMID:23904270; http://dx.doi.org/10.1091/mbc.E13-07-0381
- Tan D, Cai Y, Wang J, Zhang J, Menon S, Chou HT, Ferro-Novick S, Reinisch KM, Walz T. The EM structure of the TRAPPIII complex leads to the identification of a requirement for COPII vesicles on the macroautophagy pathway. Proc Natl Acad Sci U S A 2013; 110:19432-7; PMID:24218626; http://dx.doi.org/10.1073/pnas.1316356110
- Ge L, Melville D, Zhang M, Schekman R. The ER-Golgi intermediate compartment is a key membrane source for the LC3 lipidation step of autophagosome biogenesis. Elife 2013; 2:e00947; PMID:23930225; http://dx.doi.org/10.7554/eLife.00947
- Mijaljica D, Prescott M, Devenish RJ. Endoplasmic reticulum and Golgi complex: Contributions to, and turnover by, autophagy. Traffic 2006; 7:1590-5; PMID:17040485; http://dx.doi.org/10.1111/j.1600-0854.2006.00495.x
- Eskelinen EL, Reggiori F, Baba M, Kovacs AL, Seglen PO. Seeing is believing: the impact of electron microscopy on autophagy research. Autophagy 2011; 7:935-56; PMID:21566462; http://dx.doi.org/10.4161/auto.7.9.15760
- Klionsky DJ, Cregg JM, Dunn WA, Jr., Emr SD, Sakai Y, Sandoval IV, Sibirny A, Subramani S, Thumm M, Veenhuis M, et al. A unified nomenclature for yeast autophagy-related genes. Dev Cell 2003; 5:539-45; PMID:14536056; http://dx.doi.org/10.1016/S1534-5807(03)00296-X
- Koyama-Honda I, Itakura E, Fujiwara TK, Mizushima N. Temporal analysis of recruitment of mammalian ATG proteins to the autophagosome formation site. Autophagy 2013; 9:1491-9; PMID:23884233; http://dx.doi.org/10.4161/auto.25529
- Orsi A, Razi M, Dooley HC, Robinson D, Weston AE, Collinson LM, Tooze SA. Dynamic and transient interactions of Atg9 with autophagosomes, but not membrane integration, are required for autophagy. Mol Biol Cell 2012; 23:1860-73; PMID:22456507; http://dx.doi.org/10.1091/mbc.E11-09-0746
- Longatti A, Orsi A, Tooze SA. Autophagosome formation: not necessarily an inside job. Cell Res 2010; 20:1181-4; PMID:20838417; http://dx.doi.org/10.1038/cr.2010.132
- Kabeya Y, Mizushima N, Ueno T, Yamamoto A, Kirisako T, Noda T, Kominami E, Ohsumi Y, Yoshimori T. LC3, a mammalian homologue of yeast Apg8p, is localized in autophagosome membranes after processing. EMBO J 2000; 19:5720-8; PMID:11060023; http://dx.doi.org/10.1093/emboj/19.21.5720
- Polson HE, de Lartigue J, Rigden DJ, Reedijk M, Urbe S, Clague MJ, Tooze SA. Mammalian Atg18 (WIPI2) localizes to omegasome-anchored phagophores and positively regulates LC3 lipidation. Autophagy 2010; 6:506-22; PMID:20505359; http://dx.doi.org/10.4161/auto.6.4.11863
- Hayashi-Nishino M, Fujita N, Noda T, Yamaguchi A, Yoshimori T, Yamamoto A. A subdomain of the endoplasmic reticulum forms a cradle for autophagosome formation. Nat Cell Biol 2009; 11:1433-7; PMID:19898463; http://dx.doi.org/10.1038/ncb1991
- Puhka M, Joensuu M, Vihinen H, Belevich I, Jokitalo E. Progressive sheet-to-tubule transformation is a general mechanism for endoplasmic reticulum partitioning in dividing mammalian cells. Mol Biol Cell 2012; 23:2424-32; PMID:22573885; http://dx.doi.org/10.1091/mbc.E10-12-0950
- Achleitner G, Gaigg B, Krasser A, Kainersdorfer E, Kohlwein SD, Perktold A, Zellnig G, Daum G. Association between the endoplasmic reticulum and mitochondria of yeast facilitates interorganelle transport of phospholipids through membrane contact. Eur J Biochem 1999; 264:545-53; PMID:10491102; http://dx.doi.org/10.1046/j.1432-1327.1999.00658.x
- Longatti A, Lamb CA, Razi M, Yoshimura S, Barr FA, Tooze SA. TBC1D14 regulates autophagosome formation via Rab11- and ULK1-positive recycling endosomes. J Cell Biol 2012; 197:659-75; PMID:22613832; http://dx.doi.org/10.1083/jcb.201111079
- Horl G, Wagner A, Cole LK, Malli R, Reicher H, Kotzbeck P, Kofeler H, Hofler G, Frank S, Bogner-Strauss JG, et al. Sequential synthesis and methylation of phosphatidylethanolamine promote lipid droplet biosynthesis and stability in tissue culture and in vivo. J Biol Chem 2011; 286:17338-50; PMID:21454708; http://dx.doi.org/10.1074/jbc.M111.234534
- Vance JE. The use of newly synthesized phospholipids for assembly into secreted hepatic lipoproteins. Biochim Biophys Acta 1989; 1006:59-69; PMID:2508747
- Girardi JP, Pereira L, Bakovic M. De novo synthesis of phospholipids is coupled with autophagosome formation. Med Hypotheses 2011; 77:1083-7; PMID:21963355; http://dx.doi.org/10.1016/j.mehy.2011.09.008
- Gaspar ML, Jesch SA, Viswanatha R, Antosh AL, Brown WJ, Kohlwein SD, Henry SA. A block in endoplasmic reticulum-to-Golgi trafficking inhibits phospholipid synthesis and induces neutral lipid accumulation. J Biol Chem 2008; 283:25735-51; PMID:18614533; http://dx.doi.org/10.1074/jbc.M802685200
- Zoppino FC, Militello RD, Slavin I, Alvarez C, Colombo MI. Autophagosome formation depends on the small GTPase Rab1 and functional ER exit sites. Traffic 2010; 11:1246-61; PMID:20545908; http://dx.doi.org/10.1111/j.1600-0854.2010.01086.x
- Zeuschner D, Geerts WJ, van Donselaar E, Humbel BM, Slot JW, Koster AJ, Klumperman J. Immuno-electron tomography of ER exit sites reveals the existence of free COPII-coated transport carriers. Nat Cell Biol 2006; 8:377-83; PMID:16531996; http://dx.doi.org/10.1038/ncb1371
- Novikoff AB, Shin WY. Endoplasmic reticulum and autophagy in rat hepatocytes. Proc Natl Acad Sci U S A 1978; 75:5039-42; PMID:283412; http://dx.doi.org/10.1073/pnas.75.10.5039
- Seglen PO. Regulation of autophagic protein degradation in isolated liver cells. In: Glaumann H, Ballard FJ, editors. Lysosomes: their role in protein breakdown. London Academic Press, 1987, pp. 371-414
- Knaevelsrud H, Carlsson SR, Simonsen A. SNX18 tubulates recycling endosomes for autophagosome biogenesis. Autophagy 2013; 9:1639-41; PMID:24113029
- Puri C, Renna M, Bento CF, Moreau K, Rubinsztein DC. ATG16L1 meets ATG9 in recycling endosomes: Additional roles for the plasma membrane and endocytosis in autophagosome biogenesis. Autophagy 2013; 10:182-4; PMID:24257061
- Cook KL, Soto-Pantoja DR, Abu-Asab M, Clarke PA, Roberts DD, Clarke R. Mitochondria directly donate their membrane to form autophagosomes during a novel mechanism of parkin-associated mitophagy. Cell Biosci 2014; 4:16; PMID:24669863; http://dx.doi.org/10.1186/2045-3701-4-16
- Ding WX, Li M, Biazik JM, Morgan DG, Guo F, Ni HM, Goheen M, Eskelinen EL, Yin XM. Electron microscopic analysis of a spherical mitochondrial structure. J Biol Chem 2012; 287:42373-8; PMID:23093403; http://dx.doi.org/10.1074/jbc.M112.413674
- Rowland AA, Voeltz GK. Endoplasmic reticulum-mitochondria contacts: function of the junction. Nat Rev Mol Cell Biol 2012; 13:607-25; PMID:22992592; http://dx.doi.org/10.1038/nrm3440
- Bozidis P, Williamson CD, Colberg-Poley AM. Mitochondrial and secretory human cytomegalovirus UL37 proteins traffic into mitochondrion-associated membranes of human cells. J Virol 2008; 82:2715-26; PMID:18199645; http://dx.doi.org/10.1128/JVI.02456-07
- Marsh BJ, Mastronarde DN, Buttle KF, Howell KE, McIntosh JR. Organellar relationships in the Golgi region of the pancreatic beta cell line, HIT-T15, visualized by high resolution electron tomography. Proc Natl Acad Sci U S A 2001; 98:2399-406; PMID:11226251; http://dx.doi.org/10.1073/pnas.051631998
- Kornmann B, Currie E, Collins SR, Schuldiner M, Nunnari J, Weissman JS, Walter P. An ER-mitochondria tethering complex revealed by a synthetic biology screen. Science 2009; 325:477-81; PMID:19556461; http://dx.doi.org/10.1126/science.1175088
- Kim S, Naylor SA, DiAntonio A. Drosophila Golgi membrane protein Ema promotes autophagosomal growth and function. Proc Natl Acad Sci U S A 2012; 109:E1072-81; PMID:22493244; http://dx.doi.org/10.1073/pnas.1120320109
- Germain M, Nguyen AP, Le Grand JN, Arbour N, Vanderluit JL, Park DS, Opferman JT, Slack RS. MCL-1 is a stress sensor that regulates autophagy in a developmentally regulated manner. EMBO J 2011; 30:395-407; PMID:21139567; http://dx.doi.org/10.1038/emboj.2010.327
- Takahashi Y, Meyerkord CL, Hori T, Runkle K, Fox TE, Kester M, Loughran TP, Wang HG. Bif-1 regulates Atg9 trafficking by mediating the fission of Golgi membranes during autophagy. Autophagy 2011; 7:61-73; PMID:21068542; http://dx.doi.org/10.4161/auto.7.1.14015
- Mari M, Griffith J, Rieter E, Krishnappa L, Klionsky DJ, Reggiori F. An Atg9-containing compartment that functions in the early steps of autophagosome biogenesis. J Cell Biol 2010; 190:1005-22; PMID:20855505; http://dx.doi.org/10.1083/jcb.200912089
- Yamamoto H, Kakuta S, Watanabe TM, Kitamura A, Sekito T, Kondo-Kakuta C, Ichikawa R, Kinjo M, Ohsumi Y. Atg9 vesicles are an important membrane source during early steps of autophagosome formation. J Cell Biol 2012; 198:219-33; PMID:22826123; http://dx.doi.org/10.1083/jcb.201202061
- Guo Y, Chang C, Huang R, Liu B, Bao L, Liu W. AP1 is essential for generation of autophagosomes from the trans-Golgi network. J Cell Sci 2012; 125:1706-15; PMID:22328508; http://dx.doi.org/10.1242/jcs.093203
- Young AR, Chan EY, Hu XW, Kochl R, Crawshaw SG, High S, Hailey DW, Lippincott-Schwartz J, Tooze SA. Starvation and ULK1-dependent cycling of mammalian Atg9 between the TGN and endosomes. J Cell Sci 2006; 119:3888-900; PMID:16940348; http://dx.doi.org/10.1242/jcs.03172
- Moreau K, Renna M, Rubinsztein DC. Connections between SNAREs and autophagy. Trends Biochem Sci 2013; 38:57-63; PMID:23306003; http://dx.doi.org/10.1016/j.tibs.2012.11.004
- Lev S. Nonvesicular lipid transfer from the endoplasmic reticulum. Cold Spring Harb Perspect Biol 2012; 4:a013300; PMID:23028121
- Lev S. Non-vesicular lipid transport by lipid-transfer proteins and beyond. Nat Rev Mol Cell Biol 2010; 11:739-50; PMID:20823909; http://dx.doi.org/10.1038/nrm2971
- Perkins G, Renken C, Martone ME, Young SJ, Ellisman M, Frey T. Electron tomography of neuronal mitochondria: three-dimensional structure and organization of cristae and membrane contacts. J Struct Biol 1997; 119:260-72; PMID:9245766; http://dx.doi.org/10.1006/jsbi.1997.3885
- Sleight RG. Intracellular lipid transport in eukaryotes. Annu Rev Physiol 1987; 49:193-208; PMID:3551798
- Kawano M, Kumagai K, Nishijima M, Hanada K. Efficient trafficking of ceramide from the endoplasmic reticulum to the Golgi apparatus requires a VAMP-associated protein-interacting FFAT motif of CERT. J Biol Chem 2006; 281:30279-88; PMID:16895911; http://dx.doi.org/10.1074/jbc.M605032200
- Starborg T, Kalson NS, Lu Y, Mironov A, Cootes TF, Holmes DF, Kadler KE. Using transmission electron microscopy and 3View to determine collagen fibril size and three-dimensional organization. Nat Protoc 2013; 8:1433-48; PMID:23807286; http://dx.doi.org/10.1038/nprot.2013.086
- Yla-Anttila P, Vihinen H, Jokitalo E, Eskelinen EL. Monitoring autophagy by electron microscopy in Mammalian cells. Methods Enzymol 2009b; 452:143-64; PMID:19200881; http://dx.doi.org/10.1016/S0076-6879(08)03610-0
- Mastronarde DN. Automated electron microscope tomography using robust prediction of specimen movements. J Struct Biol 2005; 152:36-51; PMID:16182563
- Kremer JR, Mastronarde DN, McIntosh JR. Computer visualization of three-dimensional image data using IMOD. J Struct Biol 1996; 116:71-6; PMID:8742726; http://dx.doi.org/10.1006/jsbi.1996.0013