
Abstract
The lack of a rapid and quantitative autophagy assay has substantially hindered the development and implementation of autophagy-targeting therapies for a variety of human diseases. To address this critical issue, we developed a novel autophagy assay using the newly developed Cyto-ID fluorescence dye. We first verified that the Cyto-ID dye specifically labels autophagic compartments with minimal staining of lysosomes and endosomes. We then developed a new Cyto-ID fluorescence spectrophotometric assay that makes it possible to estimate autophagy flux based on measurements of the Cyto-ID-stained autophagic compartments. By comparing to traditional autophagy approaches, we found that this assay yielded a more sensitive, yet less variable, quantification of the stained autophagic compartments and the estimate of autophagy flux. Furthermore, we tested the potential application of this autophagy assay in high throughput research by integrating it into an RNA interference (RNAi) screen and a small molecule screen. The RNAi screen revealed WNK2 and MAP3K6 as autophagy-modulating genes, both of which inhibited the MTOR pathway. Similarly, the small molecule screen identified sanguinarine and actinomycin D as potent autophagy inducers in leukemic cells. Moreover, we successfully detected autophagy responses to kinase inhibitors and chloroquine in normal or leukemic mice using this assay. Collectively, this new Cyto-ID fluorescence spectrophotometric assay provides a rapid, reliable quantification of autophagic compartments and estimation of autophagy flux with potential applications in developing autophagy-related therapies and as a test to monitor autophagy responses in patients being treated with autophagy-modulating drugs.
Abbreviations:
- 3-MA, 3-methyladenine
- FBS, fetal bovine serum
- GFP, green fluorescent protein
- LAMP1, lysosomal-associated membrane protein 1
- MAP1LC3B/LC3B, microtubule-associated protein 1 light chain 3 beta
- MAP3K6, mitogen-activated protein kinase kinase kinase 6
- MDC, monodansylcadaverine
- mRFP, monomeric red fluorescent protein
- MTOR, mechanistic target of rapamycin
- NS, nonsilencing
- RAB5A, member RAS oncogene family
- RNAi, RNA interference
- shRNA, short-hairpin RNA
- SQSTM1, sequestosome 1
- WNK2, WNK lysine deficient protein kinase 2
Introduction
Under stress conditions such as nutrient deficiency or drug treatments, cells often undergo macroautophagy (referred to as autophagy hereafter), a process involving the genesis of various subcellular compartments such as autophagosomes and autolysosomes. The cellular components that are engulfed in these vesicles are eventually degraded in autolysosomes.Citation1 Such “self-digestion” usually provides cells with more nutrients for continuous survival; however, excessive digestion also results in cell death. Given its essential role in cell survival and death, deregulated autophagy is often central to the pathogenesis of many human diseases such as neurodegenerative diseases, cancer, infectious diseases, heart failure, and diabetes, to name a few.Citation2,3 And as such, it has been widely used as a target for therapeutic intervention. Nevertheless, the lack of an accurate and quantitative approach to measure autophagy has significantly discouraged such effort. For example, hydroxychloroquineCitation4 and everolimusCitation5 that target autophagy pathways were used in the clinic to treat cancer patients. The efficacy was encouraging but unexpectedly low. Many compounds have been found to control autophagy in cultured cells or even animals but their further application in clinic is limited.Citation2 One of the major reasons is that the diagnostic tools monitoring autophagy and hence allowing for dose adjustment in clinical treatment are lacking.
To date, many autophagy-detecting approaches have been devised; only a few of them are suitable for quantitative and high throughput analyses, yet are still inaccurate and labor-intensive.Citation6,7 For instance, LC3B (microtubule-associated protein 1 light chain 3 beta) serves as a specific marker for autophagosomes because the protein level of LC3B-II, the cleaved and lipidated form that is conjugated with phosphatidylethanolamine and subsequently incorporated onto the autophagosome membrane, positively correlates to autophagosome production.Citation8 However, such correlation is generally—but not always—found in most experimental settings.Citation6 In addition, quantification of LC3B-II protein requires a comparison to housekeeping genes such as actin, the expression level of which is sometimes subject to change during autophagy.Citation7 LC3B conjugated with green fluorescent protein (GFP) is also frequently used in fluorescence microscopy. The pitfall for this approach is that ectopically expressed GFP-LC3B often forms aggregates that are difficult to distinguish from the GFP-LC3B puncta, the characteristic subcellular structures that refer to autophagosomes under a fluorescence microscope.Citation9 Electron microscopy, the most conventional—-yet still a standard—-method in detecting autophagy, acquires images of early or late autophagic compartments in cells but often fails to provide quantitative data and is infeasible for clinical application.Citation7 Other approaches such as staining using acidotropic fluorescent dyes or analyzing autophagy substrate degradation also have obvious caveats and low specificity, limiting their application in quantifying autophagy.Citation6,7 Taken together, there is an unmet and increasing need for developing novel approaches that accurately and rapidly quantify autophagy.
Cyto-ID, a recently developed cationic amphilic tracer dye, labels autophagic compartments with minimal staining of lysosomes,Citation10,11 suggesting that it is a specific autophagy marker. Here we took advantage of this fluorescent dye and developed a Cyto-ID-based fluorescence spectrophotometric assay (abbreviated as the Cyto-ID assay) that permits high content performance and measures the size of autophagic compartments which makes it possible to monitor autophagy flux. Compared to other traditional autophagy-detecting approaches, this assay is considerably more sensitive, reliable, and timesaving thereby providing a platform for drug screening and has a potential clinical application as a diagnostic tool to gauge autophagy responses in patients.
Results
The Cyto-ID dye specifically labels autophagic compartments
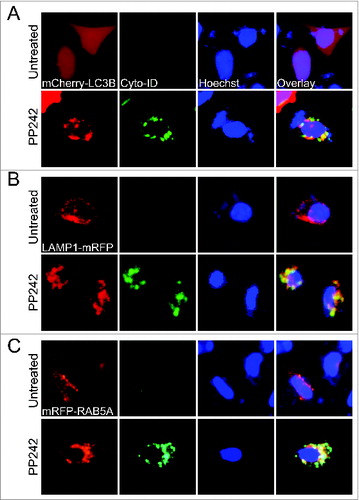
Previous reports showed that Cyto-ID stains autophagic cells through labeling autophagic compartments.Citation10,11 During autophagy, autophagosomes also fuse with endosomes to establish another intermediate—amphisomes—before fusion with lysosomes.Citation1 Thus, to validate that Cyto-ID marks most autophagic compartments including amphisomes and autolysosomes, we transfected HeLa (human cervical cancer) cells with plasmids encoding mCherry-LC3B (a phagophore, autophagosome or amphisome marker), LAMP1-RFP (a lysosome marker),Citation12 or mRFP-RAB5A (an endosome marker)Citation13 and then monitored the colocalization of Cyto-ID with these fluorescent proteins. In untreated HeLa cells (, top panels), mCherry-LC3B was distributed evenly in cells, whereas LAMP1-mRFP or mRFP-RAB5A aggregated as small dots representing lysosomes or endosomes. By contrast, no or very weak Cyto-ID fluorescence was detected in these nonautophagic cells indicating that Cyto-ID has minimal staining of lysosomes or endosomes. However, Cyto-ID formed puncta (a characteristic of autophagic vesicles) and partially colocalized with mCherry-LC3B, LAMP1-RFP, or mRFP-RAB5A in HeLa cells treated with PP242, a selective inhibitor of MTOR (mechanistic target of rapamycin) that induces autophagyCitation14 (, bottom panel). These data indicate that Cyto-ID labels autophagic compartments such as amphisomes or autolysosomes.
Figure 1. The Cyto-ID dye specifically labeled autophagic compartments with minimal staining of lysosomes and endosomes. Colocalization of the Cyto-ID fluorescence dye, Hoechst 33342, and mCherry-LC3B (A), LAMP1-mRFP (B), or mRFP-RAB5A (C) in HeLa cells treated without or with 10 μM PP242 for 4 h.
The Cyto-ID dye, but not EGFP-LC3, is suitable for spectrophotometry
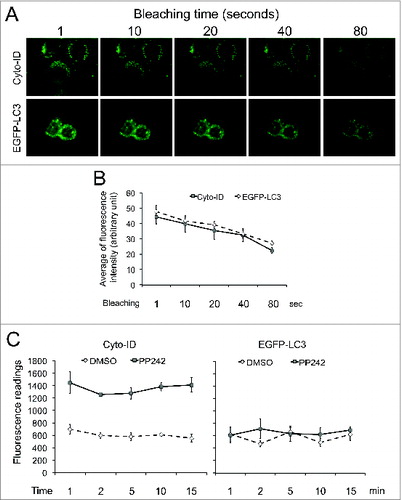
Similar to other fluorescent dyes, the Cyto-ID is sensitive to light.Citation10 To compare the light sensitivity of Cyto-ID to EGFP-LC3 (a widely used autophagy marker), we imaged autophagic HeLa cells using the Cyto-ID or EGFP-LC3 at different bleaching times. We found that the sensitivity of Cyto-ID to the light was equivalent to that of EGFP-LC3 (). To further determine the stability of Cyto-ID in spectrophotometry, we compared HeLa cells stained with Cyto-ID with those stably expressing EGFP-LC3 using a FilterMax F3 microplate reader. The fluorescence intensities of Cyto-ID remained unchanged in DMSO and PP242-treated cells at least 15 min after staining (, right panel) and so did the intensities of EGFP-LC3 (, left panel). However, the Cyto-ID, but not EGFP-LC3, was dramatically increased in PP242-treated cells compared to their respective controls indicating that the Cyto-ID dye is more suitable than EGFP-LC3 for autophagy assay using spectrophotometry.
Figure 2. The Cyto-ID dye but not EGFP-LC3 was suitable for spectrophotometry. (A) Light sensitivity of the Cyto-ID dye or EGFP-LC3. HeLa cells transfected with or without EGFP-LC3 were treated with 10 μM PP242 for 4 h. HeLa cells with no EGFP-LC3 were further stained with the Cyto-ID. Images at the same field were taken at different time points (1 to 80 sec) after exposing cells to the light. (B) Quantification of fluorescent dots in images presented in A. The average intensities were obtained from 5 fluorescent dots and the error bars depicts means ± s.d. (C) Fluorescence intensities of the Cyto-ID or EGFP-LC3 recorded by a spectrophotometer at various time points.
The Cyto-ID assay measures changes in the size of autophagic compartments induced by various autophagy activators
We next developed an expeditious Cyto-ID-based spectrophotometric assay (the Cyto-ID assay) (). To minimize the effect of background Cyto-ID, we attempted to normalize the results from the Cyto-ID assay using relative cell densities measured by the MTS or CellTiter-Blue assay. We then measured Cyto-ID-positive autophagic compartments after induction by drugs or starvation in several cell lines using this assay. In K562 human leukemic cells treated with imatinib at the dose (2 μM) that has been shown to induce autophagy (detected by LC3B immunoblotting),Citation15 Cyto-ID fluorescence was increased by more than 3 fold (). In HEK293 (human embryonic kidney epithelial) or OVCAR8 (ovarian cancer epithelial) cells, PP242 treatment induced a 2- or 4-fold increase of Cyto-ID fluorescence, respectively, (). In K562 or HEK293 cells treated with nutrient deprivation, Cyto-ID fluorescence was increased by 2- or 4-fold, respectively (). To further validate that the elevated level of Cyto-ID fluorescence refers to autophagy induction, we treated cells with 3-methyladenine (3-MA), an inhibitor of autophagic sequestration.Citation15 As expected, 3-MA blocked the induction of Cyto-ID fluorescence in K562 treated with imatinib () and HEK293 or OVCAR8 cells treated with PP242 (). Together these results demonstrate that the Cyto-ID assay quantitatively monitors the changes in the size of autophagic compartments induced by various autophagy activators in both normal and malignant cells.
Figure 3. The Cyto-ID assay quantitatively measured the size of autophagic compartments. (A) A schematic outline of the Cyto-ID-based fluorescence spectrophotometric assay. (B) Imatinib-induced autophagy. K562 cells were treated with 1 or 2 μM imatinib for 16 h. (C) PP242-induced autophagy. HEK293 and OVCAR8 cells were treated with PP242 at 2 or 5 μM overnight, respectively. (D) Starvation-induced autophagy. K562 or HEK293 cells were incubated in Earle's Balanced Salt Solution for 30 min or 12 h, respectively. (E) Imatinib-induced autophagy affected by 3-MA. K562 cells were treated with 2 μM imatinib in the absence or presence of 10 mM 3-MA for 4 h. (F) PP242-induced autophagy affected by 3-MA. HEK293 or OVCAR8 cells were treated with 4 or 10 μM PP242, respectively, in the absence or presence of 10 mM 3-MA for 4 h. All experiments were repeated 3 times and error bars depict means ± s.d.; * P < 0.05.
The Cyto-ID assay provides an estimate of autophagy flux
Autophagy is a dynamic, multistep process including autophagosome formation, autolysosome formation, and degradation of autophagic substrate (often denoted as autophagy flux).Citation1 In fact, monitoring autophagy flux is the most relevant way for the estimation of autophagic activity.Citation6,7 The commonly used assay for monitoring autophagy flux is the turnover of LC3B or SQSTM1/p62 using immunoblotting, which measures the content through autophagy flux; however, this approach is time-consuming and the results are often varied in different experimental settings and hard to interpret. Thus we tested whether the Cyto-ID assay provides a rapid analysis of autophagy flux, because the quantity of autophagic compartments usually correlates with the level of autophagy flux.
We first monitored the dynamic change of autophagy flux in K562 cells. The activated autophagy flux is characterized by the increased amount of autophagic compartments and the reinforced degradation of autophagic cargos and their receptors such as SQSTM1.Citation7 As shown in , the levels of Cyto-ID and LC3B-II increased in K562 cells treated with imatinib over time, coinciding with the decreased level of SQSTM1. We then estimated the impaired autophagy flux by monitoring the accumulation of autophagic compartments induced by chloroquine, a lysosome inhibitor that impedes the fusion of autophagosomes and lysosomes and/or the activity of autolysosomes.Citation16 As expected, chloroquine increased the level of Cyto-ID fluorescence by a factor of approximately 2.5-fold in all the cells tested (). To further monitor the dynamic change of impaired autophagy flux, we treated K562 cells with chloroquine at different time points. The Cyto-ID fluorescence () or LC3B-II level () increased over time. Although we expected an increase of SQSTM1 due to the impaired autophagy flux, we found that the SQSTM1 protein level remained relatively unchanged (). Taken together, our data demonstrates that the Cyto-ID assay provides a fast analysis that estimates autophagy flux.
Figure 4. The Cyto-ID assay estimated autophagy flux. (A) Imatinib-induced autophagy flux at different time points measured by the Cyto-ID assay. (B) Imatinib-induced autophagy flux at different time points measured by the LC3B or SQSTM1 immunoblotting assay. (C) Chloroquine-blocked autophagy flux at steady state. The chloroquine treatments were 5 μM in HEK293 for 4 h, 20 μM in OVCAR8 for 4 h, or 20 μM in K562 for 4 h, respectively. (D) Chloroquine-blocked autophagy flux at different time points analyzed by the Cyto-ID assay. (E) Chloroquine-blocked autophagy flux at different time points analyzed by the LC3B or SQSTM1 immunoblotting assay. All experiments were repeated 3 times and error bars depict means ± s.d. *P < 0.05.
The Cyto-ID assay determines the status of autophagy flux
Monitoring autophagy flux is difficult because the increase of autophagic compartments at a steady state during activated autophagy is often indistinguishable from the accumulation of autophagic compartments resulting from impaired autophagy flux.Citation6,7 We then sought to determine whether the Cyto-ID assay could be used as a surrogate of the LC3B immunoblotting assay to distinguish activated autophagy from impaired autophagy flux. To test this hypothesis, we treated K562, HEK293, and OVCAR8 cells with imatinib (or PP242) and chloroquine. In principle, imatinib or PP242 (that activates the formation of autophagic vesicles), when combined with chloroquine (that leads to the accumulation of autophagosomes and/or autolysosomes), would substantially increase the levels of autophagic compartments. In order to minimize the cell damage caused by the conjunctive treatment, we intentionally used the low doses of imatinib, PP242, or chloroquine that failed to significantly induce Cyto-ID fluorescence (). As expected, the combination of imatinib and chloroquine, but not each treatment alone, induced a 2.5-fold increase of the Cyto-ID fluorescence in K562 cells (). Similar results were obtained in HEK293 and OVCAR8 cells (). The synergistic effect was confirmed in K562 cells treated with a combination of imatinib and chloroquine when using the LC3B immunoblotting assay (). However, LC3B-II level was not significantly enhanced in HEK293 and OVCAR8 cells treated with PP242 and chloroquine (), suggesting that the LC3B immunoblotting assay might not be suitable for assessing autophagy flux in these cells. Thus, the Cyto-ID assay can be used to determine whether autophagy flux is activated or impaired.
Figure 5. The Cyto-ID assay determined the status of autophagy flux. (A) Autophagy flux affected by imatinib and chloroquine. K562 cells were treated with 1 μM imatinib and/or 2.5 μM chloroquine for 6 h. (B) Autophagy flux assessed by the LC3B immunoblotting assay. (C) Autophagy flux affected by PP242 and chloroquine. HEK293 cells were treated with 1 μM PP242 together with 0.5 μM chloroquine for 1 h. OVCAR8 cells were treated with 2 μM PP242 and 0.25 μM chloroquine for 1 h. (D) Autophagy flux assessed by the LC3B immunoblotting assay. All experiments were repeated 3 times and error bars depict means ± s.d.; * P < 0.05.
The Cyto-ID assay yields a more sensitive, yet less variable, analysis for autophagy
We next sought to determine the sensitivity of the Cyto-ID assay by comparing it with other conventional approaches that detect autophagy. We first compared Cyto-ID with monodansylcadaverine (MDC). Similar to other acidotropic fluorescence dyes such as acridine orange or LysoTracker Red, MDC preferentially labels lysosomes and acidic compartments formed during autophagy thereby nonspecifically stains autophagic cells.Citation17 As MDC fluorescence is measureable in a microplate reader, we compared the Cyto-ID- with the MDC-based spectrophotometric assay. Previous studies have shown that MDC has a confounding background staining of lysosomes.Citation18 Our results shown in together with other studiesCitation10,11 demonstrated that staining of lysosomes or endosomes by Cyto-ID is minimal and negligible. We therefore first compared the background levels of these 2 dyes in nonautophagic K562 cells. The MDC fluorescence level was nearly 20-fold higher than that of Cyto-ID (), as expected. We then asked whether the Cyto-ID-based spectrophotometric assay is more sensitive than the MDC-based assay. The Cyto-ID assay detected an approximately 5-fold increase of Cyto-ID fluorescence when K562 cells were treated with imatinib, whereas the same treatment increased the intensity of MDC fluorescence by only 2.3-fold (). Furthermore, the MDC assay failed to detect the accumulation of autophagosomes in K562 cells treated with chloroquine (). Collectively, these results indicate that Cyto-ID is a more specific and highly sensitive autophagy fluorescence marker.
Figure 6. The Cyto-ID was more sensitive than MDC in quantifying autophagic compartments. (A) Background levels of the Cyto-ID or MDC fluorescence in nonautophagic K562 cells. (B) Imatinib-induced autophagy. K562 cells were treated with 1 μM imatinib for 16 h and autophagy was assayed by the Cyto-ID- or MDC-based spectrophotometric assay. (c) Chloroquine-blocked autophagy flux in K562 cells.
The most widely used approaches in autophagy research are those using LC3B as an autophagy marker due to its specificity in labeling autophagosomes. Nonetheless, its sensitivity varies depending upon cell type, cellular context, or treatments that induce autophagy.Citation6,7 Hence, to compare Cyto-ID with LC3B, we treated HEK293 or OVCAR8 cells with PP242 at various time points and measured autophagic compartments using either the Cyto-ID assay or LC3B immunoblotting. We found that both assays detected a significant induction of autophagy within 2 h as indicated by a more than 2-fold increase of Cyto-ID fluorescence () or LC3B-II () in HEK293 and OVCAR8 cells. Surprisingly, after HEK293 and OVCAR8 cells were treated with PP242 for 4 h, the LC3B-II protein level dropped remarkably (). In contrast, an exponential increase of Cyto-ID fluorescence was detected throughout the entire time course in both cell lines (). In K562 cells treated with imatinib, a time-dependent linear increase of the Cyto-ID fluorescence was detected (). However, LC3B protein levels (detected by the LC3B immunoblotting assay) increased modestly in K562 cells with the same treatment (). These data suggest that the Cyto-ID assay is equally sensitive to the LC3B immunoblotting assay, yet it is more stable.
Figure 7. The Cyto-ID assay yielded a more reliable quantification of autophagic compartments. (A) PP242-induced autophagy at different time points assessed by the Cyto-ID assay. HEK293 or OVCAR8 cells were treated with PP242 (4 or 10 μM, respectively) at the indicated time points. (B) PP242-induced autophagy at different time points analyzed by the LC3B immunoblotting assay. All experiments were repeated 3 times and error bars depict means ± s.d.
Taken together, our results show that the Cyto-ID assay yields a more sensitive and reliable quantification of autophagic compartments and is therefore better than the conventional autophagy detecting approaches.
The Cyto-ID assay has a broad spectrum of applications in basic research and clinical diagnosis
Since the Cyto-ID assay is timesaving and allows a robust and accurate quantification for monitoring autophagy and estimating autophagy flux, we probed possible applications of this assay in basic science research e.g. screening drug targets or identifying small molecule inhibitors that target autophagy. We tested the Cyto-ID assay in 2 high-throughput screens. First, we integrated the Cyto-ID assay with a short hairpin RNA (shRNA)-based RNA interference (RNAi) screen; 88 shRNAs against 28 human kinase genes were introduced into K562 cells via viral transduction. The subsequent analysis using the Cyto-ID assay revealed that 4 shRNAs (directed against ANK1, NTRK3, WNK2, or MAP3K6) enhanced the Cyto-ID fluorescence by more than 2-fold (). Among the 4 candidates, MAP3K6 and WNK2 were further validated by a significant increase of LC3B-II using LC3B immunoblotting assay () and an efficient knockdown of the target genes (). To further determine the stage of autophagy that these 2 kinases target, we treated K562 cells with a combination of chloroquine and shRNAs against WNK2 or MAP3K6. The combinations substantially increased the Cyto-ID fluorescence compared to each treatment alone () suggesting that these 2 kinases target the initiation rather than maturation stage. Moreover, our work further showed that these 2 kinases suppressed autophagy by activating MTOR as knocking them down remarkably repressed both activity and expression of MTOR (). Of note, WNK2 has previously been identified as an autophagy modulator from another RNAi screen.Citation19
Figure 8. An RNAi screen identified MAP3K6 and WNK2 as autophagy-modulating genes. (A) An RNAi screen. K562 cells were transduced with the viruses of nonsilencing (NS) shRNA or 88 individual shRNAs of human kinases. The line represents the cut-off (2-fold increase). (B) Validation using the LC3B immunoblotting assay. K562 cells were transduced with the viruses harboring nonsilencing (NS) or candidate shRNAs. (C) Knockdown of each candidate gene. The mRNA levels of candidate genes were measured using qRT-PCR. (D) Autophagy flux affected by candidate shRNAs and chloroquine. K562 cells with NS or candidate shRNAs were treated with or without 2.5 μM chloroquine for 4 h. (E) MTOR pathway affected by shRNAs against MAP3K6 or WNK2. All experiments were repeated 3 times and error bars depict means ± s.d.; *P < 0.05.
We next applied the Cyto-ID assay in a small molecule screen to identify drugs that potently modulate autophagy. We first selected the concentrations of chemical compounds and treatment duration based on PP242-induced autophagy. By virtue of its strong capability to induce autophagy, we hypothesized that any drugs or chemicals that are stronger than PP242 should be regarded as potent autophagy modulators. In K562 cells, 10 μM PP242 increased the Cyto-ID fluorescence by 1.5-fold within 4 h (); this setting was then used to screen 80 chemical compounds composed of FDA-approved drugs or bioactive natural products. Due to the auto green fluorescence, we excluded fluorescein from this library albeit it showed positive results. The Cyto-ID analysis showed that 2 compounds (sanguinarine and actinomycin D) led to a > 2-fold increase of Cyto-ID fluorescence (). Our validation experiments showed that actinomycin D or sanguinarine enhanced the Cyto-ID fluorescence in a dose-dependent manner (). Furthermore, combinations of these 2 chemical compounds with chloroquine showed significant elevation of the Cyto-ID fluorescence compared to each treatment alone (). Thus, we validated that actinomycin D and sanguinarine are potent autophagy inducers. Notably, actinomycin D is known to be a potent autophagy modulator.Citation20 Collectively, our results demonstrate that the Cyto-ID assay is suitable for high content screening to identify new genes or chemical compounds that modulate autophagy.
Figure 9. A small molecule screen identified actinomycin D and sanguinarine as autophagy modulators. (A) PP242-induced autophagy in K562 cells. K562 cells were treated with 10 μM PP242 for 4 h. (B) A small molecule screen. K562 cells were added to a 96-well plate preloaded with either vehicle (DMSO) or 79 chemical compounds and then incubated for 4 h. The line represents the cut-off (2-fold increase). (C) Actinomycin D-induced autophagy in K562 cells. (D) Sanguinarine-induced autophagy in K562 cells. (E) Actinomycin D-affected autophagy flux in K562 cells. K562 cells were treated with a combination of 1 μM actinomycin D and 2.5 μM chloroquine for 4 h. (F) Sanguinarine-affected autophagy flux. K562 cells were treated with a combination of 2 μM sanguinarine and 2.5 μM chloroquine for 4 h. All experiments were repeated 3 times and error bars depict means ± s.d.; *P < 0.05.
As described earlier, autophagy is an appealing drug target for many different human diseases but current autophagy-related therapies yield unsatisfactory outcomes in clinic. One of the major hurdles appears to be the lack of accurate and quantitative approaches to monitor autophagy. We therefore explored the potential of this autophagy assay to be used clinically to monitor the effectiveness of autophagy–related therapies by testing it in normal mice or a mouse leukemia model. To monitor autophagy in primary peripheral blood cells, we treated mice with either PP242 or chloroquine by intraperitoneal injection and measured autophagy at different time points. Two out of 3 PP242 or chloroquine-treated mice showed a significant increase of Cyto-ID fluorescence 4 h after drug administration. In contrast, no induction was observed in the untreated mice (). However, we noticed different drug responses among mice and at various time points in the same mouse, further demonstrating the necessity to monitor autophagy therapies in the clinic. To mimic clinical application, we generated leukemic mice and then treated them with either imatinib or chloroquine. In mice bearing BCR-ABL-driven leukemia, we found that both imatinib and chloroquine significantly increased the level of Cyto-ID fluorescence in mouse primary bone marrow cells (). Taken together, our results demonstrate that the Cyto-ID assay can be extremely valuable as a diagnostic tool to monitor dose responses of autophagy-related therapies in the clinic.
Figure 10. Detection of autophagy in mice. (A) PP242 or chloroquine-mediated autophagy in mouse primary peripheral blood cells. Mice were treated with PP242 (60 mg/kg/d, IP) or chloroquine (50 mg/kg/d, IP). (B) Imatinib or chloroquine-affected autophagy in primary bone marrow cells isolated from the mice with BCR-ABL-driven leukemia. Leukemic mice were treated with either imatinib (100 mg/kg/d) or chloroquine (50 mg/kg/every other day) by gavage. There are 3 or 4 mice per treatment group and error bars depict means ± s.d.; * P < 0.05.
Discussion
The caveats in current autophagy-detecting approaches (reviewed in refs. 6 and 7) make it difficult to quantitatively monitor autophagy or autophagy flux. Here we described a Cyto-ID-based fluorescence spectrophotometric assay that measures changes in the size of autophagic compartments rapidly and accurately. This assay also provides an estimate of autophagy flux and helps determine the status of autophagy flux at a steady state. The advantages of this assay are as follows: 1) the Cyto-ID fluorescence dye, unlike other dyes used in autophagy assays, specifically marks autophagic compartments with minimal staining of lysosomes or endosomes () and thereby has much lower background staining in nonautophagic cells (); 2) the Cyto-ID is a more appropriate fluorescent dye for spectrophotometry than GFP-LC3 (); 3) the Cyto-ID assay is more sensitive and reliable than the MDC spectrophotometric assay () or LC3B immunoblotting assay (); 4) the Cyto-ID assay rapidly monitors autophagy flux (); 5) the Cyto-ID assay can be used as a surrogate for LC3B immunoblotting assay to distinguish activated and impaired autophagy flux at a steady state ()
LC3B is a well-established autophagy marker and widely used in monitoring autophagy. However, we found that Cyto-ID provides a more reliable detection of changes in autophagic activity than LC3B. One pitfall of the LC3B-based assays is that they measure autophagosome only, whereas the Cyto-ID dye labels most autophagic compartments (). Another problem with LC3B immunoblotting is that the LC3B-II protein level might not be as stable as we expected. Results shown in suggested that LC3B-II protein is not stable 4 h after PP242 treatment. Moreover, the Cyto-ID assay, unlike LC3B-based assays, provides precise numeric readouts that correlate with the formation of autophagic compartments, and therefore, it is perhaps the most accurate quantitative assay among all autophagy assays developed so far.
Autophagy flux is a dynamic process that is difficult to be quantitatively monitored. Current approaches such as monitoring the turnover of LC3 or SQSTM1 or other autophagy cargo receptors using immunoblotting are time-consuming, not quantitative, and hard to interpret.Citation7 Although the band intensity of these proteins can be measured using image software, the pixel limit of these immunoblots often provides inaccurate quantification. While the degradation of autophagic cargos or cargo receptors presents direct evidence of autophagy flux, the quantity of autophagic compartments also correlates with the status of autophagy flux (activated or impaired). We found that the Cyto-ID assay measured the quantities of autophagic compartments at different time points during activated or impaired autophagy flux with no limitations (, and). Thus, this assay yields a fast and quantitative estimate of autophagy flux. Furthermore, similar to the LC3B immunoblotting assay that is frequently used in determining the activated or impaired autophagy flux, the Cyto-ID assay can be used as an improved surrogate for this purpose as it is faster and simpler.
There are several high-throughput studies that have been reported recently.Citation19,21-27 In these studies, fluorescence microscopy using GFP-LC3 as a reporter was used as a standard approach to monitor autophagy. However, this approach demands a special fluorescence microscope that permits a high content analysis, and is time-consuming and expensive. In this report, we successfully integrated the Cyto-ID assay in an RNAi screen () and a small molecule screen () and identified autophagy-modulating genes or drugs, some of which have been revealed as autophagy regulators in previous reports.Citation19,20 Given that the Cyto-ID assay is rather simple and affordable, more researchers in different fields can easily access it for large-scale autophagy studies.
Monitoring autophagy-related therapies is also difficult in the clinic as many autophagy-detecting assays are time-consuming and/or expensive. Failure in measuring autophagy in clinical samples may result in the ineffectiveness of autophagy-related therapies. The Cyto-ID assay provides us an opportunity to circumvent such difficulty. We have shown that this assay measured the size of autophagic compartments and estimated autophagy flux in peripheral blood or bone marrow cells freshly isolated from normal or leukemic mice (). Since the Cyto-ID assay is rapid, quantitative, and inexpensive, we will further adapt this assay into a diagnostic tool and expect that this tool will be widely implemented into clinical treatments of diverse human diseases.
Materials and Methods
Materials
HeLa, HEK293, and K562 cells were purchased from the American Type Culture Collection (CCL2, CRL-1573, CCL-243). OVCAR8 cells were kindly provided by Dr. Michael Green at the University of Massachusetts Medical School. The Cyto-ID kit was purchased from Enzo Life Sciences (ENZ-51031-K200). The Cell-Titer 96® Aqueous One solution cell proliferation assay (MTS; G3580) and the CellTiter-Blue® Cell Viability Assay kits (G8080) were purchased from Promega. LC3B (2775), MTOR (2972), phospho-MTOR (2971), or ACTB/β-actin (A5441) antibody was purchased from Cell Signaling Technology or Sigma-Aldrich, respectively. SQSTM1/p62 (sc-28359) antibody was purchased from Santa Cruz Biotechnology, Inc. Plasmids mCherry-hLC3B-pcDNA3.1 (40827), LAMP1-RFP (1817), mRFP-RAB5A (14437), EGFP-LC3 (11546) were obtained from Addgene. PP242 (P0037), chloroquine (C6628) and MDC (30432) were purchased from Sigma-Aldrich. 3-methyladenine (3-MA; 189490) was purchased from EMD Millipore Corporation. Imatinib (I-5508) was purchased from LC Laboratories. Actinomycin D (11421) was purchased from Cayman Chemical Company. Sangunarine (310035) was purchased from Microsource Discovery Systems, Inc. The kinase shRNAs were purchased from Thermo Scientific (RHS4884). The chemical compounds for the small molecule screen was provided by the Virginia Tech Center for Drug Discovery (Blacksburg, VA).
Stock solutions were prepared as follows: imatinib (10 mM) was dissolved in either sterile water or DMSO; PP242 (20 mM) was dissolved in DMSO; chloroquine (10 mM) was dissolved in sterile water; 3-MA (50 mM) was dissolved in sterile water or RMPI 1640 (Life Technologies Corporation, 23400-021); actinomycin D (5 mM) or sanguinarine (10 mM) was dissolved in DMSO.
Cell culture
HeLa and HEK293 cells were maintained in Dulbecco's modified Eagle's medium (Life Technologies Corporation, 12800-017) supplemented with 10% fetal bovine serum (FBS) (Atlas Biologicals, Inc., F-0500-A), streptomycin (100 μg/ml) and penicillin (100 IU/ml). OVCAR8 and K562 cells were maintained in RPMI 1640 media (Life Technologies Corporation, 23400-021) supplemented with 10% FBS, streptomycin (100 μg/ml) and penicillin (100 IU/ml).
Autophagy induction and autophagy flux inhibition
To induce autophagy, HeLa, HEK293, and OVCAR8 cells were treated with PP242 (2 to 20 μM) for 0 to 24 h. K562 cells were incubated with imatinib (either 1 or 2 μM) or PP242 (10 μM) for 0 to 22 h. To induce autophagy by starvation, K562 or HEK293 cells were washed 3 times with PBS (137 mM NaCl, 2.7 mM KCl, 10 mM Na2HPO4, 1.8 mM KH2PO4) and incubated in Earle's Balanced Salt Solution (Life Technologies Corporation, 14155063) for various time points. To block autophagy flux, cells were incubated with chloroquine (2.5 to 20 μM) for 0.5 to 6 h.
Fluorescence spectrophotometric assay
To stain cells with Cyto-ID or MDC, we followed the manufacturer's protocol with modifications. In brief, cells were first washed with PBS (supplemented with 5% FBS) and then mixed with either Cyto-ID or MDC staining solution. The cells were then incubated at 37°C for 30 min (Cyto-ID) or 10 min (MDC) in the dark, then washed twice with PBS (without FBS) to remove the free dyes. The cells were then divided: one half for the measurement of Cyto-ID fluorescence; the other half for the MTS cell viability assay described below. In some experiments, cells were transfected with pEGFP-LC3 and the fluorescence of EGFP-LC3 was recorded using the method described below. To use the CellTiter-Blue assay to measure cell viability, the reagent was directly added into the cells after the Cyto-ID or MDC assay without further dividing the cells. To measure the Cyto-ID or EGFP-LC3 fluorescence, cells were first plated in a black round-bottom 96-well plate (Fisher Scientific, 06-443-2) and incubated at room temperature for 5 to 20 min in the dark. The Cyto-ID or EGFP-LC3 green fluorescence was read using the FilterMax F3 microplate reader (at excitation 480 nm, emission 530 nm; Molecular Devices, Sunnyvale, CA). MDC was read at excitation 350 nm and emission 520 nm. Based on the manufacturer's datasheet, this microplate reader reads a 96-well plate in 18 sec (less than 0.2 sec per well). Such a short exposure minimizes the light bleaching. The relative Cyto-ID or MDC fluorescence is defined as the ratio of Cyto-ID or MDC readings to MTS readings or CellTiter-Blue readings (see below). The fold change of the Cyto-ID or MDC fluorescence was defined as the ratio of the relative Cyto-ID or MDC fluorescence in the treated cells to that in the control cells.
Cell viability assay
To minimize the difference of cell density among each sample, we determined the relative number of live cells using 2 cell viability assays: MTS or CellTiter-Blue. Cells with various treatments in 100 μl culture media were plated (5000 to 10000 cells per well) in a 96-well plate. Either MTS (10 μl) or CellTiter-Blue (10 μl) was added to each well, then incubated at 37°C for 1 h. The absorbance values of MTS (490 nm) or the fluorescence intensity of CellTiter-Blue (excitation 560 nm, emission 590 nm) was measured using the FilterMax F3 microplate reader according the manufacturer's instructions. These readings were used to normalize the Cyto-ID fluorescence of each corresponding sample.
Fluorescence microscopy and quantification of fluorescence
To label autophagic compartments or normal vesicular structures such as endosomes or lysosomes, plasmids that encode mCherry-LC3B, LAMP1-mRFP, or mRFP-RAB5A were transiently transfected into HeLa or HEK293 cells using Effectene Transfection Reagent (QIAGEN, 301427). After 24 h, HeLa cells were treated with either vehicle or PP242 (10 μM) for 4 h. The cells were then stained with Cyto-ID and Hoechst 33342 and visualized under an inverted fluorescence microscope (Carl Zeiss Microscopy, LLC, Thornwood, NY). Photomicrographs were taken using a 40x objective. In some experiments, HeLa cells were transfected with pEGFP-LC3 and then treated with PP242. GFP fluorescence was recorded as described above. To quantify the intensity of the Cyto-ID or EGFP-LC3 fluorescence, we used ImageJ software (http://imagej.nih.gov/ij/) and randomly quantified 5 fluorescent dots (representing the autophagic compartments) at different bleaching times. The average intensities were shown in .
Immunoblotting and quantification of band intensity.
Immunoblotting was performed as described in our previous reports.Citation28,29 In brief, cells were lysed and the total proteins were quantified using the Bradford assay (Bio-Rad, 500-0006). Equal amounts of total protein (25 μg) in each sample were loaded onto a 15% SDS-PAGE gel. After transferring, the blot was incubated with a rabbit anti-LC3B (1:1000), a rabbit anti-MTOR (1:1000), a rabbit anti-phospho-MTOR (1:1000), a mouse anti-SQSTM1/p62 (1:200), or a mouse HRP-conjugated anti-actin (1:30000) antibody. Images were taken using a ChemiDoc™ MP System (Bio-Rad, Hercules, CA). The intensity of the band was quantified using Image Lab software (Bio-Rad) or ImageJ as described earlier. The fold change of LC3B-II is defined as the ratio of the intensity of the LC3B-II band normalized to that of actin.
RNA interference screening
K562 cells (3.75 × 10³ cells per well) were plated in a 96-well plate. Viruses harboring 88 individual human kinase shRNAs or the control nonsilencing (NS) shRNA were added to each well. Cells were transduced by spin infection (900 x g for 90 min at 30°C). After 3 d incubation, the cells were subject to the Cyto-ID fluorescence spectrophotometric assay described above.
Quantitative RT-PCR
K562 cells (5 × 10⁴) were transduced with viruses containing NS or candidate shRNAs. Cells were selected by puromycin (1 μg/ml) for a week. Total RNA was extracted using Trizol (Ambion, Life TechnologiesTM, 11596018) and cDNA was synthesized using reverse transcriptase (New England Bio Labs, M0253L). mRNA levels of ANK1, MAP3K6, NTRK3, or ANK2 were determined by quantitative PCR using a StepOnePlusTM Real-Time PCR system (Life Technologies, Grand Island, NY). Primers for each gene were ANK1-f (5′ACGCAAGGTCCACACTCATTC3′), ANK1-r (5′ACAGACACCAGGACCTTCTCGTA3′), MAP3K6-f (5′CCGACATCATCATGAACTTGCT3′), MAP3K6-r (5′AGCTCAATGATGGCCGAGTAG3′), NTRK3-f (5′CTCAACGCCGTGGACATG3′), NTRK3-r (5′TCCGAAGTCCTGAGTTCTTGATG3′), WNK2-f (5′AAGAGCGTCATTTGCCAAAAG3′) and WNK2-r (5′ACTCATCGTAGTGCTCCTCGTACA3′).
Small molecule screening
K562 cells (2.5 × 10⁴ cells per well) were plated in a 96-well plate preloaded with 79 different small molecules (10 μM/compound/well; Microsource Discovery Systems, the Spectrum Collection) or vehicle control (DMSO). After 4 h incubation, the cells were analyzed using the Cyto-ID fluorescence spectrophotometric assay described above.
Mouse experiments
All animal studies were approved by the Institutional Animal Care and Use Committee (IACUC) of Virginia Tech. C57BL6 mice (Charles River Laboratories, 24101547) (n = 4 mice per treatment group) were administered with PP242 (60 mg/kg/d by intraperitoneal injection) or hydroxychloroquine (50 mg/kg/d by intraperitoneal injection). Peripheral blood (30 μl) was withdrawn from the tail vein before or 2, 4, and 8 h after the treatment. Red blood cells were lysed with ammonium chloride and the resulting white blood cells were subject to the Cyto-ID assay described above. To examine autophagy in a mouse model of BCR-ABL-driven leukemia, 32D/BCR-ABL cells (1.5 x 10⁶) were injected intravenously into 12 SCID-beige mice (n = 4 mice per treatment group) via the tail vein as described in our previous studies.Citation29 After 6 d, mice were administered either imatinib (100 mg/kg/d) or hydroxychloroquine (50 mg/kg every other day) orally via gavage. Four or 5 d after treatment, mice from each treatment group were euthanized and their femurs and blood were collected. Bone marrow was extracted from the femurs and then white blood cells were isolated using Ficoll-Paque PREMIUM 1.084 solution (17-5446-02) purchased from GE Healthcare Life Sciences. Autophagy was monitored using the Cyto-ID-based fluorescence spectrophotometric assay described above.
Statistical analyses.
The Student t test and the one-way ANOVA with the Tukey post-hoc test for multiple comparisons was used for statistical analyses. These tests were done using the SPSS software.
Disclosure of Potential Conflicts of Interest
No potential conflicts of interest were disclosed.
Funding
This work is supported by the start-up funds provided to Dr. Zhi Sheng by the Virginia Tech Carilion Research Institute.
References
- Parzych KR, Klionsky DJ. An overview of autophagy: morphology, mechanism, and regulation. Antioxid Redox Signal 2013; 4(20):460-73; PMID:23725295
- Rubinsztein DC, Codogno P, Levine B. Autophagy modulation as a potential therapeutic target for diverse diseases. Nat Rev Drug Discov 2012; 11:709-30; PMID:22935804; http://dx.doi.org/10.1038/nrd3802
- Choi AM, Ryter SW, Levine B. Autophagy in human health and disease. New England J Med 2013; 368:651-62; PMID:23406030; http://dx.doi.org/10.1056/NEJMra1205406
- Sotelo J, Briceno E, Lopez-Gonzalez MA. Adding chloroquine to conventional treatment for glioblastoma multiforme: a randomized, double-blind, placebo-controlled trial. Ann Intern Med 2006; 144:337-43; PMID:16520474; http://dx.doi.org/10.7326/0003-4819-144-5-200603070-00008
- Franz DN, Belousova E, Sparagana S, Bebin EM, Frost M, Kuperman R, Witt O, Kohrman MH, Flamini JR, Wu JY., et al. Efficacy and safety of everolimus for subependymal giant cell astrocytomas associated with tuberous sclerosis complex (EXIST-1): a multicentre, randomised, placebo-controlled phase 3 trial. Lancet 2013; 381:125-32; PMID:23158522; http://dx.doi.org/10.1016/S0140-6736(12)61134-9
- Mizushima N, Yoshimori T, Levine B. Methods in mammalian autophagy research. Cell 2010; 140:313-26; PMID:20144757; http://dx.doi.org/10.1016/j.cell.2010.01.028
- Klionsky, DJ, Abdalla FC, Abeliovich H, Abraham RT, Acevedo-Arozena A, Adeli K, Agholme L, Agnello M, Agostinis P, Aguirre-Ghiso JA., et al. Guidelines for the use and interpretation of assays for monitoring autophagy. Autophagy 2012; 8:445-544; PMID:22966490; http://dx.doi.org/10.4161/auto.19496
- Kabeya Y, Mizushima N, Ueno T, Yamamoto A, Kirisako T, Noda T, Kominami E, Ohsumi Y, Yoshimori T. LC3, a mammalian homologue of yeast Apg8p, is localized in autophagosome membranes after processing. Embo J 2000; 19:5720-8; PMID:11060023; http://dx.doi.org/10.1093/emboj/19.21.5720
- Kuma A, Matsui M, Mizushima N. LC3, an autophagosome marker, can be incorporated into protein aggregates independent of autophagy: caution in the interpretation of LC3 localization. Autophagy 2007; 3, 323-8; PMID:17387262; http://dx.doi.org/10.4161/auto.4012
- Chan LL, Shen D, Wilkinson AR, Patton W, Lai N, Chan E, Kuksin D, Lin B, Qiu J. A novel image-based cytometry method for autophagy detection in living cells. Autophagy 2012; 8, 1371-82; PMID:22895056; http://dx.doi.org/10.4161/auto.21028
- Oeste CL, Seco E, Patton WF, Boya P, Perez-Sala D. Interactions between autophagic and endo-lysosomal markers in endothelial cells. Histochem Cell Biol 2013; 139, 659-70; PMID:23203316; http://dx.doi.org/10.1007/s00418-012-1057-6
- Sherer NM, Lehmann MJ, Jimenez-Soto LF, Ingmundson A, Horner SM, Cicchetti G, Allen PG, Pypaert M, Cunningham JM, Mothes W. Visualization of retroviral replication in living cells reveals budding into multivesicular bodies. Traffic 2003; 4:785-801; PMID:14617360; http://dx.doi.org/10.1034/j.1600-0854.2003.00135.x
- Vonderheit A, Helenius A. Rab7 associates with early endosomes to mediate sorting and transport of semliki forest virus to late endosomes. PLoS Biol 2005; 3:e233; PMID:15954801; http://dx.doi.org/10.1371/journal.pbio.0030233
- Apsel B, Blair JA, Gonzalez B, Nazif TM, Feldman ME, Aizenstein B, Hoffman R, Williams RL, Shokat KM, Knight ZA. Targeted polypharmacology: discovery of dual inhibitors of tyrosine and phosphoinositide kinases. Nat Chem Biol 2008; 4:691-9; PMID:18849971; http://dx.doi.org/10.1038/nchembio.117
- Seglen PO, Gordon PB. Three-Methyladenine: specific inhibitor of autophagic/lysosomal protein degradation in isolated rat hepatocytes. Proc Natl Acad Sci U S A 1982; 79, 1889-92; PMID:6952238; http://dx.doi.org/10.1073/pnas.79.6.1889
- Trout JJ, Stauber WT, Schottelius BA. Increased autophagy in chloroquine-treated tonic and phasic muscles: an alternative view. Tissue Cell 1981; 13:393-401; PMID:7314075; http://dx.doi.org/10.1016/0040-8166(81)90013-6
- Biederbick A, Kern HF, Elsasser HP. Monodansylcadaverine (MDC) is a specific in vivo marker for autophagic vacuoles. Eur J Cell Biol 1995; 66:3-14; PMID:7750517.
- Bampton ET, Goemans CG, Niranjan D, Mizushima N. Tolkovsky AM. The dynamics of autophagy visualized in live cells: from autophagosome formation to fusion with endo/lysosomes. Autophagy 2005; 1:23-36; PMID:16874023; http://dx.doi.org/10.4161/auto.1.1.1495
- Chan EY., Kir S, Tooze SA. siRNA screening of the kinome identifies ULK1 as a multidomain modulator of autophagy. J Biol Chem 2007; 282, 25464-74; PMID:17595159; http://dx.doi.org/10.1074/jbc.M703663200
- Kovacs J. Induced cellular autophagy in the epithelial cells of seminal vesicle of mice treated with actinomycin D. Acta Biol Acad Sci Hung 1972; 23:181-93; PMID:4359852.
- Hasson, SA, Kane LA, Yamano K, Huang CH, Sliter DA, Buehler E, Wang C, Heman-Ackah SM, Hessa T, Guha R4., et al. High-content genome-wide RNAi screens identify regulators of parkin upstream of mitophagy. Nature 2013; 504:291-5; PMID:24270810.
- Lipinski MM, Hoffman G, Ng A, Zhou W, Py BF, Hsu E, Liu X, Eisenberg J, Liu J, Blenis J., et al. A genome-wide siRNA screen reveals multiple mTORC1 independent signaling pathways regulating autophagy under normal nutritional conditions. Dev Cell 2010; 18:1041-052; PMID:20627085; http://dx.doi.org/10.1016/j.devcel.2010.05.005
- McKnight NC, Jefferies HB, Alemu EA, Saunders RE, Howell M, Johansen T, Tooze SA. Genome-wide siRNA screen reveals amino acid starvation-induced autophagy requires SCOC and WAC. Embo J 2012; 31:1931-46; PMID:22354037; http://dx.doi.org/10.1038/emboj.2012.36
- Orvedahl A, Sumpter R Jr, Xiao G, Ng A, Zou Z, Tang Y, Narimatsu M, Gilpin C, Sun Q, Roth M., et al. Image-based genome-wide siRNA screen identifies selective autophagy factors. Nature 2011; 480:113-7; PMID:22020285; http://dx.doi.org/10.1038/nature10546
- Szyniarowski P, Corcelle-Termeau E, Farkas T, Høyer-Hansen M, Nylandsted J, Kallunki T, Jäättelä M. A comprehensive siRNA screen for kinases that suppress macroautophagy in optimal growth conditions. Autophagy 2011; 7:892-903; PMID:21508686; http://dx.doi.org/10.4161/auto.7.8.15770
- Zhang, L, Yu J, Pan H, Hu P, Hao Y, Cai W, Zhu H, Yu AD, Xie X, Ma D., et al. Small molecule regulators of autophagy identified by an image-based high-throughput screen. Proc Natl Acad Sci U S A 2007; 104:19023-8; PMID:18024584; http://dx.doi.org/10.1073/pnas.0709695104
- Williams A, Sarkar S, Cuddon P, Ttofi EK, Saiki S, Siddiqi FH, Jahreiss L, Fleming A, Pask D, Goldsmith P., et al. Novel targets for Huntington's disease in an mTOR-independent autophagy pathway. Nat Chem Biol 2008; 4:295-305; PMID:18391949; http://dx.doi.org/10.1038/nchembio.79
- Sheng Z, Ma L, Sun JE, Zhu LJ, Green MR. BCR-ABL suppresses autophagy through ATF5-mediated regulation of mTOR transcription. Blood 2011; 118, 2840-8; PMID:21715304; http://dx.doi.org/10.1182/blood-2010-12-322537
- Sheng Z, Wang SZ. Green MR. Transcription and signalling pathways involved in BCR-ABL-mediated misregulation of 24p3 and 24p3R. Embo J 2009; 28, 866-76; PMID:19229297; http://dx.doi.org/10.1038/emboj.2009.35