Abstract
Shiga toxins (Stxs) are a family of cytotoxic proteins that lead to the development of bloody diarrhea, hemolytic-uremic syndrome, and central nervous system complications caused by bacteria such as S. dysenteriae, E. coli O157:H7 and E. coli O104:H4. Increasing evidence indicates that macroautophagy (autophagy) is a key factor in the cell death induced by Stxs. However, the associated mechanisms are not yet clear. This study showed that Stx2 induces autophagic cell death in Caco-2 cells, a cultured line model of human enterocytes. Inhibition of autophagy using pharmacological inhibitors, such as 3-methyladenine and bafilomycin A1, or silencing of the autophagy genes ATG12 or BECN1 decreased the Stx2-induced death in Caco-2 cells. Furthermore, there were numerous instances of dilated endoplasmic reticulum (ER) in the Stx2-treated Caco-2 cells, and repression of ER stress due to the depletion of viable candidates of DDIT3 and NUPR1. These processes led to Stx2-induced autophagy and cell death. Finally, the data showed that the pseudokinase TRIB3-mediated DDIT3 expression and AKT1 dephosphorylation upon ER stress were triggered by Stx2. Thus, the data indicate that Stx2 causes autophagic cell death via the ER stress pathway in intestinal epithelial cells.
Abbreviations::
- 3-MA, 3-methyladenine
- Δ, knockout
- AO, acridine orange
- ATF4, activating transcription factor 4
- ATG, autophagy-related
- Baf A1, bafilomycin A1
- BECN1, Beclin 1, autophagy-related
- CASP3, caspase 3, apoptosis-related cysteine peptidase
- DDIT3, DNA-damage-inducible transcript 3
- EHEC O157, Escherichia coli O157:H7
- FACS, fluorescence activated cell sorting
- MAP1LC3B, microtubule-associated protein 1 light chain 3 beta
- MAPK, mitogen-activated protein kinase
- MDC, monodansylcadaverine
- NUPR1, nuclear protein, transcriptional regulator, 1
- PBS, phosphate-buffered saline
- PARP1, poly (ADP-ribose) polymerase 1
- PI, propidium iodide
- Stxs, Shiga toxins
- Thap, thapsigargin
- TEM, transmission electron microscopy
- TRIB3, tribbles pseudokinase 3
- WT, wild type
- Z-VAD, Z-VAD-FMK
Introduction
Escherichia coli O157:H7 (EHEC O157) is the most common member of a group of pathogenic E. coli strains known as enterohemorrhagic verocytotoxin-producing organisms.Citation1 A growing body of evidence supports the view that Shiga toxins are the essential virulence factors of EHEC O157.Citation2 Shiga toxins are a family of cytotoxic proteins that lead to the development of bloody diarrhea, hemolytic-uremic syndrome, and central nervous system complications.Citation3 Because there are currently no vaccines or effective interventional therapies to prevent or treat diseases caused by Stxs, further understanding of the pathogenesis of Stxs is necessary to develop an effective vaccine or treatment strategy.Citation4
Although a hallmark of Stxs in toxication is acute renal failure, intestinal mucosal epithelium is the first barrier against Stxs invading blood.Citation5 Stxs bind to the cell surface and are endocytosed, leading to the inhibition of protein synthesis and eventually cell death.Citation6 Additionally, an accumulating number of papers have reported that Stxs can also activate other cell signaling pathways in different cell types, such as apoptosis and the ribotoxic and endoplasmic reticulum stress pathways.Citation7-8 Activation of signaling cascades can contribute to the induction of cell death in some cell types; thus, the mechanism by which Stxs induce cell death should be further clarified.
The endoplasmic reticulum is the final compartment in the intracellular delivery of Stxs. The ER is a eukaryotic organelle that forms an interconnected network of tubules, membrane vesicles, and cisternae within the cells. The main functions of the ER are to transport synthesized proteins and to facilitate protein folding.Citation9 However, prolonged failure to correctly fold and translocate proteins can lead to ER stress, which results in a conserved cell stress response. The stress response, which is initially aimed at compensating for the damage, can eventually lead to cell death if the damage is severe or prolonged.Citation10-12 Growing evidence has suggested that the activation of ER stress leads to increased expression of the stress-regulated protein NUPR1 and other ER stress–related downstream targets. In turn, these proteins activate ATF4 (activating transcription factor 4), DDIT3 (DNA-damage-inducible transcript 3), and TRIB3 (tribbles pseudokinase 3) to induce apoptotic cell death in different cell lines, including human endothelial, myeloid, and epithelial cells.Citation13-16 Despite these advances, the pathogenic mechanisms of Stxs remain unclear, and further clarification is needed.
Macroautophagy, herein referred to as autophagy, is a fundamental cellular homeostatic process in which cytosolic proteins or intracellular organelles are sequestered within double-membrane structures called autophagosomes for subsequent delivery to the lysosomes for degradation.Citation17 Under appropriate conditions, autophagy has been reported to protect cells from cell death. In contrast to autophagy-induced cell survival, autophagy can contribute to autophagic cell death under certain stress conditions that lead to prolonged autophagy or over-stimulated autophagy to the extent that essential components for cell survival are degraded.Citation18 It was reported that many treatments can induce autophagic cell death, including cannabinoid, arsenic trioxide, hypoxia, platonin, and rhabdastrellic acid-A.Citation19-22 Recently, Lee et al. reported that Stxs induced autophagy through different signaling pathways in toxin-sensitive and toxin-resistant human cells.Citation4 However, the process by which Stx induces autophagy is still unclear.
In the present study, the relationships between Stx2 and ER stress, autophagy, and cell death were investigated in Caco-2 cells, a cultured line model of human enterocytes. We hypothesized that autophagy plays an important role in Stx2-induced cell death via the ER stress pathway.
Results
Stxs destroy the intestinal mucosal tissue, and induce cell death in human colorectal cancer cells.
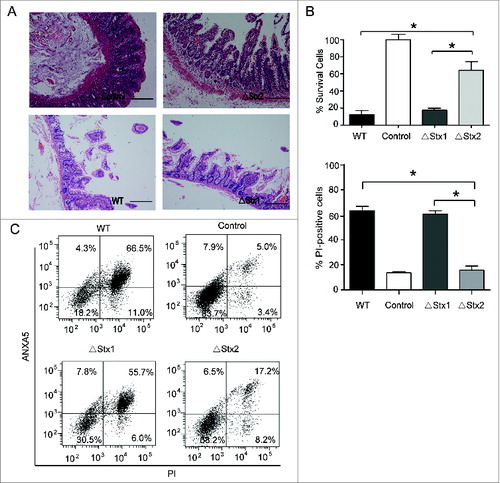
Previous studies have shown that Stxs rapidly induce apoptosis of intestinal epithelial cells, and Stx2 is approximately 400 times more toxic than Stx1, as quantified by its LD50 in mice.Citation23-24 To further investigate the toxic role of Stx1 and Stx2 in the intestinal barrier, the colon intestinal tissues were challenged with the sonicated lysate of EHEC O157-WT, O157-ΔStx1, or O157-ΔStx2 strains of O157 Sakai,Citation25-26 and the damage of the intestinal mucosal barrier was examined by hematoxylin and eosin staining. As shown in A, the damage degree of the O157-WT, O157-ΔStx1 and -ΔStx2 groups was significantly increased compared to the control, and the damage degree of the O157-ΔStx1 group was higher than the O157-ΔStx2 group. Similar results were also obtained in the intestinal tissue culture of C57BL/6 mice (Fig. S1). To further investigate the cell death by Stxs, an MTT assay was performed; this method is considered an effective way to detect cell death. Stx2 knockout significantly decreased the O157-induced cell death compared to O157-WT in human colorectal cancer cells (Caco-2 cells; B). Moreover, an ANXA5/annexin V-FITC/propidium iodide (PI) staining assay also showed that Stx2 knockout dramatically decreased the O157-induced cell death (C). These results demonstrate that Stx2 has a critical role in EHEC O157-induced cell death in human colorectal cancer cells.
Figure 1. Stxs destroy the intestinal mucosal tissue, and induce cell death in human colorectal cancer cells. (A) Representative images of hematoxylin and eosin staining of colonic epithelium from surgery patients. The colon intestinal tissue challenged by the sonicated lysate of the ΔStx1 and ΔStx2 strains versus WT or the control for 24 h. Scale bar in all panels: 50 μm. (B) The effect of Stx1 and Stx2 on the viability of human colorectal cancer cells. Caco-2 cells were treated with the indicated treatments of the sonicated lysate (the concentration of toxin was about 30 ng/ml) of WT, ΔStx1, ΔStx2, and the control for 24 h, which can eliminate interference induced by cell culture medium acidification and hypoxia during live bacterial infection. Cell viability was assessed using an MTT assay. (C) To assess cell death in vitro, Caco-2 cells were treated with the sonicated lysate (the concentration of toxin was about 30 ng/ml) of the indicated bacteria for 24 h; the cells were then subjected to ANXA5-PI staining and analyzed by flow cytometry. The percentage of cells that were PI-positive relative to the total cell number for each treatment is shown. The data are presented as the mean ± SD of 3 independent experiments. * P < 0.05.
Cell death caused by Stx2 is dependent on autophagy
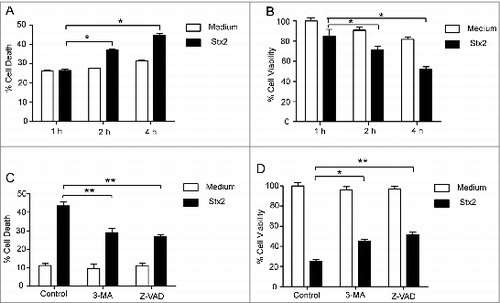
To further assess the role of Stx2 in the EHEC O157-induced human intestinal epithelial cell death, Caco-2 cells were treated with Stx2 protein. Stx2 induced cell death (PI staining assay; A) and suppressed proliferation (MTT assay; B) in a time-dependent manner in Caco-2 cells. These results indicate that Stx2 directly causes cell death in Caco-2 cells. Lee et al. reported that Shiga toxins can induce autophagy in toxin-sensitive and toxin-resistant human cells.Citation4 However, whether autophagy contributes to cell survival or cell death under Stx2 stress conditions is unknown. To investigate this problem, we pre-treated cells with autophagy (3-methyladenine, 3-MA) or apoptosis inhibitors (Z-VAD-FMK, Z-VAD) and assessed the cell death that was subsequently induced by Stx2 treatment. A significant reduction in cell death was observed in the Caco-2 cells pre-treated with 3-MA or Z-VAD (C and 2D). The data suggest that autophagy plays an important role in the Stx2-induced cell death and promotes cell death.
Figure 2. Cell death caused by Stx2 is dependent on autophagy. (A and B) Stx2 induced cell death in Caco-2 cells. The cells were treated with Stx2 (30 ng/ml) for 1, 2 or 4 h. (C and D) The effects of 3-MA or Z-VAD on the cytotoxicity of Stx2 in Caco-2 cells. After pretreatment with 2 mM 3-MA or 50 μM Z-VAD, Caco-2 cells were treated with 30 ng/ml Stx2 for 4 h. The percentage of dead cells was determined using the cell death assay (PI staining) or the cell viability assay (MTT). The results shown are representative of at least 3 independent experiments.*P < 0.05, **P < 0.01.
Stx2 induces autophagy in Caco-2 cells
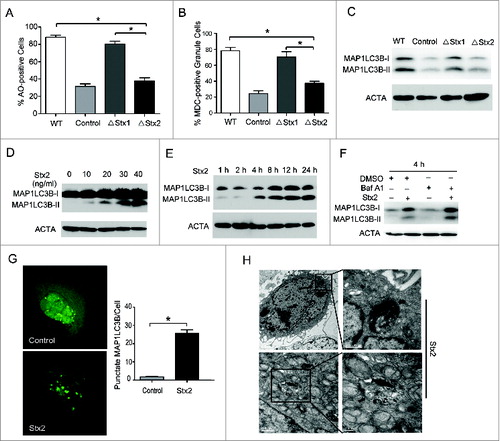
To determine whether Stx2 could induce autophagy in Caco-2 cells, we first examined the formation of autolysosomes using flow cytometry after staining with monodansylcadaverine (MDC) or acridine orange (AO). Compared with O157-△Stx2, O157-WT and O157-△Stx1 significantly induced the formation of autolysosomes in Caco-2 cells (A and 3B). The ratio of MAP1LC3B-II (microtubule-associated protein 1 light chain 3 beta-II) to actin, considered to be an accurate indicator of autophagy, was consistent with the results above (C). Furthermore, Stx2 induced MAP1LC3B-II accumulation in time- and dose-dependent manners in these cells (D and 3E). Inhibition of autophagy by bafilomycin A1 (Baf A1) further enhanced the accumulation of MAP1LC3B-II in the Caco-2 cells (F), which suggests that autophagic flux was increased by Stx2 treatment. The formation of GFP-MAP1LC3B puncta is another marker of autophagosomes. As shown in G, Stx2 increased the number of GFP-MAP1LC3B puncta in cells after 24 h (P < 0.05). TEM analysis also revealed an increase in the number of autophagosomes in the Stx2-treated Caco-2 cells (H). The aggregate above results suggest that Stx2 could induce a complete autophagy in Caco-2 cells.
Figure 3. Stx2 induces autophagy in Caco-2 cells. (A and B) Caco-2 cells were subjected to the indicated treatments for 4 h and were stained with 1 mg/ml acridine orange or 50 mM MDC for 15 min. After incubation, the cells were immediately analyzed by flow cytometry. (C) Measurement of the MAP1LC3B-II conversion in Caco-2 cells subjected to the indicated treatments using western blot analysis. (D and E) Stx2 increased the conversion of MAP1LC3B-I to MAP1LC3B-II in Caco-2 cells. Caco-2 cells were treated with a gradually increasing concentration of Stx2 (0, 10, 20, 30, or 40 ng/ml) or were treated with 30 ng/ml Stx2 for 1, 2, 4, 8, 12, or 24 h. (F) Stx2 induced incomplete autophagic flux in Caco-2 cells. Caco-2 cells were treated with 30 ng/ml Stx2 for 4 h in the presence of 10 nM Baf A1. (G) Caco-2 cells were transfected with a plasmid expressing GFP-MAP1LC3B. After 24 h, the cells were treated with 30 ng/ml Stx2 for 4 h. Following fixation the cells were immediately visualized using a confocal microscope. The number of GFP-MAP1LC3B puncta in each cell was counted. (H) Representative TEM images of Caco-2 cells treated with 30 ng/ml Stx2 treatment for 4 h. The arrows indicate the autophagosomes. The experiments were performed in triplicate, and all replicates showed similar results.*P < 0.05.
ER stress may be involved in Stx2-induced cell death
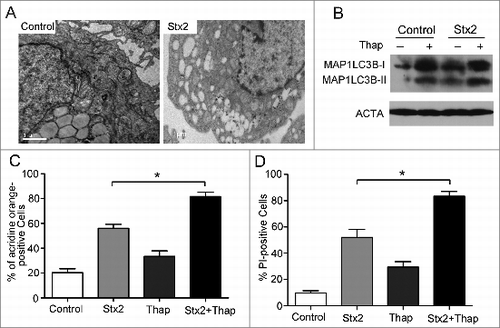
Previous studies have shown that Stxs trigger ER stress, leading to apoptotic cell death.Citation7-8 To further elucidate whether ER stress was induced in our cell model, we used electron microscopy to analyze the ultrastructure of the Stx2-treated Caco-2 cells. There were more dilated endoplasmic reticula in the Stx2-treated Caco-2 cells than the untreated cells (A). Moreover, using western blot analysis and an AO staining assay to detect autophagy and cell death, it was shown that thapsigargin (an ER stress inducer) could induce autophagy (B and 4C), and cell death in Caco-2 cells (D). These results suggest that ER stress may be involved in Stx2-induced cell death.
Figure 4. ER stress may be involved in Stx2-induced cell death. (A) High-resolution TEM images of Caco-2 cells treated with 30 ng/ml Stx2 for 4 h. The TEM images showed the dilatation of the ER in the Stx2-treated cells compared to the untreated cells. (B) Measurement of MAP1LC3B-II conversion in Caco-2 cells using western blot analysis. The cells were treated with 30 ng/ml Stx2 for 4 h in the presence of 200 nM thapsigargin (Thap). (C and D) Caco-2 cells were exposed to 200 nM Thap, a combination of 200 nM Thap and 30 ng/ml Stx2, or Stx2 alone for 4 h. The cells that were positive for autophagosomes were detected using an acridine orange staining assay. Cell death was analyzed following PI staining. *P < 0.05.
Stx2 induces autophagy through ER stress
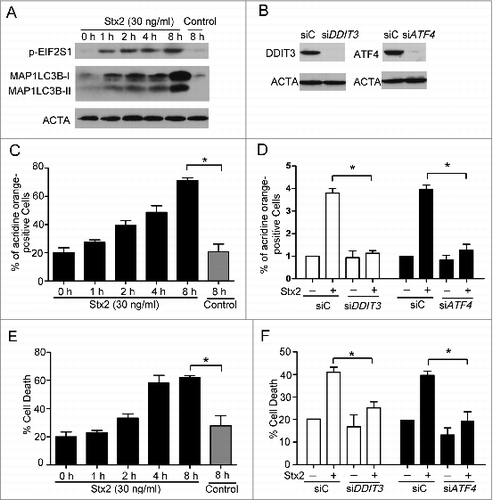
To further investigate the role of ER stress in Stx2-induced autophagy, the hallmarks of ER stress were investigated following Stx2 treatment. Consistent with the observations of electron microscopy analysis, Stx2 increased the phosphorylation of the α subunit of EIF2S1 (eukaryotic translation initiation factor 2, subunit 1 alpha, 35kDa) and MAP1LC3B-II accumulation in Caco-2 cells (A). The Stx2-induced autophagy and cell death also shared the same trend with the phosphorylation of EIF2S1 (C and 5E). Moreover, ATF4 or DDIT3 knockdown drastically decreased the formation of autolysosomes and cell death in the Stx2-treated Caco-2 cells (B, 5D, 5F). These results suggest that ER stress precedes autophagy.
Figure 5. Stx2 induces autophagy through ER stress. (A) Measurement of EIF2S1 phosphorylation and MAP1LC3B-II conversion following Stx2 treatment using western blot analysis. Caco-2 cells were treated with 30 ng/ml Stx2 for 0, 1, 2, 4, or 8 h or were untreated for 8 h. (B) The inhibition efficiency of the siRNAs against DDIT3 and ATF4. Caco-2 cells were transfected with siRNAs targeting DDIT3 and ATF4 (100 nM each) for 24 h, and the protein levels of the 2 targets were evaluated using western blot analysis. (C and D) The quantification of autophagosomes in Caco-2 cells by acridine orange staining. The cells were treated with only 30 ng/ml Stx2 or were treated with Stx2 after transfection with siC, siDDIT3, or siATF4 for 24 h. (E and F) Detection of cell death by PI staining. Caco-2 cells were treated as above. The data shown represent the mean ±SD of at least 3 independent experiments.*P < 0.05.
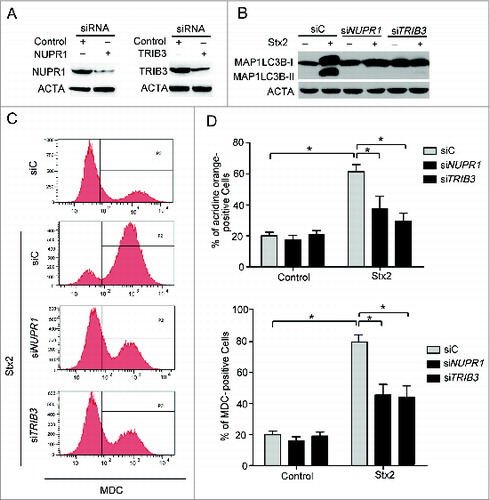
NUPR1 and TRIB3 (a target of DDIT3-ATF4) play important roles in ER stress-induced cell death. To evaluate these roles, NUPR1 and TRIB3 were knocked down in Caco-2 cells (A). Knockdown of NUPR1 or TRIB3 prevented Stx2-induced autophagy in the Stx2-treated Caco-2 cells (B, 6C and 6D). Altogether, these findings reveal that Stx2 induces autophagy in the Caco-2 cells by inducing ER stress, which involves the stimulation of EIF2S1 phosphorylation and the upregulation of NUPR1 and TRIB3.
Figure 6. Stx2-induced autophagy is dependent on the ER. (A) Detection of the inhibition efficiency of siRNAs against NUPR1 and TRIB3. Caco-2 cells were transfected with siRNAs targeting NUPR1 and TRIB3 (100 nM each) for 24 h, and the protein levels of the 2 targets were evaluated using western blot analysis. (B) The effect of 30 ng/ml Stx2 on MAP1LC3B-II conversion in Caco-2 cells transfected with siC, siNUPR1, or siTRIB3 for 24 h. (C and D) Detection of MDC and AO staining of cells that were transfected with siC, siNUPR1, or siTRIB3 using flow cytometry analysis. The experiments performed in triplicate showed consistent results. * P < 0.05.
Autophagy is upstream of apoptosis in Stx2-induced cell death
The relationship of autophagy to Stx2-induced apoptosis was examined by exposing the cells to the autophagy inhibitor 3-MA. As shown in A and 7B, 3-MA suppressed the Stx2-induced autophagy. Additionally, the analysis of active CASP3/caspase 3 in Caco-2 cells revealed that autophagy preceded the appearance of apoptosis in the Stx2-treated cells (C). The effects of ATG12 and BECN1 depletion through siRNA interference are shown in D. To further evaluate the role of autophagy in the cell death induced by Stx2, we examined the effect of ATG12 or BECN1 siRNA and found that either decreased Stx2-induced cell death and PARP1 cleavage (a useful hallmark of apoptosis; E and 7F), which suggests that autophagy may precede the manifestation of apoptosis.
Figure 7. Autophagy is upstream of apoptosis in Stx2-induced cell death. (A) Detection of active CASP3 following 3-MA pretreatment in cells. (B) Measurement of MAP1LC3B-II conversion following Stx2 treatment using western blot analysis. Caco-2 cells were treated with 30 ng/ml Stx2 for 4 h in the presence of 2 mM 3-MA. (C) Detection of AO staining by flow cytometry following Stx2 treatment. Caco-2 cells were treated as above. (D) The inhibition efficiency of siRNAs against ATG12 and BECN1. Caco-2 cells were transfected with siRNAs targeting ATG12 and BECN1 (100 nM each) for 24 h, and the protein levels of the 2 targets were evaluated using western blot analysis. (E) The effect of 30 ng/ml Stx2 on PARP1 cleavage in Caco-2 cells transfected with siC, siATG12, or siBECN1. (F) Detection of cell death by flow cytometry in cells transfected with siC, siATG12, or siBECN1 for 24 h. (G and H) Detection of MDC and AO staining of cells treated with Z-VAD or 30 ng/ml Stx2 using flow cytometry analysis. (I) The MAP1LC3B-II conversion was detected using western blot analysis. Caco-2 cells were treated as above. (J) Caco-2cells were treated with 30 ng/ml Stx2 for the indicated times. The cell lysates were prepared for western blot analysis to detect the phosphorylation of AKT1, MTOR, MAPK, and the expression of BECN1 using the indicated antibodies.
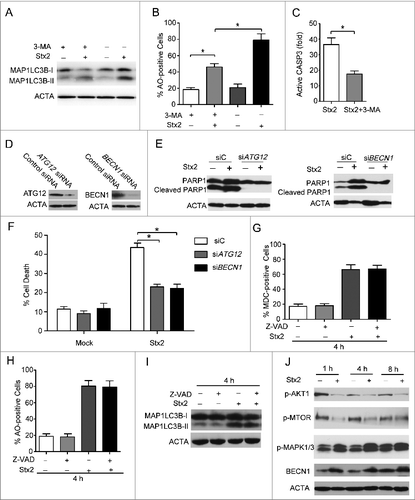
While analyzing the relationship between autophagy and apoptosis, we observed that the amount of cell death prevented by the pan-caspase inhibitor Z-VAD was less than what was inhibited by treatment with 3-MA (C and 2D). The results indicate that autophagy could potentially be a major pathway for cell death in the Stx2-treated cells. Although the above results showed that autophagy precedes apoptosis, it is unclear whether apoptosis could regulate autophagy. To further examine this relationship, the cells were exposed to the apoptosis inhibitor Z-VAD, and the amount of autophagy induced by Stx2 treatment was evaluated. As shown in G, 7H, and 7I, treatment with Z-VAD had no significant effect on the amount of autophagy induced by Stx2, which suggests that apoptosis did not regulate autophagy following Stx2 treatment.
Previous research showed that ER stress stimulated the NUPR1-TRIB3 pathway, which induces autophagy through the inhibition of the AKT1-MTORC1 axis.Citation19 Therefore, we were interested in testing whether this possibility was true using a cell model. As shown in J, after Stx2 treatment for the indicated times, Stx2 inhibited the phosphorylation of AKT1 in Caco-2 cells. MTOR is an important downstream target of the AKT1 pathway and plays a key role in autophagy and apoptosis. As shown in J, the phosphorylation of MTOR was dramatically decreased in a time-dependent manner after Stx2 treatment. These results indicate that the AKT1 pathway was inhibited by Stx2 in the Caco-2 cells and may be involved in the Stx2-induced cell death.
Discussion
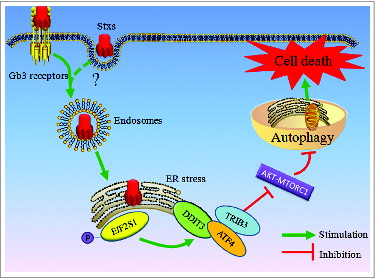
Earlier studies demonstrated that Stx2 can induce autophagy through differential signaling pathways in Stx2-sensitive or Stx2-resistant human cells. However, its precise mechanism and the role of autophagy in Stx2-induced cell death have not been clearly determined in intestinal epithelial cells. Based on the present results, we propose that Stx2 induces autophagic cell death through endoplasmic reticulum stress in intestinal epithelial cells (). This novel mechanism is supported by the following results: i) Stx2 significantly enhanced autophagy and cell death in Caco-2 cells, which is consistent with previous studies.Citation27-28 ii) The autophagy by Stx2 is dependent on ER stress-mediated signaling. iii) Autophagy may be an upstream signal for apoptosis in Stx2-induced cell death.
Figure 8. Schematic of the proposed mechanism of Shiga toxins inducing autophagic cell death in intestinal epithelial cells via the endoplasmic reticulum stress pathway (see text for details).
Autophagy is a fundamental homeostatic process, which enables cells to recycle their own cytosolic constituents and degrade other exogenous materials in a regulated manner. Although accumulating evidence has demonstrated that altered autophagy can promote cell survival or cell death under cellular stress conditions, its role in Stx2-induced cell death has not yet been reported. In the present study, we assessed whether cell death induced by Stx2 was regulated by the inhibition of autophagy using 3-MA and siRNA targeting ATG12 and BECN1, all of which can inhibit the autophagy process. Remarkably, both 3-MA treatment and the siRNA decreased the amount of Stx2-induced cell death. Consistent with this result, Sandvig and Van Deurs showed that 3-MA can protect MDCK and Vero cells from apoptosis induced by Stxs.Citation29 These results indicate that autophagy directly promotes the cell death induced by Stx2, as well as regulates the activation of apoptosis.
It has been shown in previous studies that both the ER stress and autophagy pathways are novel mechanisms of cell death.Citation30-31 Additionally, ER stress could induce autophagy in organisms ranging from yeast to mammals.Citation32 However, it is unclear whether disruption of autophagy or dysfunction of the ER plays a critical role in the cell death induced by Stx2. In our study, autophagy was activated by Stx2 as a cell death response in intestinal epithelial cells, and this response was mediated by ER stress. Thapsigargin could induce autophagy and cell death in the model. Furthermore, the silencing of both NUPR1 and DDIT3 drastically decreased autophagy in Caco-2 cells. These findings support the mechanism that ER stress signals induced by Stx2 are responsible for the activation of autophagy.
However, the mechanism underlying the Stx2-induced AKT1 inactivation still remains unclear. During ER stress, DDIT3 could be activated by the PERK-ATF4 pathway and/or the IRE1-ATF6 pathway. Studies involving overexpressed or depleted DDIT3 have indicated that DDIT3 is involved in ER stress-induced apoptosis;Citation33-34 however, little is known about the signaling pathway involved in DDIT3-mediated autophagy. Very recently, TRIB3 has been shown to be a downstream target of DDIT3 and to bind to AKT1 to activate autophagy.Citation19 AKT1, a well-known inhibitor of apoptosis, is also a major negative regulator of autophagy. Thus, inhibition of AKT1 might lead to autophagy through the inhibition of MTOR, thus initiating the autophagic process. It was observed that Stx2 inhibits the phosphorylation of AKT1 and MTOR and leads to autophagy in Caco-2 cells. Based on our observations, we inferred that TRIB3 could be the link between ER stress-induced DDIT3 and AKT1 dephosphorylation during Stx2-induced autophagic cell death.
In summary, these results provide novel evidence that Stx2 activates autophagy through the ER stress response and induces cell death of Caco-2 cells.
Materials and Methods
Antibodies and reagents
The GFP-MAP1LC3B plasmid was kindly provided by Dr. Tamotsu Yoshimori (Osaka University, Osaka, Japan). 3-methyladenine (M9281), bafilomycin A1 (B1793), Z-VAD (V116) and thapsigargin (T9033) were purchased from Sigma; antibodies against MAP1LC3B (L7543) and ATG12 (WH0009140m1) were also obtained from Sigma. The antibodies against DDIT3 (3087), PARP1 (9542), p-AKT1 (9271), and p-MTOR (2971) were obtained from Cell Signaling Technology. The antibody against BECN1 (612112) was obtained from BD Transduction Laboratories, Inc., and the antibody against ACTA (sc-10731) was obtained from Santa Cruz Biotechnology.
Tissue culture, cell culture, and bacterial strains
Caco-2 cells were purchased from the cell bank at the Chinese Academy of Sciences and were grown in DMEM medium (Gibco, 11965-092) containing 10% fetal bovine serum (Gibco, 10099-141) and 100 U/ml penicillin/streptomycin (Gibco, 15140-122). The cell lines were cultured at 37 °C in 5% CO2. For all experiments, the EHEC O157:H7 Sakai strain was obtained from the American Type Culture Collection (ATCC, BAA-460).
The intestinal tissue culture was performed with a modification of the method that was described previously.Citation35 Briefly, the intestinal tissues of the patients were sliced into fragments and cut longitudinally, followed by soaking in ice-cold phosphate-buffered saline (PBS; Sigma, P5493) containing gentamicin (0.5mg/mL; Sigma, G9654), with gentle shaking at 4°C for 10min to remove feces and contaminants. The tissue fragments were then washed 3 times in ice-cold PBS (with gentamicin) with gentle shaking at 4°C for 10min. Finally, the colon intestinal tissue was challenged with the sonicated lysate of the △Stx1 and △Stx2 strains versus WT or the control for 24 h. The study was approved by the ethics review board at Third Military Medical University, and informed consent was obtained from all patients before participation. Histological assessment was performed according to the Sydney classification by 2 pathologists who were blinded to the other experimental results. The intestinal tissue culture of C57BL/6 mice is the same as the above methods.
Construction of ΔStx1 and ΔStx2 EHEC O157 mutants
Strains ΔStx1 and ΔStx2 EHEC O157:H7 (Stx knockout) were constructed using the λ Red recombinase method.Citation36 Primers were designed to amplify the chloramphenicol resistance gene from the pKD3 plasmid (PStx1-K1 and PStx1-K2, PStx2-K1 and PStx2-K2). The purified PCR product was electroporated into EHEC O157:H7 cells carrying the λ Red recombinase expression plasmid pKD46. Pairs of primers located inside the chloramphenicol resistance cassette or between the Stx gene and the chloramphenicol resistance cassette were used to verify the deletion of Stx1 and Stx2 by PCR. EHEC O157:H7 clones were grown on LB medium containing 25 μg/ml chloramphenicol to select for chloramphenicol resistance. The pKD46 plasmid was cured by growing bacteria at 42°C. The construction of the ΔStx1 and ΔStx2 EHEC O157:H7 strains is shown in Figure S2, and the sequences of the primers used are shown in Table S1.
Purification of Stx2
Stx2 was purified from EHEC O157:H7 using an affinity chromatography scheme. To purify Stx2 of EHEC O157:H7 by affinity chromatography,the immno-affinity chromatography column was prepared by Stx2 A subunit-specific antibody S1D8 coupling to CNBr-activated sepharose 4B matrix (GE Healthcare, 17043001). Mouse-monoclonal antibody S1D8 was obtained by the hybridoma technique.Citation37 The samples containing Stxs were purified using an affinity chromatography column (GE Healthcare, 17040401). The relative molecular weights of Stx2 A and B subunits were 32,000 and 7,500 confirmed by SDS-PAGE, respectively. The toxin was 1ethal to mice with LD100 of 5 ng.
siRNA assay
The ATG12 (human, sc-72578), BECN1 (human, sc-29797), NUPR1 (human, sc-40792), DDIT3/GADD153 (human, sc-35437), ATF4 (human, sc-35112), and TRIB3 (human, sc-44426) siRNAs and control siRNA (sc-44230) were purchased from Santa Cruz Biotechnology. All siRNA transfections were performed using the Dharmafect 1 transfection reagent (Thermo Scientific, T-2001-03). Caco-2 cells were transfected with 50 nM siRNA for 24 h, followed by treatments; protein knockdown was assessed using western blot analysis.
Transmission electron microscopy
Caco-2 cells were collected and fixed in a solution containing 2.5% glutaraldehyde in 0.1 M sodium cacodylate for 2 h, postfixed with 1% OsO4 for 1.5 h, and washed and stained in 3% aqueous uranyl acetate for 1 h. The samples were then washed again, dehydrated with a graded alcohol series, and embedded in Epon-Araldite resin (Canemco, 034). Ultrathin sections were cut using a Reichert ultramicrotome (Reichert, United States), counterstained with 0.3% lead citrate, and examined on a Philips EM420 electron microscope (Philips, United Kingdom).
Confocal microscopy
Caco-2 cells were transfected with a plasmid expressing GFP-MAP1LC3B. After 24 h, the cells were treated with Stx2 for 24 h. After infection, the cells were washed with PBS and fixed by incubation in 4% paraformaldehyde for 10 min at 37°C. We used a Radiance 2000 laser scanning confocal microscope for confocal microscopy, followed by image analysis with the LaserSharp 2000 software (Bio-Rad). Images were acquired in sequential scanning mode.
Western blot analysis
Cells were washed with ice-cold PBS and then lysed in Triton X-100/glycerol buffer (50 mM Tris-HCl, 4 mM EDTA, 2 mM EGTA [Sigma, 03779], 1 mM dithiothreitol, and 25% w/v sucrose [Sigma, 84097], pH 8.0, supplemented with 1% Triton X-100 [Sigma, T9284] and protease inhibitors [Sigma, P7626]). After centrifugation at 5,000 g for 15 min at 4°C, the protein concentration was measured using a BCA protein assay kit (Pierce, 23227). The lysates were separated using SDS-PAGE and were transferred to polyvinylidene difluoride membranes (Sigma, P2563). The membranes were blocked with 5% nonfat dry milk in Tris-buffered saline (Sigma, T5912, pH 7.4) containing 0.05% Tween 20 (Sigma, P1379) and were incubated with primary anti-human antibodies and horseradish peroxidase-conjugated secondary anti-mouse antibodies (Jackson Immuno Research Laboratories, 115-035-003) or anti-rabbit antibodies (Jackson Immuno Research Laboratories, 111-035-003) according to the manufacturer's instructions. The protein of interest was visualized using the SuperSignal® West Dura Duration substrate reagent (Thermo, 34080).
MTT assay
MTT assays were performed in a 96-well plate according to the manufacturer's instructions (Sigma, TOX1). After the indicated treatments, the cells were incubated with MTT at a final concentration of 5 mg/L. After 1–2 h, the medium was removed, and the cells were dissolved in MTT solubilization solution (Sigma, TOX1). The absorbance at 590 nm (A590) was determined for each well using a microplate reader (Bio-Rad). After subtracting the background absorbance, the A590 value of the treated cells was divided by that of the untreated cells to determine the percentage of viable cells.
Acridine orange staining
In acridine orange-stained cells, the cytoplasm and nucleus appear bright green and dim red, respectively, and the acidic compartments appear bright red.Citation38 The intensity of the red fluorescence is proportional to the degree of acidity. After receiving the specified treatments, the cells were incubated with 1 mg/ml acridine orange (Sigma, A8097) solution (H2O) for 15 min in drug-free medium at 37°C and were washed with PBS. Then, the cells were trypsinized and analyzed using a FACScan flow cytometer and CellQuest software, as previously published.Citation39 Statistical analyses were performed as described above.
Monodansylcadaverine staining
MDC staining was used to quantify the induction of autophagy in Caco-2 cells. Following treatment, the cells were stained with 10 mM MDC (Sigma, 30432) for 10 min at 37°C and were collected and fixed in 3% paraformaldehyde in PBS for 30 min. The cells were then trypsinized and analyzed by flow cytometry using a FACScan cytometer and CellQuest (BD Biosciences) software.
ANXA5-FITC/PI staining assay
The ratio of cell death cells was measured with an ANXA5/annexin V–FITC/PI Detection Kit (Invitrogen, V13242) according to the manufacturer's protocol. Briefly, the treated cells were trypsinized with 0.5 ml of 0.25% trypsin for 3 min, and the cells were harvested and resuspended in 400 μl binding buffer. After adding 5 μl ANXA5–FITC and 5 μl PI into the cell suspension, respectively, the samples were incubated for 15 min at room temperature in the dark. Cell death was detected using flow cytometry (BD FACScan Flow cytometer, United States).
Cell death assay
The cells were trypsinized with 0.5 ml of 0.25% trypsin for 3 min, collected, and resuspended in 1 ml of PBS. The cells were then incubated with 0.5 ml of the staining solution (10 μg/ml PI) at 37°C for 30 min in the dark. Cell death was detected using flow cytometry (BD FACScan Flow cytometer).
Statistical analysis
The results are expressed as the mean ± SD of at least 3 separate experiments performed in triplicate. The differences between the groups were determined with the SPSS 13.0 software (SPSS, United States). ANOVA test was used to analyze the data. The differences were considered significant at P<0.05. Statistically significant differences are indicated by asterisks (*P<0.05, **P<0.01).
Disclosure of Potential Conflicts of Interest
No potential conflicts of interest were disclosed.
Supplemental Material
Supplemental data for this article can be accessed on the publisher's website.
Supplemental_files.pdf
Download PDF (293.9 KB)Acknowledgments
We are grateful to Prof. Jiqing Lian (Third Military Medical University, Chongqing, China) and Dr. Marissa Wang (Boston University) for critical reading and editing of the manuscript. We also thank Dr. Tamotsu Yoshimori for providing the GFP-MAP1LC3B plasmid.
Funding
This study was supported by a grant from National Natural Science Foundation of China (NSFC, No. 81371770) and the project of medical science and technology for training youth scholars of PLA (14QNP054).
References
- Pennington H. Escherichia coli O157. Lancet 2010; 376:1428-35.
- Mead PS, Griffin PM. Escherichia coli O157:H7. Lancet 1998; 352:1207-12.
- Lentz EK, Leyva-Illades D, Lee MS, Cherla RP, Tesh VL. Differential response of the human renal proximal tubular epithelial cell line HK-2 to Shiga toxin types 1 and 2. Infect Immun 2011; 79:3527-40.
- Lee MS, Cherla RP, Jenson MH, Leyva-Illades D, Martinez-Moczygemba M, Tesh VL. Shiga toxins induce autophagy leading to differential signalling pathways in toxin-sensitive and toxin-resistant human cells. Cell Microbiol 2011; 13:1479-96.
- Lebeis SL, Sherman MA, Kalman D. Protective and destructive innate immune responses to enteropathogenic Escherichia coli and related A/E pathogens. Future Microbiol 2008; 3:315-28.
- Nakao H, Takeda T. Escherichia coli Shiga toxin. J Nat Toxins 2000; 9:299-313.
- Lee MS, Cherla RP, Tesh VL. Shiga toxins: intracellular trafficking to the ER leading to activation of host cell stress responses. Toxins (Basel) 2010; 2:1515-35.
- Tesh VL. Activation of cell stress response pathways by Shiga toxins. Cell Microbiol 2012; 14:1-9.
- Buchberger A, Bukau B, Sommer T. Protein quality control in the cytosol and the endoplasmic reticulum: brothers in arms. Mol Cell 2010; 40:238-52.
- Xu C, Bailly-Maitre B, Reed JC. Endoplasmic reticulum stress: cell life and death decisions. J Clin Invest 2005; 115:2656-64.
- Boyce M, Yuan J. Cellular response to endoplasmic reticulum stress: a matter of life or death. Cell Death Differ 2006; 13:363-73.
- Stefani IC, Wright D, Polizzi KM, Kontoravdi C. The role of ER stress-induced apoptosis in neurodegeneration. Curr Alzheimer Res 2012; 9:373-87.
- Lee SY, Lee MS, Cherla RP, Tesh VL. Shiga toxin 1 induces apoptosis through the endoplasmic reticulum stress response in human monocytic cells. Cell Microbiol 2008; 10:770-80.
- Carracedo A, Lorente M, Egia A, Blazquez C, Garcia S, Giroux V, et al. The stress-regulated protein p8 mediates cannabinoid-induced apoptosis of tumor cells. Cancer Cell 2006; 9:301-12.
- Hammadi M, Oulidi A, Gackiere F, Katsogiannou M, Slomianny C, Roudbaraki M, et al. Modulation of ER stress and apoptosis by endoplasmic reticulum calcium leak via translocon during unfolded protein response: involvement of GRP78. FASEB J 2013; 27:1600-9.
- Lai E, Bikopoulos G, Wheeler MB, Rozakis-Adcock M, Volchuk A. Differential activation of ER stress and apoptosis in response to chronically elevated free fatty acids in pancreatic beta-cells. Am J Physiol Endocrinol Metab 2008; 294:E540-50.
- Deretic V. Autophagy in innate and adaptive immunity. Trends Immunol 2005; 26:523-8.
- Levine B, Kroemer G. Autophagy in the pathogenesis of disease. Cell 2008; 132:27-42.
- Salazar M, Carracedo A, Salanueva IJ, Hernandez-Tiedra S, Lorente M, Egia A, et al. Cannabinoid action induces autophagy-mediated cell death through stimulation of ER stress in human glioma cells. J Clin Invest 2009; 119:1359-72.
- Smith DM, Patel S, Raffoul F, Haller E, Mills GB, Nanjundan M. Arsenic trioxide induces a beclin-1-independent autophagic pathway via modulation of SnoN/SkiL expression in ovarian carcinoma cells. Cell Death Differ 2010; 17:1867-81.
- Li DD, Guo JF, Huang JJ, Wang LL, Deng R, Liu JN, et al. Rhabdastrellic acid-A induced autophagy-associated cell death through blocking Akt pathway in human cancer cells. PLoS One 2010; 5:e12176.
- Chen YJ, Huang WP, Yang YC, Lin CP, Chen SH, Hsu ML, et al. Platonin induces autophagy-associated cell death in human leukemia cells. Autophagy 2009; 5:173-83.
- Cherla RP, Lee SY, Tesh VL. Shiga toxins and apoptosis. FEMS Microbiol Lett 2003; 228:159-66.
- Yoshimura K, Tanimoto A, Abe T, Ogawa M, Yutsudo T, Kashimura M, et al. Shiga toxin 1 and 2 induce apoptosis in the amniotic cell line WISH. J Soc Gynecol Investig 2002; 9:22-6.
- Gu J, Liu Y, Yu S, Wang H, Wang Q, Yi Y, et al. Enterohemorrhagic Escherichia coli trivalent recombinant vaccine containing EspA, intimin and Stx2 induces strong humoral immune response and confers protection in mice. Microbes Infect 2009; 11:835-41.
- Ma Y, Mao X, Li J, Li H, Feng Y, Chen H, et al. Engineering an anti-Stx2 antibody to control severe infections of EHEC O157:H7. Immunol Lett 2008; 121:110-5.
- Sandvig K. Shiga toxins. Toxicon 2001; 39:1629-35.
- Tesh VL. Induction of apoptosis by Shiga toxins. Future Microbiol 2010; 5:431-53.
- Sandvig K, van Deurs B. Endocytosis, intracellular transport, and cytotoxic action of Shiga toxin and ricin. Physiol Rev 1996; 76:949-66.
- Matsumoto H, Miyazaki S, Matsuyama S, Takeda M, Kawano M, Nakagawa H, et al. Selection of autophagy or apoptosis in cells exposed to ER-stress depends on ATF4 expression pattern with or without CHOP expression. Biol Open 2013; 2:1084-90.
- Bachar-Wikstrom E, Wikstrom JD, Kaiser N, Cerasi E, Leibowitz G. Improvement of ER stress-induced diabetes by stimulating autophagy. Autophagy 2013; 9:626-8.
- Tirupathi Pichiah PB, Suriyakalaa U, Kamalakkannan S, Kokilavani P, Kalaiselvi S, SankarGanesh D, et al. Spermidine may decrease ER stress in pancreatic beta cells and may reduce apoptosis via activating AMPK dependent autophagy pathway. Med Hypotheses 2011; 77:677-9.
- Shen M, Wang L, Yang G, Gao L, Wang B, Guo X, et al. Baicalin protects the cardiomyocytes from ER stress-induced apoptosis: inhibition of CHOP through induction of endothelial nitric oxide synthase. PLoS One 2014; 9:e88389.
- Guo FJ, Liu Y, Zhou J, Luo S, Zhao W, Li X, et al. XBP1S protects cells from ER stress-induced apoptosis through Erk1/2 signaling pathway involving CHOP. Histochem Cell Biol 2012; 138:447-60.
- Linnankoski J, Makela J, Palmgren J, Mauriala T, Vedin C, Ungell AL, et al. Paracellular porosity and pore size of the human intestinal epithelium in tissue and cell culture models. J Pharm Sci 2010; 99:2166-75.
- Serra-Moreno R, Acosta S, Hernalsteens JP, Jofre J, Muniesa M. Use of the lambda Red recombinase system to produce recombinant prophages carrying antibiotic resistance genes. BMC Mol Biol 2006; 7:31.
- Gazi MI. A method for producing monoclonal antibodies to human oral epithelial cells by the hybridoma technique. J Biol Buccale 1986; 14:273-80.
- Ling E, Shirai K, Kanekatsu R, Kiguchi K. Classification of larval circulating hemocytes of the silkworm, Bombyx mori, by acridine orange and propidium iodide staining. Histochem Cell Biol 2003; 120:505-11.
- Tang B, Li N, Gu J, Zhuang Y, Li Q, Wang HG, et al. Compromised autophagy by MIR30B benefits the intracellular survival of Helicobacter pylori. Autophagy 2012; 8:1045-57.
