
Abstract
The selective degradation of mitochondria by the process of autophagy, termed mitophagy, is one of the major mechanisms of mitochondrial quality control. The best-studied mitophagy pathway is the one mediated by PINK1 and PARK2/Parkin. From recent studies it has become clear that ubiquitin-ligation plays a pivotal role and most of the focus has been on the role of ubiquitination of mitochondrial proteins in mitophagy. Even though ubiquitination is a reversible process, very little is known about the role of deubiquitinating enzymes (DUBs) in mitophagy. Here, we report that 2 mitochondrial DUBs, USP30 and USP35, regulate PARK2-mediated mitophagy. We show that USP30 and USP35 can delay PARK2-mediated mitophagy using a quantitative mitophagy assay. Furthermore, we show that USP30 delays mitophagy by delaying PARK2 recruitment to the mitochondria during mitophagy. USP35 does not delay PARK2 recruitment, suggesting that it regulates mitophagy through an alternative mechanism. Interestingly, USP35 only associates with polarized mitochondria, and rapidly translocates to the cytosol during CCCP-induced mitophagy. It is clear that PARK2-mediated mitophagy is regulated at many steps in this important quality control pathway. Taken together, these findings demonstrate an important role of mitochondrial-associated DUBs in mitophagy. Because defects in mitochondria quality control are implicated in many neurodegenerative disorders, our study provides clear rationales for the design and development of drugs for the therapeutic treatment of neurodegenerative diseases such as Parkinson and Alzheimer diseases.
Abbreviations:
- CCCP
- carbonyl cyanide m-chlorophenylhydrazone
- Cer, cerulean
- DMSO, dimethyl sulfoxide
- DsRed, Discosoma sp. red fluorescent protein
- DUB
- deubiquitinating enzyme
- GAPDH, glyceraldehyde 3-phosphate dehydrogenase
- GFP, green fluorescent protein
- HA, human influenza hemagglutinin
- l-USP35, long form of ubiquitin specific peptidase 35
- MFN2, mitofusin 2
- MTS
- mitochondrial targeting sequence
- OMM, outer mitochondrial membrane
- PARK2, parkin RBR E3 ubiquitin protein ligase
- PINK1, PTEN-induced putative kinase 1
- s-USP35, short form of ubiquitin specific peptidase 35
- SYNJ2BP, synaptojanin 2 binding protein
- TOMM20, translocase of outer mitochondrial membrane 20 homolog (yeast)
- USP, ubiquitin specific peptidase
Introduction
A healthy mitochondrial network is essential to the survival of most eukaryotic cells. Mitochondrial damage can lead to a plethora of toxic cellular events such as the loss of mitochondrial potential, oxidative stress, and the release of apoptotic factors resulting in cell death. Recently, mitochondrial health and quality control has been implicated in neurodegenerative diseases such as Parkinson and Alzheimer diseases.Citation1,2 The fidelity of the mitochondrial network is orchestrated by 2 major pathways: (1) regulated mitochondrial dynamics (the balanced fusion and fission events) are essential to maintain proper mitochondrial distribution and morphology; and (2) the degradation of damaged mitochondria by autophagy, a process termed mitophagy.Citation3,4 The best-characterized mitophagy pathway is orchestrated by the dynamic mitochondrial recruitment of PINK1 (PTEN-induced putative kinase 1)-PARK2/Parkin.Citation5-7 Upon mitochondrial depolarization, likely the result of oxidative damage, PINK1 is localized to and stabilized on the outer mitochondrial membrane (OMM). PINK1 then recruits PARK2, an E3-ubiquitin ligase, from the cytoplasm to the OMM.Citation8 PARK2 can ubiquitinate a variety of OMM proteins.Citation9 Many of these OMM proteins are quickly degraded in a proteasome-dependent manner.Citation10 Ubiquitination also serves as a signal to recruit SQSTM1 and HDAC6,Citation11,12 which are autophagy receptors that form a functional bridge between damaged mitochondria and phagophores.Citation13 The phagophores then engulf the mitochondria and fuse with lysosomes, where lysosomal hydrolases degrade the damaged mitochondria and recycle the metabolites, ensuring cellular survival during this stress.Citation14
Several reports have provided insight into how mitophagy activation occurs and provide clues about the regulation of mitophagy. It is believed that PARK2 is autoinhibited and localized to the cytosol under basal conditions.Citation15 Upon mitochondrial damage and subsequent mitophagy activation, PARK2 is recruited to the OMM through direct binding to PINK1.Citation8 Subsequently, the E3-ubiquitin ligase activity of PARK2 is stimulated by PINK1 phosphorylation.Citation16 Furthermore, it has been shown that PINK1-phosphorylated MFN2 is crucial to recruit PARK2 to the damaged mitochondria.Citation17 However, once PARK2 is recruited to the mitochondria, MFN2 undergoes rapid degradation in a PARK2-mediated ubiquitin ligation and proteasome-dependent manner.Citation10 It is clear that many stages of this pathway need to be regulated in order for the cell to orchestrate a proper mitophagic response during stress. Notably, the rapid association of PARK2 to the OMM of damaged mitochondria is essential for efficient mitophagy induction and will serve as a critical checkpoint in regulating this quality control pathway.
Recently, the role of ubiquitin in PARK2 activation has been reported by several groups. Ubiquitination by both conventional ubiquitin and PINK1-phosphorylated ubiquitin is required for the activation and mitochondrial recruitment of PARK2 during mitophagy, implicating that ubiquitin is a critical regulator of mitophagy.Citation16,18 Notably, ubiquitination is a reversible process. Deubiquitinating enzymes (DUBs, ~100 in the human genome) can remove ubiquitin and ubiquitin-like conjugates from their substrates.Citation19 Our current knowledge of mitochondrial DUBs is very limited. Until recently, ubiquitin-specific peptidase 30 (USP30) was the only known mitochondrial DUB residing on the OMM that regulates mitochondrial morphology.Citation20 We hypothesized that DUBs may play an important role in mitophagy regulation possibly by counteracting the activity of PARK2. We proposed that in addition to USP30, there are other DUBs that either reside on the mitochondria, or are dynamically associated with damaged mitochondria and participate in the mitophagy pathway.
Here, we report the roles of 2 mitochondrial-associated DUBs in mitophagy. We have identified 2 mitochondrial DUBs: USP30 and USP35 in a DUB-localization screen, both of which, we show, regulate mitophagy. While USP30 is a mitochondrial-resident protein, USP35 is a complex of 2 isoforms (s- and l-) that are localized to healthy polarized mitochondria, but dissociate from damaged depolarized mitochondria during mitophagy induction. Our data demonstrate a new and important role for the USP family of DUBs in regulating mitochondrial quality control and cellular health, and could suggest novel therapeutic approaches in combating neurodegenerative diseases like Parkinson disease.
Results
USP30 and USP35 are localized to the mitochondria
To conduct a localization screen of DUBs, we obtained a library containing 63 cDNAs encoding human DUBs (Table S1). All constructs were fused with the open reading frame (ORF) of green fluorescent protein (GFP) at either the C terminus or the N terminus as indicated. We expressed each construct in COS7 cells, in which intracellular structures are well resolved due to cytoplasm expansion. The localization of the DUBs was categorized as mitochondrial (by costaining with a mitochondrial protein ATP5A1), as nuclear (by costaining with the DNA-dye DAPI), or generally observed and characterized as reticular, diffused cytoplasmic, and aggregate. Notably, USP30 and s-USP35 (short-USP35) showed clear mitochondrial localization (). USP30 has been previously reported to target to mitochondria, however the cellular localization of s-USP35 was not known.Citation20 Interestingly, there are 2 isoforms of USP35, short-USP35 (s-USP35) and long-USP35 (l-USP35), and only s-USP35 contains a putative N-terminal mitochondrial-targeting sequence (MTS) (Fig. S1). Most DUBs however were found in the nucleus or other subcellular compartments such as USP20-GFP, which is diffused cytoplasm ().
Figure 1. USP30 and USP35 are mitochondrial DUBs that may affect mitophagy. (A-C) HeLa cells expressing USP30-GFP (A), USP35-GFP (B), or USP20-GFP (C) were fixed and immunostained for GFP 24 h after transfection. anti-ATP5A1 antibody was used to identify mitochondria. (D-I) HeLa cells stably expressing GFP-PARK2 were transfected with siRNA against USP30 for 72 h. Cells were treated with 10 µM CCCP for 0, 1, 3, and 6 h as indicated and the cell lysates were examined for MFN2, VDAC1, and ubiquitinated-TOMM20 levels by immunoblotting. The average of normalized density of MFN2 and monoubiquitinated TOMM20 was plotted (n = 3, P < 0.05). (F-I) The same experiment was performed with cells that received siRNA against USP35 (F) or USP20 (H). The average of normalized density of MFN2 and monoubiquitinated TOMM20 was also analyzed (G-I). Scale bar: 10 µm.
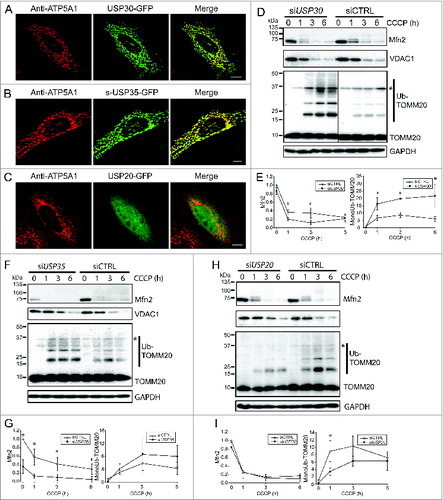
As a first test to determine whether the mitochondrial-localized USP30 and USP35 affect mitophagy, we depleted the expression of either DUB with siRNA in HeLa cells stably expressing GFP-PARK2 and induced mitophagy using carbonyl cyanide m-chlorophenyl hydrazone (CCCP). This is a well-established protocol used to characterize many aspects of the PARK2-mediated mitophagy pathway.Citation8-11 We also reduced the expression of a nonmitochondrial DUB, USP20, as a control. The knockdown of each DUB was confirmed with quantitative PCR (qPCR) (Fig. S2A). In order to assess whether mitophagy was altered, we measured the abundance of 3 outer-mitochondrial membrane (OMM) proteins during PARK2-mediated mitophagy. MFN2, VDAC1 and TOMM20 have been previously shown to be degraded at the early stages of PARK2-mediated mitophagy.Citation10 Cells with USP30 knockdown (siUSP30) and control knockdown (siCTRL) had similar basal levels of MFN2, VDAC1, and TOMM20. As expected, MFN2 and VDAC1 were rapidly degraded upon the activation of PARK2-mediated mitophagy in all conditions (). Quantification of MFN2 levels in siUSP30 cells showed a significantly lower MFN2 abundance in comparison to siCTRL cells at both 1 and 3 h of CCCP treatment (), suggesting a more rapid degradation of MFN2 during mitophagy. However, there was no significant difference in VDAC1 level between siCTRL cells and siUSP30 cells during mitophagy (, Fig. S2B). We also observed significantly higher levels of TOMM20 monoubiquitination in siUSP30 cells than that of siCTRL cells during early stages of mitophagy activation ().
The knockdown of both s-USP35 and l-USP35 (siUSP35) led to distinct results compared to the knockdown of USP30. Before CCCP treatment, the levels of MFN2 in the siUSP35 cells were significantly lower compared to siCTRL cells (). However, the knockdown of USP35 did not change mitochondrial morphology under basal conditions, suggesting that the lowered MFN2 level did not affect mitochondria morphology in siUSP35 cells (). siUSP35 and siCTRL cells had similar levels of VDAC1 before and during mitophagy (, Fig. S2C). Although the monoubiquitinated TOMM20 levels were qualitatively higher in the siUSP35 cells than that of siCTRL cells, the difference was not statistically significant (). Thus these RNAi studies suggest that USP35 may act to generally stabilize MFN2 during homeostasis.
Figure 2. Detailed analysis of USP30 and USP35 localization. (A) HeLa cells transfected with USP30-HA for 16 h were treated with either CCCP or DMSO for 2 h. These cells were fixed and immunostained with anti-TOMM20 (red) and anti-HA antibodies (green). (B) s-USP35-HA was expressed in HeLa cells for 16 h. Cells were then treated with DMSO or CCCP for 2 h. In order to recover mitochondrial potential, cells treated with CCCP for 2 h were washed once with 1× DPBS and were incubated in regular growth media for 2 h. Cells were then fixed and immunostained with anti-HA antibody. (C) HeLa cells expressing s-USP35 were treated with DMSO, CCCP, or allowed for potential recovery for 2 h. Mitochondrial fractions (mito) were isolated from the cytosolic fraction (cyto). Total cell lysates (TCF), cyto, and mito fractions were examined by SDS-PAGE and immunoblotting. (D) FLAG-l-USP35 was cotransfected with mitochondrial-targeting RFP (mtRFP) for 16 h in HeLa cells. Cells were fixed and immunostained with anti-FLAG antibody. (E) HeLa cells were cotransfected with FLAG-l-USP35 and s-USP35-HA and then treated with CCCP or DMSO for 2 h as indicated. Before fixation, cells were treated with digitonin to remove the cytosolic signal of l-USP35. Fixed cells were immunostained with anti-FLAG and anti-HA antibodies. (F) FLAG-l-USP35 and s-USP35-HA were transfected individually or cotransfected into HeLa cells for 24 h. Cells were then treated with CCCP or DMSO for 2 h. Cleared cell lysates were immunoprecipitated for FLAG tagged proteins using anti-FLAG antibody and protein A-agarose beads. Protein contents were analyzed on SDS-PAGE and immunoblot with anti-FLAG and anti-HA antibodies. Scale bar: 10 µm.
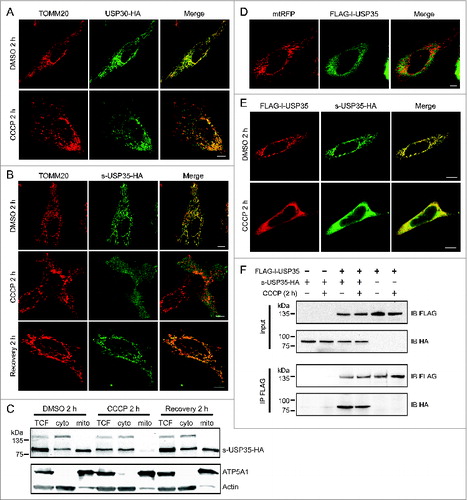
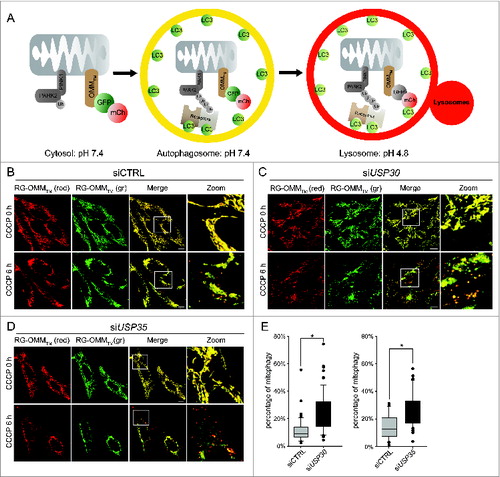
Figure 3. USP30 and USP35 delay PARK2-mediated mitophagy. (A) Schematic representation of the mCherry-GFP-lysosome assay. The ORF of mCherry and GFP in tandem is tagged with an outer mitochondrial membrane-targeting transmembrane domain (RG-OMMTM). When localized in the cytosol and autophagosomes, mCherry and GFP are both fluorescent, resulting in yellow mitochondria. In a low pH environment such as the lysosomes, only the signal of GFP is quenched, resulting in red mitochondria. (B-D) HeLa cells treated with nontargeting siRNA (siCTRL) (B), siRNA against USP30 (siUSP30) (C) or siRNA against USP35 (siUSP35) (D) were cotransfected with RG-OMMTM and Cer-PARK2 (not shown) for 16 h. Cells were treated with CCCP, E-64, and leupeptin, and were imaged live at 0 h and 6 h of the treatment. (E) Quantification of mCherry-GFP-lysosome assay for siUSP30 and siUSP35 versus siCTRL. The total area of mitochondria and the area of red mitochondria in each cell was measured with imaging software Volocity®6.3. The percentages of mitochondria in lysosome of cells from each treatment were plotted in box plots, and rank-sum significance test was performed. (n = 66 per treatment * P < 0.05). Scale bar: 10 µm.
As a control for these data, we treated cells with siRNA against USP20 (siUSP20), and found that it did not alter the level of MFN2 or VDAC1 before or during mitophagy (, Fig. S2D). Unexpectedly, siUSP20 cells had a slightly lower level of ubiquitinated TOMM20 compared to siCTRL cells during mitophagy (). Together, these results suggest that USP30 and USP35 affect MFN2 levels during mitophagy and at basal conditions, respectively. Moreover, the absence of either DUB affects TOMM20 ubiquitination during mitophagy. Therefore, we propose that USP30 and USP35 are regulators of PARK2-mediated mitophagy.
Differential association of USP30 and USP35 with mitochondria during mitochondrial depolarization
To gain further insight into the action of USP30 and USP35 during mitochondrial damage and mitophagy, we analyzed the subcellular localization of both USP30 and the USP35 isoforms during mitochondrial depolarization. Previous literature has shown that USP30 contains a transmembrane domain at the N terminus, which likely anchors USP30 to the OMM.Citation20 Indeed, USP30 colocalized with mitochondria both under basal conditions and after CCCP treatment (). In agreement with our initial screen, s-USP35 also localized to mitochondria under basal conditions. However, s-USP35 dissociated from the mitochondria and instead localized to the cytosol when cells were treated with CCCP (), suggesting that the association of s-USP35 with mitochondria depends on mitochondrial membrane potential. To test this hypothesis, we treated s-USP35 expressing cells with CCCP for 2 h, then allowed the cells to recover their mitochondrial potential for 2 h by removing CCCP. Consistent with our prediction, s-USP35 was relocalized to mitochondria once the membrane potential was recovered. Similar experiments using live-cell imaging of cells expressing s-USP35-GFP demonstrate that the s-USP35 was able to leave mitochondria and relocalize back to mitochondria depending on the mitochondrial potential (Fig. S3).
We further demonstrated the translocation of s-USP35 on and off mitochondria by cell fractionation (). In DMSO-treated cells, there was more s-USP35 in the mitochondrial fraction than the cytosolic fraction. However, in CCCP-treated cells, the majority of s-USP35 was found in the cytosolic fraction. Similar to what we observed in immunofluorescence and live-cell imaging (, Fig. S3), s-USP35 relocalized to the mitochondrial fraction upon mitochondrial membrane potential recovery, suggesting that s-USP35 cycles between the mitochondria and cytosol based on the mitochondrial health.
When l-USP35 was expressed alone, it was localized to the cytosol (). This is expected because unlike s-USP35, l-USP35 does not possess an N-terminal MTS (Fig. S1). However, when expressed together, s-USP35 and l-USP35 were both localized to mitochondria (), suggesting that s-USP35 recruits l-USP35 to mitochondria. During CCCP treatment, s-USP35 and l-USP35 both translocated from the mitochondria to the cytosol (). We have further demonstrated that s-USP35 interacts with l-USP35 in both basal and CCCP-treated conditions by performing a coimmunoprecipitation experiment (). Together, these results demonstrate that s-USP35 forms a complex with l-USP35 and this USP35 complex is dynamically associated with mitochondria based on membrane potential, indicating an active role for this DUB during mitochondrial quality control pathways induced during stress.
A quantitative assay for measuring mitophagy
Next, we examined whether USP30 and the USP35 complex can affect the rate of mitophagy, which is the rate that mitochondria are delivered to lysosomes for degradation. The conventional techniques that measure mitophagy require subjectively counting cells or measuring the degradation of stable mitochondria markers after prolonged CCCP treatment (>24 h).Citation9,10 These techniques lack the sensitivity to monitor and quantify mitochondria in lysosomes at earlier times points. For this reason we developed a technique that quantifies the percentage of mitochondria undergoing mitophagy in live cells similar to an assay we developed for pexophagy ().Citation21 We have generated a reporter construct, in which the 2 fluorescent proteins mCherry and mGFP in tandem are tagged with the transmembrane domain of synaptojanin 2 binding protein (SYNJ2BP) (mCherry-mGFP-SYNJ2BP, herein referred to as RG- OMMTM). When localized to the mitochondrial OMM and facing the cytosol, both mGFP and mCherry are fluorescent. However, due to the difference in their pKa, the fluorescent signal of mGFP, but not of mCherry, is quenched in a lower pH environment such as the lysosome. Therefore, mitochondria that are localized in the lysosome will only emit a fluorescent signal from mCherry and not mGFP (). Using this reporter, we can accurately quantify the area of ‘red-only’ mitochondria and the area of total mitochondria in order to determine the percentage of mitochondria in lysosomes.
We have previously demonstrated that damaged mitochondria begin to colocalize with lysosomes at 3 h after mitophagy activation.Citation22 In order to allow more mitochondria to reach the lysosomes, we measured the percentage of mitophagy 6 h after CCCP treatment. HeLa cells were transfected with the RG-OMMTM reporter and Cer-PARK2 (not shown in figures), and were treated with CCCP. Six h after CCCP treatment, red mitochondria were visible in control siRNA-, siUSP30-, and siUSP35-treated cells (). Quantification revealed that both siUSP30 and siUSP35 cells had a significantly higher percentage of mitochondria in lysosomes; 24.0% and 27.6% respectively compared to 14.3% in siCTRL cells (). Hence, depleting cells of USP30 or the USP35 complex accelerates PARK2-mediated mitophagy, which strongly suggests that USP30 and USP35 function to directly regulate PARK2-mediated mitophagy.
Overexpression of USP30 and USP35 delays PARK2-mediated mitophagy
To further understand the role of USP30 and USP35 in PARK2-mediated mitophagy, we performed mitochondrial clearance assay in cells stably expressing GFP-PARK2. In these assays, cells stably expressing GFP-PARK2 and a mitochondria matrix marker mito-DsRed (GPRM) were treated with CCCP for 24 h. It was previously shown that 90% of the HeLa cells overexpressing PARK2 had no detectable mitochondrial-like structure or mitochondrial matrix protein staining 48 h after CCCP treatment.Citation9 To determine whether USP30 or USP35 can modulate mitophagy, we overexpressed USP30-HA or s-USP35-HA in the GPRM cells, and treated them with 10 µM CCCP for 24 h. Cells were then fixed and stained for HA-tag in order to identify the cells transfected with the DUB protein. We considered a cell had cleared its mitochondria when the residual mito-DsRed signal was not colocalized with GFP-PARK2 (Fig. S4). Using this assay, we found that in untransfected control cells, 62.6 ± 2.8% of the cells had cleared their mitochondria. When expressing USP30 or s-USP35, 43.2 ± 5.9% and 32.8 ± 7.2% of the cells had cleared of their mitochondrial structure, respectively (). These results suggest that both USP30 and USP35 can delay mitochondrial clearance by PARK2.
Figure 4. USP30, but not USP35 delays PARK2 recruitment to the mitochondria. (A) GPRM cells were transfected with USP30-HA, s-USP35-HA, or s-USP35MTSΔ-HA for at least 16 h. Cells were treated with 10 µM CCCP for 24 h prior to fixing and staining with an anti-HA antibody. The percentage of the cells with cleared mitochondria was calculated for each treatment (n = 3, P < 0.05). (B) GPRM cells were transfected with USP30-HA, or s-USP35-HA for 16 h. Cells were then treated with 10 µM CCCP and fixed after 30 min or 60 min. Cells were treated with digitonin for 2 min prior to fixation in order to remove nontargeted GFP-PARK2. To visualize USP30, cells were immunostained with anti-HA antibody. Because USP35 is localized to the cytosol during CCCP treatment, USP35 is not detectable in the cells treated with digitonin, however, the transfection efficiency was 75 ± 15% (Fig. S4). Manders coefficient was measured with Volocity®6.3. The average of Manders coefficient was shown (n = 3, * P < 0.05). (C and D) GPRM cells were transfected with siRNA against USP30 (siUSP30) and siRNA against USP35 complex (siUSP35) for 72 h. Nontargeting siRNA (siCTRL) was transfected as control. Cells were treated with 10 µM CCCP for 30 and 60 min. Protein contents were analyzed by immunoblotting with anti-MFN2 antibody. (E) GPRM cells were transfected with control siRNA, siRNA against USP30 and siRNA against USP35 for 72 h. Cells were treated with 10 µM CCCP or DMSO for 30 min. PARK2 was immunoprecipitated from the cell lysates with anti-GFP antibody and Protein A-sepharose beads. The content of the immunoprecipitation was analyzed by SDS-PAGE and immunoblotting with anti-PARK2 and anti-MFN2 antibodies.
Because the mitochondrial pool of s-USP35 dissociates from mitochondria after CCCP treatment, we wondered whether the MTS at the N-terminal of s-USP35 is important for its function. We generated a mutant version of s-USP35-HA, which lacked its MTS (s-USP35MTSΔ-HA). s-USP35MTSΔ-HA is localized to the cytosol under both basal conditions and during CCCP treatment (Fig. S5). We expressed this truncated form of s-USP35 in cells and measured mitochondrial clearance after 24 h CCCP treatment. Surprisingly, s-USP35MTSΔ-HA also significantly reduced (similar to wild-type s-USP35) the percentage of the cells that had cleared mitochondria to 39.5% ± 5.5% (). This may suggest that USP35 plays additional roles in the cytosol to delay PARK2-mediated mitophagy.
Overexpressing USP30 but not USP35 delays PARK2 recruitment
In cells with a healthy mitochondrial network, PARK2 is diffused in the cytosol and not on mitochondria.Citation9 However, following mitophagy activation by CCCP treatment, PARK2 is recruited to mitochondria within 1 h (Fig. S6). One possible mechanism to regulate mitophagy progression would be to delay PARK2 recruitment to damaged mitochondria. To investigate how USP30 and USP35 regulate mitophagy, we tested whether USP30 and USP35 delayed PARK2 recruitment to the depolarized mitochondria. We transfected cells stably expressing GFP-PARK2 with USP30 or s-USP35, treated them with CCCP for up to 60 min and fixed cells at different time points as indicated. The expression of USP30 and s-USP35 was confirmed by immunofluorescence staining (Fig. S6). In order to more accurately allow for the detection of the very early stage of PARK2 recruitment to mitochondria, the PARK2 that remained in the cytosol was removed by digitonin treatment prior to fixation. Colocalization of PARK2 was quantified by measuring the Manders colocalization coefficient of PARK2 that colocalized with the mitochondria marker mito-DsRed. In mock-transfected cells, the average Manders colocalization coefficient of PARK2 on mitochondria at 30 min and 60 min after CCCP treatment is 0.59±0.03 and 0.85 ± 0.06 respectively. Cells expressing USP30 showed a significant reduction in PARK2 recruitment at 30 min (0.07 ± 0.06) and 60 min (0.64 ± 0.04) of CCCP treatment compared to control cells (). This suggests that USP30 impedes mitophagy by delaying PARK2 recruitment to the mitochondria during the early stages of mitophagy activation. Importantly, within the first hour of mitophagy activation, PARK2-mediated MFN2 ubiquitination and degradation was elevated in the USP30 knockdown cells, suggesting that USP30 acts as a negative regulator of mitophagy by preventing the accumulation of ubiquitin and degradation of PARK2 substrates (). In contrast, s-USP35 overexpressing cells did not show any delay in PARK2 recruitment (), suggesting that the USP35 complex affects mitophagy through a different mechanism, likely through its regulation of MFN2 levels during homeostasis ().
Next, we assessed the interaction between PARK2 and MFN2 in siUSP30 or siUSP35 cells. Previously, it has been shown that PARK2 is recruited to mitochondria by binding to phosphorylated MFN2 during mitophagy.Citation17 Under basal conditions, there was little interaction between PARK2 and MFN2 in siCTRL cells. However, upon CCCP treatment, we observed an increase in PARK2 and ubiquitinated-MFN2 association (). In comparison to siCTRL cells, knocking down USP30 led to a stronger interaction between ubiquitinated-MFN2 and PARK2 both under basal conditions and during CCCP treatment (). Although siUSP35 cells had lower levels of MFN2 under basal conditions (), more ubiquitinated-MFN2 coimmunoprecipitated with PARK2 compared to siCTRL cells. Importantly, in the CCCP-treated siUSP35 cells, more ubiquitinated-MFN2 was coimmunoprecipitated with PARK2 in comparison to siCTRL cells, strongly suggesting an increase in binding between PARK2 and MFN2 compared to siCTRL.
Discussion
It is becoming evident that in mammalian cells ubiquitin dynamics likely play a pivotal role in regulating mitophagy. Because ubiquitination is a reversible process, it is not surprising that DUBs can affect the progress of mitophagy.Citation23 Indeed, 3 recent reports have demonstrated the regulatory roles of USP8, USP15, and USP30 in PARK2-mediated mitophagy.Citation24-26 In this study we have presented novel roles for 2 mitochondrial DUBs in mitophagy. Both USP30 and the USP35 complex can regulate PARK2-mediated mitophagy. USP30 participates in 2 aspects of mitophagy regulation. First, it can counteract PARK2 activity during mitophagy by regulating the levels of ubiquitinated MFN2 and TOMM20 (, ). To corroborate our results, Yue et al. and Bingo et al. also recently have shown that MFN2 and TOMM20 (among others) are substrates of USP30 respectively.Citation27,26 While we favor the hypothesis in which USP30 delays PARK2-mediated mitophagy by directly deubiquitinating MFN2 and TOMM20, it is possible that USP30 is protecting other OMM proteins from ubiquitination and degradation as well. Second, beyond regulating ubiquitination levels of PARK2 substrates, USP30 delays PARK2 recruitment to the mitochondria upon CCCP treatment, which in turn delays mitochondrial delivery to lysosomes (). We hypothesize that this delay is a consequence of squelching the ubiquitination of MFN2 that normally serves to amplify the signal for PARK2 translocation to damaged mitochondria.
In addition, we discovered that the previously unidentified USP35 complex plays an antagonistic role to PARK2 during mitophagy; however, it appears to act at different stages of mitophagy compared to USP30. For example, we demonstrated that the USP35 complex does not regulate PARK2 recruitment to damaged mitochondria (). Uniquely, the USP35 complex quickly dissociates from mitochondria during mitochondrial depolarization but returns to repolarized mitochondria (, Fig. S3). Interestingly, we observed that the USP35 complex has a striking effect on the steady-state levels of MFN2 on mitochondria. Moreover, this decrease in MFN2 under basal conditions in siUSP35 cells did not affect the normal morphology of mitochondria, suggesting that the increase in mitophagy in the absence of USP35 is not due to changes in mitochondrial morphology (). Instead, it is possible that USP35 may act on several yet-to-be-identified mitochondrial or even cytoplasmic proteins from nonspecific ubiquitination and/or degradation; hence the absence of USP35 may have preprimed mitochondria for turnover. Our data that show expression of a largely cytoplasmic form of USP35 (s-USP35MTSΔ-HA; ) inhibits mitophagy supports this model.
The seemingly different mechanisms in which USP30 and the USP35 complex regulate mitophagy suggest that cells may have multiple pathways to prevent the indiscriminate degradation of mitochondria. These different layers of regulation likely act as checkpoints to allow for the repair or recovery of damaged mitochondria. For instance, USP30 may delay PARK2 recruitment to the depolarized mitochondria in order to allow time for the damaged mitochondrion to fuse with the healthy mitochondrial network for repair.Citation28 Although it is not clear how the USP35 complex affects mitochondrial quality control, we speculate that the USP35 complex plays a housekeeping role in healthy mitochondria by maintaining the levels of mitochondria morphology proteins such as MFN2. Upon mitochondrial depolarization, the USP35 complex dissociates from damaged mitochondria, allowing PARK2 to carry out its required activity. Similarly, other DUBs may be involved in preventing mitochondria degradation by autophagy during stress conditions such as starvation. During starvation, mitochondria have been shown to become elongated to prevent their nonspecific degradation.Citation29,30 In such conditions, DUBs may act by preventing the degradation of elongation factors such as MFN2.
Recently (during preparation of this manuscript), 2 other DUBs (USP8 and USP15) were reported to modulate PARK2-mediated mitophagy. USP8 was shown to remove K6-linked ubiquitination on PARK2 itself; whereas USP15 does not act on PARK2 but likely acts on PARK2 mitochondrial substrates.Citation24,25 In our localization screen we did not identify USP8 or USP15 as mitochondrial-localized DUBs (Table S1). However, this newly described family of mitophagy-relevant DUBs (notably all in the USP subfamily) strongly suggests that the existence of a proteolytic network to monitor the ubiquitination status of both PARK2 and its substrates. This would serve to ensure the appropriate removal of the ‘damaged beyond repair’ mitochondria during cellular stress.
Mitochondrial quality control has emerged as an important cell survival mechanism that when dysfunctional may contribute to several human neurodegenerative diseases.Citation1-32 Here we present evidence that implicates the role of DUBs in regulating mitophagy. Given that enzymes represent a major therapeutic interest in drug development, the medical prospects are clear. By identifying the DUBs that regulate mitophagy and understanding their basic molecular mechanism, we can provide clear rationales for the design and development of drugs for the therapeutic treatment of neurodegenerative diseases such as Parkinson and Alzheimer diseases.
Materials and Methods
Constructs, antibodies, and siRNA
The DUB library was purchased from SPARC BioCentre, The Hospital to Sick Children. The ORF of 63 human DUBs was tagged with the ORF of GFP C-terminally or N-terminally (as indicated in Table S1). USP30 and s-USP35 were C-terminally tagged with a triple HA epitope using the Gateway® recombination system (LifeTechnologies, 12535-019). The ORF of s-USP35 was amplified by PCR and inserted into a vector (Clonetech, 6085-1) to generate both s-USP35-GFP and also s-USP35-3xHA within the EGFP-N1 plasmid backbone. The latter plasmid was named psUSP35.
The l-USP35 contained 1242 base pairs extension compared to s-USP35 (BC131489.1). To generate l-USP35, we synthesized the first 1530 base pairs with a FLAG tag at the N terminus (pBMH-USP35N plasmid (Biomatik)). l-USP35 was constructed by subcloning the N terminus half from pBMH-USP35N and the C terminus half from psUSP35 into a modified version of the mammalian expression vector pcDNATM3.1+ (LifeTechnologies, V790-20) using complementary restriction sites. In this modified version, the BspHI restriction sites were removed by Klenow treatment. To generate the s-USP35MTSΔ-HA plasmid, primers were designed to replace the first 162 bp of s-USP35 cDNA with a BglII site. To ensure the amplification of s-USP35MTSΔ, a Kozak sequence was inserted to the 5′ of s-USP35MTSΔ cDNA.
The construction of Cer-PARK2 was described previously.Citation22 To construct the mCherry-GFP-OMMTM plasmid, we first replaced EGFP on the pEGFP-SYNJ2BPTM (also called pEGFP-OMP25, a generous gift from the Dr Radhey S Gupta, McMaster University) plasmid with mCherry from the mCherry-C1 plasmid and generated mCherry-SYNJ2BPTM. Next, we digested mCherry-SYNJ2BPTM and EGFP-N1 with BglII and BamHI and inserted the EGFP to the C terminus of mCherry to construct mCherry-GFP-SYNJ2BPTM (RG-OMMTM).
The antibodies used in immunoblotting, immunofluorescence, and immunoprecipitation were: mouse-anti-HA (Covance, MMS-101R), rabbit-anti-HA (SantaCruz, sc-805), mouse-anti-ATP5A1 (Abcam, 15H4C4), mouse anti-GFP (Roche, 11814460001), rabbit anti-GFP (Gift from Dr. R.S. Hegde, MRC, UK), mouse-anti-FLAG M2 (Sigma, F1804), and HRP-goat-anti-GAPDH (Novus Biologicals, NB300-328H). siRNA against s-USP35 and l-USP35 (5′-AGUCAGACACGGGCAAGAUUGTT-3′), and siRNA against USP30 (5′-CUAGUCAACACAACCCUAAACUTT-3′) were purchased from GenePharma®. siRNA against USP20 is a pool of 2 siRNA oligos (5′- CGUCGUACGUGCUCAAGAA-3′ and 5′-GGACAAUGAUGCUCACCUA-3′) that were purchased from Sigma®. Knockdown was confirmed by quantitative PCR using GAPDH as the reference gene. Quantitative PCR was performed using a TaqMan® Real-Time PCR assay, following the protocol suggested by the manufacturer (Life Technologies, 4444557).
Cell culture, transfection, and treatment
HeLa cells were grown in Dulbecco's modified Eagle's medium (HyClone, SH3008101) supplemented with 2 mM L-glutamine (HyClone, SH30034.01) and 10% FBS (LifeTechnologies, A12617) at 37°C and 5% CO2. For live-cell imaging, cells were grown in 4-well Lab-Tek™ chamber slides (Thermo Fisher Scientific, 155383). Cells were changed into CO2-independent medium (LifeTechnologies, 18045) prior to live-cell imaging. Plasmids were transfected with Lipofectamine-2000 (LifeTechnologies, 11668-019) according to manufacturer's instructions 16 to 24 h prior to treatment. siRNA was transfected with Lipofectamine-2000 according to manufacturer's instructions for 72 h prior to treatment. To activate mitophagy, 10 µM CCCP was added to cells in their growth media. In mCherry-GFP lysosome assays, cells were treated with 0.5 mM leupeptin (Bioshop, Leu001.50) and 2 µM E-64 (Alexis Biochemical, ALX260-007-m025) to inhibit lysosomal protease activity. For long-term time-lapse experiments, 1× antibiotic cocktail (Wisent, 450-115-EL) was added to the CO2-independent medium to prevent bacterial growth.
Immunoblotting
Cells were washed twice with phosphate-buffered saline (PBS [Bio Basic Inc.., PD8117]) and lysed with cold lysis buffer (0.1 M Tris HCl, 0.01% SDS, pH9) with 1× protease inhibitor cocktail (BioShop, PIC002.1). Cell lysates were incubated at 95°C for 15 min and were centrifuged at 21,130 × g for 15 min. Immunoblotting samples were run on 10% or 12% SDS-PAGE and were transferred to PVDF (BioRad, 162-0177). Membranes were blocked in 5% skim milk in PBST (1× phosphate-buffered saline, 0.05% Tween-20 [BioShop, 1M23298]). Membranes were incubated with primary and HRP-conjugated secondary antibodies (concentration according to the manufacturer) in 2% skim milk in PBST. Proteins were visualized with enhanced chemiluminescence detection kit (Froggabio, 20-500-500). Protein density was measured with ImageJ, an imaging processing and analysis software, and was normalized to the density GAPDH.
Immunoprecipitation
HeLa cells were transfected with FLAG-l-USP35 and s-USP35-HA using X-tremeGENE 9 (Roche, 06365779001) for 24 h. Cells were washed with cold PBS and lysed in 200 µl lysis buffer (10 mM Tris-HCl, pH 7.4, 150 mM NaCl, 1 mM EDTA, 1% [v/v] Triton X-100 [BioShop, TRX777], 0.5% [v/v] NP-40 [Bio Basic Inc.., NDB0385], 2 mM Na3VO4, 5 mM NaF, protease inhibitor cocktail). After clearing the lysate at 16000 × g for 10 min at 4°C, 2 µg mouse anti-FLAG antibody or anti-GFP antibody was added to the lysate for 2 h at 4°C while shaking. Antibody-bound proteins were precipitated using protein A-agarose (Sigma, P2545) for 2 h at 4°C. Beads were washed 3 times using lysis buffer (without protease inhibitors) and proteins eluted with SDS sample buffer and boiling at 95°C for 8 min.
Fluorescence microscopy
All fluorescence images were acquired using a Zeiss LSM 710 laser scanning confocal microscope (Hospital for Sick Children, Toronto, Ontario, Canada). The images were acquired using a 63×1.4 NA or 40 × 1.3NA Plan-Neofluar oil immersion objective with LSM710 ZEN2009 software. GFP and Alexa Fluor 488 signal was acquired using a 488 nm Argon laser with a 493 to 565 nm or 515 to 565 nm (in presence of mCerulean) bandpass filter. RFP and Alexa Fluor 561 were acquired using a 561 nm diode laser with a 600 to 700 nm bandpass. mCerulean images were acquired using a 405 nm diode laser with a 450 to 495 nm bandpass filter.
Immunofluorescence
Cells on cover slips were fixed with 3.7% paraformaldehyde in growth media at 37°C for 15 min, and washed twice with warm PBS. When digitonin treatment was required, cells were treated with 20 to 40 µM digitonin (Calbiochem, 300410) in HKM buffer (110 mM potassium acetate, 20 mM HEPES pH7.4, 2 mM MgCl2) for 2 min before the fixing step.Citation33 Cells were then incubated with 0.1% Triton X-100 in PBS for 15 min and blocked in blocking buffer (1% FBS [LifeTechnologies, 12483-020] in PBS) for 30 min. Cells were incubated with primary antibodies (concentration according to the manufacturers’ directions) in blocking buffer for 2 h or overnight. Cells were incubated with Alexa Fluor® secondary antibodies (Life Technologies, A-11001, A-21206, A11004, and A-11011) in blocking buffer for 1 h at room temperature. The coverslips were mounted on fluorescent mounting media (DAKO Canada, 34538) on glass slides and dried overnight.
mCherry-GFP-lysosome (RG) assay
HeLa cells that were grown in Lab-Tek™ chambers were transfected with Cer-PARK2 and RG-OMMTM 16 to 24 h prior to the experiment. Cells were imaged on a Zeiss LSM710 equipped with a 63 × X 1.4NA oil immersion objective and the appropriate lasers. The images were acquired in 1024 × 1024 pixels at the depth of 12 bits. For time-lapse imaging, multiple locations were established with Zeiss imaging software, and the cells were kept at 37°C and CO2-independent media. After the initial images were acquired (0 min), CCCP, E-64, and leupeptin were added to the media. Cells were imaged at 30 min intervals for up to 12 h.
Quantification of the RG assay was done with image analysis software Volocity® 6.3. The area of the cell was determined by drawing a region of interest (ROI) around individual cells, in which the total pixel intensity of green and red signal of each mitochondrion and the area of each mitochondrion were measured. The mitochondrion with its total red signal 1.5 times higher than its total green signal is considered a “red mitochondrion” and hence colocalized with the lysosome. The area of red mitochondria and the total area of mitochondria were calculated and tabulated. Three independent trials were performed, and 22 cells were quantified in each treatment. The percentage of mitochondria that colocalized with the lysosome in each cell was calculated and plotted in a box-plot (n = 66).
Mitochondrial clearance assay
HeLa cells stably expressing GFP-PARK2 and mito-DsRed (GPRM) were generously provided to us by the Dr Richard J Youle (NIH, NINDS). GPRM cells grown on cover slips were transfected with USP30-HA, s-USP35-HA, or s-USP35MTSΔ-HA for at least 16 h. Cells were then treated with 10 µM CCCP for 24 h. Cells were fixed with 3.7% paraformaldehyde at 37°C for 15 min, and were washed with warm PBS twice. Cells were permeabilized with 0.1% Triton X-100 for 15 min at room temperature, followed by blocking buffer for 30 min. Cells were then incubated with primary antibody (concentration according to the manufacturer direction) for 2 h or overnight. Alexa Fluor® secondary antibodies in blocking buffer were then added to the cells and incubated for 1 h at room temperature. The coverslips were mounted on fluorescent mounting media (DAKO Canada, 34538) on glass slides and dried overnight. To quantify mitochondrial clearance, we counted the cells that had cleared their mitochondria in each treatment. We considered a cell mitochondrial-negative when there was very little residual mito-DsRed signal left and GFP-PARK2 showed cytosolic localization. Importantly, the residual mito-DsRed signal should not colocalize with GFP-PARK2, which indicated that the mito-DsRed signal resided in lysosomes and was not a PARK2-positive-mitochondrial-structure. The percentage of cells with no mitochondria was calculated in each treatment. The percentage of untransfected cells with no mitochondria was also calculated and plotted.
PARK2 recruitment assay
GPRM cells previously described were grown on coverslips and transfected with s-USP35-HA or USP30-HA for 16 to 24 h prior to treatment. To activate mitophagy, 10 µM CCCP was added to the growth media, and cells were fixed at 0, 30, and 60 min after CCCP treatment. Prior to fixation cells were treated with 20 to 40 µM digitonin in HKM buffer for 2 min. The immunofluorescence and microscopy procedures were described above.
Quantification of the PARK2 recruitment assay was done with Volocity® 6.3. The area of the cell was determined by manually drawing an ROI around individual cells. The Manders coefficient of the green signal on the red signal was measured and tabulated.
Statistical analysis
For western blotting, the average density of each protein was taken from 3 trials (n = 3). The Student t test was performed and P = 0.05 threshold was applied to label differences as “significant.” For RG-assay, statistical analysis was done by SigmaplotTM. Rank-sum test was performed on cells treated with siRNA and the control cells (n = 66). P = 0.05 threshold was applied to label differences as “significant.” For mitochondrial clearance assay, the % of cells without mitochondria was averaged from 3 trials (n = 3). The Student t test as performed and P = 0.05 was applied to label differences as “significant.” For PARK2 recruitment assay, the average Manders coefficient was taken from 3 trials (n = 3). The Student t test was performed and the usual P = 0.05 threshold was applied to label differences as “significant.”
Disclosure of Potential Conflicts of Interest
No potential conflicts of interest were disclosed.
Supplemental Material
Supplemental data for this article can be accessed on the pub-lisher's website.
1034408_supplemental_files.zip
Download Zip (9.2 MB)Funding
The research of the authors is supported by grants from the Canada Institutes of Health Research (CIHR grant no. MOP-130281 to GAM and PKK). YW is supported through a studentship, in part, by the Ontario Student Opportunity Trust Fund and Hospital for Sick Children Foundation Student Scholarship Program. MS is funded by the Swiss National Science Foundation Postdoc Mobility Fellowship PBBEP3_146277.
References
- Deas E, Wood NW, Plun-Favreau H. Mitophagy and Parkinson's disease: the PINK1-parkin link. Biochim Biophys Acta [Internet] 2011 [cited 2014 Apr 29]; 1813:623–33. Available from: http://www.pubmedcentral.nih.gov/articlerender.fcgi?artid=3925795&tool=pmcentrez&rendertype=abstract; http://dx.doi.org/10.1016/j.bbamcr.2010.08.007
- Swerdlow R, Burns J, Khan S. The Alzheimer's disease mitochondrial cascade hypothesis. J Alzheimers Dis 2012; 20:265-79.
- Berman S, Pineda F, Hardwick J. Mitochondrial fission and fusion dynamics: the long and short of it. Cell Death Differ 2008; 15:1147–52; PMID:18437161; http://dx.doi.org/10.1038/cdd.2008.57
- Novak I. Mitophagy: a complex mechanism of mitochondrial removal. Antioxid Redox Signal [Internet] 2012 [cited 2012 Mar 23]; 0. Available from: http://www.ncbi.nlm.nih.gov/pubmed/22077334
- Youle RJ, Narendra DP. Mechanisms of mitophagy. Nat Rev Mol Cell Biol [Internet] 2011 [cited 2010 Dec 22]; 12:9–14. Available from: http://www.nature.com/doifinder/10.1038/nrm3028; http://dx.doi.org/10.1038/nrm3028
- Zheng X, Hunter T. Parkin mitochondrial translocation is achieved through a novel catalytic activity coupled mechanism. Cell Res [Internet] 2013 [cited 2013 May 21]:1–12. Available from: http://www.ncbi.nlm.nih.gov/pubmed/23670163
- Geisler S, Holmström KM, Skujat D, Fiesel FC, Rothfuss OC, Kahle PJ. PINK1 / Parkin-mediated mitophagy is dependent on VDAC1 and p62 / SQSTM1. Nat Cell Biol [Internet] 2010; 12:119–31. Available from: http://dx.doi.org/10.1038/ncb2012
- Narendra DP, Jin SM, Tanaka A, Suen D-F, Gautier CA, Shen J, Cookson MR, Youle RJ. PINK1 is selectively stabilized on impaired mitochondria to activate Parkin. PLoS Biol [Internet] 2010; 8:e1000298. Available from: http://www.ncbi.nlm.nih.gov/pubmed/20126261; http://dx.doi.org/10.1371/journal.pbio.1000298
- Narendra D, Tanaka A, Suen D-F, Youle RJ. Parkin is recruited selectively to impaired mitochondria and promotes their autophagy. J Cell Biol [Internet] 2008; 183:795–803. Available from: http://www.ncbi.nlm.nih.gov/pubmed/19029340; http://dx.doi.org/10.1083/jcb.200809125
- Chan NC, Salazar AM, Pham AH, Sweredoski MJ, Kolawa NJ, Graham RLJ, Hess S, Chan DC. Broad activation of the ubiquitin-proteasome system by Parkin is critical for mitophagy. Hum Mol Genet [Internet] 2011 [cited 2011 Feb 10]:1–12. Available from: http://www.ncbi.nlm.nih.gov/pubmed/21296869
- Okatsu K, Saisho K, Shimanuki M, Nakada K, Shitara H, Sou Y-S, Kimura M, Sato S, Hattori N, Komatsu M, et al. p62/SQSTM1 cooperates with Parkin for perinuclear clustering of depolarized mitochondria. Genes Cells [Internet] 2010 [cited 2010 Aug 16]; 15:887–900. Available from: http://www.ncbi.nlm.nih.gov/pubmed/20604804
- Olzmann JA, Li L, Chudaev MV, Chen J, Perez FA, Palmiter RD, Chin LS. Parkin-mediated K63-linked polyubiquitination targets misfolded DJ-1 to aggresomes via binding to HDAC6. J Cell Biol [Internet] 2007 [cited 2014 Apr 29]; 178:1025–38. Available from: http://www.pubmedcentral.nih.gov/articlerender.fcgi?artid=2064625&tool=pmcentrez&rendertype=abstract; http://dx.doi.org/10.1083/jcb.200611128
- Johansen T, Lamark T. Selective autophagy mediated by autophagic adapter proteins. Autophagy [Internet] 2011 [cited 2014 May 24]; 7:279–96. Available from: http://www.landesbioscience.com/journals/autophagy/article/14487/; http://dx.doi.org/10.4161/auto.7.3.14487
- Kim I, Rodriguez-Enriquez S, Lemasters JJ. Selective degradation of mitochondria by mitophagy. Arch Biochem Biophys [Internet] 2007 [cited 2010 Nov 19]; 462:245–53. Available from: http://www.pubmedcentral.nih.gov/articlerender.fcgi?artid=2756107&tool=pmcentrez&rendertype=abstract; http://dx.doi.org/10.1016/j.abb.2007.03.034
- Kondapalli C, Kazlauskaite A, Zhang N, Woodroof HI, Campbell DG, Gourlay R, Burchell L, Walden H, Macartney TJ, Deak M, et al. PINK1 is activated by mitochondrial membrane potential depolarization and stimulates Parkin E3 ligase activity by phosphorylating Serine 65. Open Biol [Internet] 2012 [cited 2012 Dec 2]; 2:120080. Available from: http://www.pubmedcentral.nih.gov/articlerender.fcgi?artid=3376738&tool=pmcentrez&rendertype=abstract; http://dx.doi.org/10.1098/rsob.120080
- Kane LA, Lazarou M, Fogel AI, Li Y, Yamano K, Sarraf SA, Banerjee S, Youle RJ. PINK1 phosphorylates ubiquitin to activate Parkin E3 ubiquitin ligase activity. J Cell Biol [Internet] 2014 [cited 2014 Apr 28]; Available from: http://www.ncbi.nlm.nih.gov/pubmed/24751536
- Chen Y, Dorn Ii GW. PINK1-phosphorylated mitofusin 2 is a Parkin receptor for culling damaged mitochondria. Science (80- ) 2013; 340:471–5; http://dx.doi.org/10.1126/science.1231031
- Kazlauskaite A, Kondapalli C, Gourlay R, Campbell DG, Ritorto MS, Hofmann K, Alessi DR, Knebel A, Trost M, Muqit MMK. Parkin is activated by PINK1-dependent phosphorylation of ubiquitin at Ser65. Biochem J [Internet] 2014 [cited 2014 Jun 2]; 460:127–39. Available from: http://www.pubmedcentral.nih.gov/articlerender.fcgi?artid=4000136&tool=pmcentrez&rendertype=abstract; http://dx.doi.org/10.1042/BJ20140334
- Reyes-Turcu FE, Ventii KH, Wilkinson KD. Regulation and cellular roles of ubiquitin-specific deubiquitinating enzymes. Annu Rev Biochem [Internet] 2009; 78:363–97. Available from: http://www.ncbi.nlm.nih.gov/pubmed/19489724; http://dx.doi.org/10.1146/annurev.biochem.78.082307.091526
- Sciences B. Regulation of mitochondrial morphology by USP30, a deubiquitinating enzyme present in the mitochondrial outer membrane nobuhiro nakamura and shigehisa hirose. 2008; 19:1903–11
- Deosaran E, Larsen KB, Hua R, Sargent G, Wang Y, Kim S, Lamark T, Jauregui M, Law K, Lippincott-Schwartz J, et al. NBR1 acts as an autophagy receptor for peroxisomes. J Cell Sci [Internet] 2013 [cited 2014 Jun 5]; 126:939–52. Available from: http://www.ncbi.nlm.nih.gov/pubmed/23239026; http://dx.doi.org/10.1242/jcs.114819
- Wang Y, Nartiss Y, Steipe B, McQuibban GA, Kim PK. ROS-induced mitochondrial depolarization initiates PARK2/PARKIN-dependent mitochondrial degradation by autophagy. Autophagy [Internet] 2012; 8:1462–76. Available from: http://www.ncbi.nlm.nih.gov/pubmed/22889933; http://dx.doi.org/10.4161/auto.21211
- Eletr ZM, Wilkinson KD. Regulation of proteolysis by human deubiquitinating enzymes. Biochim Biophys Acta [Internet] 2014 [cited 2014 Apr 29]; 1843:114–28. Available from: http://www.ncbi.nlm.nih.gov/pubmed/23845989; http://dx.doi.org/10.1016/j.bbamcr.2013.06.027
- Durcan TM, Tang MY, Pérusse JR, Dashti EA, Aguileta MA, Mclelland L, Gros P, Shaler TA, Faubert D, Coulombe B, et al. USP 8 regulates mitophagy by removing K 6 -linked ubiquitin conjugates from parkin. EMBO J 2014; 33:2473–91; PMID:25216678; http://dx.doi.org/10.15252/embj.201489729
- Cornelissen T, Haddad D, Wauters F, Van Humbeeck C, Mandemakers W, Koentjoro B, Sue C, Gevaert K, De Strooper B, Verstreken P, et al. The deubiquitinase USP15 antagonizes Parkin-mediated mitochondrial ubiquitination and mitophagy. Hum Mol Genet [Internet] 2014 [cited 2014 Nov 25]; 23:5227–42. Available from: http://www.ncbi.nlm.nih.gov/pubmed/24852371; http://dx.doi.org/10.1093/hmg/ddu244
- Bingol B, Tea JS, Phu L, Reichelt M, Bakalarski CE, Song Q, Foreman O, Kirkpatrick DS, Sheng M. The mitochondrial deubiquitinase USP30 opposes parkin-mediated mitophagy. Nature [Internet] 2014 [cited 2014 Jun 4]; Available from: http://www.nature.com/doifinder/10.1038/nature13418
- Yue W, Chen Z, Liu H, Yan C, Chen M, Feng D, Yan C, Wu H, Du L, Wang Y, et al. A small natural molecule promotes mitochondrial fusion through inhibition of the deubiquitinase USP30. Cell Res 2014; 24:482–96; PMID:24513856; http://dx.doi.org/10.1038/cr.2014.20
- Xie R, Nguyen S, McKeehan K, Wang F, McKeehan WL, Liu L. Microtubule-associated protein 1S (MAP1S) bridges autophagic components with microtubules and mitochondria to affect autophagosomal biogenesis and degradation. J Biol Chem [Internet] 2011 [cited 2014 Apr 29]; 286:10367–77. Available from: http://www.pubmedcentral.nih.gov/articlerender.fcgi?artid=3060490&tool=pmcentrez&rendertype=abstract; http://dx.doi.org/10.1074/jbc.M110.206532
- Rambold AS, Kostelecky B, Elia N, Lippincott-schwartz J. Tubular network formation protects mitochondria from autophagosomal degradation during nutrient starvation. PNAS 2011; 108:10190–5; PMID:21646527; http://dx.doi.org/10.1073/pnas.1107402108
- Gomes LC, Di Benedetto G, Scorrano L, Di Benedetto G. During autophagy mitochondria elongate, are spared from degradation and sustain cell viability. Nat Cell Biol [Internet] 2011 [cited 2011 Apr 13]; 13:589–98. Available from: http://www.ncbi.nlm.nih.gov/pubmed/21478857; http://dx.doi.org/10.1038/ncb2220
- Youle RJ, van der Bliek AM. Mitochondrial fission, fusion, and stress. Science [Internet] 2012 [cited 2014 May 25]; 337:1062–5. Available from: http://www.ncbi.nlm.nih.gov/pubmed/22936770; http://dx.doi.org/10.1126/science.1219855
- Nunnari J, Suomalainen A. Mitochondria: in sickness and in health. Cell [Internet] 2012 [cited 2014 Apr 29]; 148:1145–59. Available from: http://www.ncbi.nlm.nih.gov/pubmed/22424226; http://dx.doi.org/10.1016/j.cell.2012.02.035
- Wunder C, Lippincott-Schwartz J, Lorenz H. Determining membrane protein topologies in single cells and high-throughput screening applications. Curr Protoc cell Biol [Internet] 2010 [cited 2014 Dec 5]; Chapter 5:Unit 5.7. Available from: http://www.pubmedcentral.nih.gov/articlerender.fcgi?artid=3018527&tool=pmcentrez&rendertype=abstract