
Abstract
Bioactive sphingolipids including ceramides are involved in a variety of pathophysiological processes by regulating cell death and survival. The objective of the current study was to examine ceramide metabolism in preeclampsia, a serious disorder of pregnancy characterized by oxidative stress, and increased trophoblast cell death and autophagy. Maternal circulating and placental ceramide levels quantified by tandem mass spectrometry were elevated in pregnancies complicated by preeclampsia. Placental ceramides were elevated due to greater de novo synthesis via high serine palmitoyltransferase activity and reduced lysosomal breakdown via diminished ASAH1 expression caused by TGFB3-induced E2F4 transcriptional repression. SMPD1 activity was reduced; hence, sphingomyelin degradation by SMPD1 did not contribute to elevated ceramide levels in preeclampsia. Oxidative stress triggered similar changes in ceramide levels and acid hydrolase expression in villous explants and trophoblast cells. MALDI-imaging mass spectrometry localized the ceramide increases to the trophophoblast layers and syncytial knots of placentae from pregnancies complicated by preeclampsia. ASAH1 inhibition or ceramide treatment induced autophagy in human trophoblast cells via a shift of the BOK-MCL1 rheostat toward prodeath BOK. Pharmacological inhibition of ASAH1 activity in pregnant mice resulted in increased placental ceramide content, abnormal placentation, reduced fetal growth, and increased autophagy via a similar shift in the BOK-MCL1 system. Our results reveal that oxidative stress-induced reduction of lysosomal hydrolase activities in combination with elevated de novo synthesis leads to ceramide overload, resulting in increased trophoblast cell autophagy, and typifies preeclampsia as a sphingolipid storage disorder.
Abbreviations:
- 2-OE, 2-oleoylethanolamine
- 3-KDS, 3-keto dihydrosphingosine
- 3-MA, 3-methyladenine
- ACTB, actin β
- ASAH1, N-acylsphingosine amidohydrolase (acid ceramidase) 1
- BafA1, bafilomycin A1
- BECN1, Beclin 1, autophagy related
- BOK, BCL2-related ovarian killer
- CANX, calnexin
- CASP3 (caspase 3, apoptosis-related cysteine peptidase)
- CERs, ceramides
- CT, cytotrophoblast cells
- DHCer, dihydro-ceramide
- D-NMAPPD, N-[(1R,2R)-2-hydroxyl-1-(hydroxyL-methyl)-2-(4-nitrophenyl) ethyl]-tetradecanamide
- E2F4, E2F transcription factor 4, p107/p130-binding
- HIF1A, hypoxia inducible factor 1, α, subunit (basic helix-loop-helix transcription factor)
- LC-MS/MS, liquid chromatography-tandem mass spectrometry
- LAMP1, lysosomal-associated membrane protein 1
- LC3B-II, cleaved and lipidated form of microtubule-associated protein 1 light chain 3 β (MAP1LC3B/LC3B)
- MALDI-MS, matrix-assisted laser desorption/ionization-mass spectrometry
- MCL1, myeloid cell leukemia 1
- PE, preeclampsia
- PTC, preterm control
- S1P, sphingosine-1-phosphate
- Sa, sphinganine
- siRNA, small-interfering ribonucleic acid
- SQSTM1/p62, sequestosome 1
- SM, sphingomyelin
- SMPD1, sphingomyelin phosphodiesterase 1, acid lysosomal (acid sphingomyelinase)
- SNP, sodium nitroprusside (III)
- SPH, sphingosine
- SPT, serine palmitoyltransferase
- ST, syncytium/syncytiotrophoblast cells
- TC, term control
- TGFB, transforming growth factor β
Introduction
Sphingolipids, classically thought to be purely inert structural elements of the cell membrane, have been recognized as bioactive signaling mediators in modulating a variety of fundamental cellular processes.Citation1 In particular, ceramides (CERs) are important signal effector molecules in the cellular response to stress and apoptosis.Citation2 CERs are primarily generated by de novo synthesis in the endoplasmic reticulum (ER); however, they can also be produced from the catabolism of complex sphingolipids in a variety of subcellular compartments. Notably, in the lysosome, CER levels are dynamically regulated by a balance between the rates of their conversion from sphingomyelin (SM), catalyzed by SMPD1 (sphingomyelin phosphodiesterase 1, acid lysosomal [acid sphingomyelinase]) and their breakdown into sphingosine (SPH) and fatty acyl-CoA catalyzed by ASAH1 (N-acylsphingosine amidohydrolase [acid ceramidase] 1).Citation3 Both ASAH1 and SMPD1 are glycoproteins synthesized in the ER where they undergo extensive N-glycosylation, which is essential for their transport to the acidic lysosomal compartments where they are cleaved into active enzymes.Citation3-5
Sphingolipid accumulation typifies several human disorders. Niemann-Pick disease is a lysosomal storage disorder caused by mutations in the SMPD1 gene. The lysosomal accumulation of SM leads to organ abnormalities, pulmonary insufficiency, and cardiovascular disease.Citation6 Inherited deficiencies caused by mutations in the ASAH1 gene results in Farber disease, a rare disorder that is characterized by lysosomal CER accumulation causing joints and subcutaneous abnormalities.Citation7 Long-chain CERs (C16 to C24) play important roles in the induction of cell death and autophagy.Citation2,8–10 Conversely, sphingosine-1-phosphate (S1P), a bioactive CER metabolite generated by hydrolysis of CER to SPH and its subsequent phosphorylation by sphingosine kinases, promotes cell survival.Citation11 Since CERs are the only sphingolipid species that can be synthesized de novo while all other sphingolipids originate from CERs, the rheostat between CERs and S1P is critically dependent upon the activity of regulatory enzymes, ceramidases, and sphingomyelinases, making these enzymes important determinants of cell fate.Citation9
Alterations in the rheostat between placental cell death and survival are known contributors to improper placentation and, consequently, to the development of pregnancy-related disorders, such as preeclampsia (PE).Citation12 This serious disease complicates 5% to 7% of all pregnancies and is clinically characterized by the sudden onset of maternal hypertension.Citation13 In PE, the lack of remodeling of the maternal spiral arteries by trophoblast cells causes insufficient uteroplacental circulation leading to placental hypoxia and oxidative stress,Citation14-16 which in turn is responsible for increased trophoblast autophagy and apoptosis.Citation17,18 Excessive trophoblast cell death and turnover leads to exuberant shedding and release of syncytial debris into the maternal circulation, which consequently contribute to the systemic vascular endothelial injury leading to the maternal clinical symptoms.Citation19 Notably, women who experience preeclampsia are at higher risk of developing the metabolic syndrome later in life.
While major strides have been made in understanding the regulatory mechanism(s) of sphingolipid metabolism and their involvement as bioactive mediators in controlling cell fate in a variety of systems, sphingolipid metabolism and function in the human placenta remains elusive. In this study, we examined whether sphingolipids, in particular CERs, are contributing to the excessive cell death in PE. We found that the oxidative stress status characteristic of PE causes an increase in de novo CER synthesis while decreasing ASAH1 expression and activity, thereby favoring accumulation of CERs, which contributes to increased trophoblast cell autophagy seen in this disorder.
Results
Ceramide levels in preeclampsia
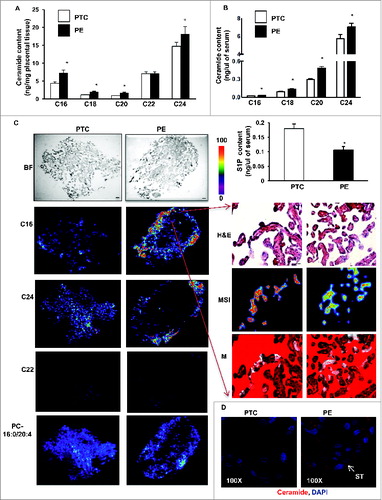
We first determined the sphingolipid levels in placentae from PE and preterm control (PTC) pregnancies using LC-MS/MS. Analyses revealed significant increases in various CERs (e.g. C16-Cer(d18:1/16:0), C18-Cer(d18:1/18:0), C20-Cer(d18:1/20:0), and C24-Cer(d18:1/24:0), but not C22-Cer(d18:1/22:0) in PE placentae compared to PTC (), while the relative abundance of individual CERs (% of total) remained unchanged. CER distribution and levels did not differ between placentae obtained from vaginal delivery versus those from caesarian section in both normotensive control and pathological groups (Fig. S1A), indicating that labor had no effect on placental sphingolipid levels. MALDI-MS imaging of both PE and PTC placentae localized C16 and C24 ceramide increases primarily to the trophoblast layers () and syncytial knots (, right panels) of PE placentae. In line with LC-MS/MS data, C22 ceramide distributions were not different between PE and PTC placentae (). Also, phosphatidylcholine (e.g. PC-16:0/20:4) distributions were similar between PE and PTC placentae. Immunofluorescent staining with an anti-ceramide antibody confirmed that CERs mainly localized to the trophoblastic layers of PE placentae (). Since syncytial knots originating from the trophoblastic layers are typically shed in the maternal circulation, we next examined CER levels in sera obtained from PE and PTC pregnancies. CER levels, including C16, C18, C20, and C24, were significantly elevated in sera of PE patients relative to those found in control normotensive women (). In contrast, circulating S1P levels in PE women were significantly decreased relative to controls (, lower panel).
Figure 1. For figure legend, see page 656. Figure 1 (See previous page). Sphingolipid levels are increased in preeclamptic placentae. CER levels measured by LC-MS/MS in placental tissue (A) and sera (B) from PE women compared to normotensive PTC. Numbers indicate fatty acid chain length of CERs with d18:1 sphingosine backbone (PE, n = 45; PTC, P = 40 *P<0.05). (B, lower panel) S1P content in sera from PE and PTC women. (C, left panels) Spatial localization of CERs in placentae from PE and PTC using MALDI-MS imaging (MSI). Representative images of C16:0, C22:0; C24:0 CER and phosphatidylcholine PC-16:0/20:4 distributions in PE and PTC sections. BF: bright field image. (C, right panels) H&E and MSI of C16:0 CER. Merged image (M) of H&E and MSI shows C16:0 CER distribution in PE placental villi. Intensities of ions based on the intensity scale provided. (D) Spatial localization of ceramide immunoreactivity in placental sections from PE and PTC placentae (ST, syncytiotrophoblast cells). Ceramide (red) and nuclei counterstained with DAPI (blue). Bar: 1cm in BF; Bar: 50 μm in H&E.
CER tissue levels are tightly regulated by their rate of synthesis and breakdown. In order to establish the source of CER accumulation, we first examined the de novo synthesis pathway. We measured the activity of SPT (serine palmitoyltransferase), the rate-limiting enzyme of the de novo pathway that catalyzes the condensation of serine and palmitoyl-CoA to form 3-keto dihydrosphingosine (3-KDS). SPT activity was significantly increased in PE placentae compared to both PTC and TC controls (). Moreover, sphinganine (Sa) and dihydroceramide (DHCer), both intermediates of the de novo pathway after 3-KDS, were significantly increased in PE compared to PTC placentae indicating that elevated CERs in PE are in part due to heightened de novo synthesis ().
Figure 2. The de novo ceramide synthesis is increased in preeclampsia while acid ceramidase expression and activity is reduced. (A) SPT activity in PE and PTC placentae. (B) Sphinganine (Sa) and dihydroceramide (DHCer24) content in PE vs. PTC placentae (PE, n = 45; TC, n = 40; *P < 0.05). (C) Western blot analysis of ASAH1 following incubation with a competing peptide (CP) for ASAH1 antibody in PTC placental lysates. (D and E) ASAH1 protein expression in PE vs PTC placentae (PE, n = 23; PTC, n = 15; TC, n = 11 *P<0.0015). (F) ASAH1 enzyme activity in PE placentae compared to PTC and TC placentae. (G) ASAH1 mRNA expression in PE vs. PTC placentae (PE, n = 9; PTC, n = 10, *P < 0.002).
ASAH1 expression in preeclampsia
In addition to de novo synthesis, CER levels are exquisitely dependent upon the action of lysosomal ASAH1 and SMPD1. Accumulation of CERs in PE suggests that the machinery involved in CERs breakdown may potentially be altered; hence, we examined the expression of ASAH1. This enzyme hydrolyzes CERs into SPH and free fatty acids. It is synthesized as a 55-kDa precursor protein that is processed in the lysosomes to the active heterodimeric enzyme composed of an α (non-glycosylated 13 kDa) and β (glycosylated 40 kDa) subunit.Citation3 Western blot analysis identified ASAH1 as a doublet of approximately 40 kDa in the placental lysates ().Citation3 Immunoblots in the presence and absence of a competing peptide confirmed ASAH1 as a band with a molecular mass of ∼40 kDa corresponding to the β-subunit of the active enzyme (). ASAH1 protein levels were markedly reduced in PE compared to PTC and TC (). No significant changes in ASAH1 expression between PTC and TC were found (). Moreover, ASAH1 enzyme activity was significantly reduced in PE placentae compared to those from PTC and TC placentae (). In line with the protein data, qPCR revealed a significant decrease in ASAH1 mRNA levels in PE compared to PTC (). In silico promoter analysis of the ASAH1 gene did not reveal any hypoxic response binding sites, suggesting no direct regulation by HIF1A; however, the promoter contains several putative binding sites for E2F transcription factors upstream from the translation start site corresponding to nucleotides −399 to −392 and −261 to −254. Hence, we examined E2F1 and E2F4 protein expression. E2F4 repressor levels were increased in PE vs. PTC placentae while E2F1 activator levels were unchanged (). ChIP analysis revealed increased binding of E2F4 repressor to the ASAH1 promoter in PE vs. PTC placentae (). RNAi knockdown of E2F4 repressor increased ASAH1 gene and protein expression in trophoblastic JEG3 cells (), supporting direct regulation of ASAH1 expression by this transcription factor. Furthermore, we found that TGFB1/3 upregulated E2F4 expression in JEG3 cells that was partially abolished with SMAD2 RNAi (), suggesting that the increase in E2F4 is downstream of the activated HIF/TGFB3 axis in PE.Citation20
Figure 3. Oxidative stress reduces acid ceramidase expression and impinges on ceramide levels. (A) Representative immunoblots for E2F4 and E2F1 in PE and PTC placentae. (B) ChIP analysis of E2F4 binding to ASAH1 promoter in PE (PE; n = 6 in triplicate) vs. PTC (PTC; n = 6 in triplicate) placentae. Data expressed as % of ASAH1 qPCR of total input DNA; ChIP with nonimmune IgG served as negative control, *P<0.05 vs PTC). (C) AC mRNA expression in E2F4 siRNA-treated JEG3 cells (n = 3, *P<0.05). (D) E2F4 and ASAH1 protein expression in E2F4 siRNA-treated JEG3 cells. (E) Representative immunoblots for E2F4 and phosphorylated pSMAD2 in JEG3 cells following treatment with TGFB1/3 with and without SMAD2 RNAi. (F) Ceramide levels in explants (n = 6 *P<0.05) following SNP exposure. (G) ASAH1 protein expression in villous explants after SNP treatment.
Oxidative stress and ASAH1 expression
PE is a pathology associated with placental hypoxia and oxidative stress.Citation15,16,21 We next assessed the ceramide profile in villous explants treated with and without sodium nitroprusside (SNP), a nitric oxide donor that also activates the Fenton reaction and induces a state of oxidative stress through generation of reactive oxygen species.Citation21 LC-MS/MS analysis showed that 5.0 mM SNP treatment led to significant increases in C16 and C18 CERs compared to untreated control explants maintained at standard (20% O2) conditions, while no differences were found for C20 and C24 CERs (, left panel) as well as for sphingomyelin (Fig. S1C). Increased hydrogen peroxide release following treatment with SNP in villous explants confirmed that SNP induced oxidative stress (Fig. S1D). Exposure of JEG3 cells to SNP also resulted in elevated CER levels (not shown). To determine whether oxidative stress affects ASAH1 expression villous explants were treated with SNP. As can be seen in , exposure to 2.5 and 5.0 mM SNP resulted in a significant decrease in ASAH1 β-subunit expression when compared to untreated controls. Similarly to villous explants, JEG3 cells exposed to SNP exhibited reduced active ASAH1 expression (not shown).
Disruption in SMPD1 processing and function in preeclampsia
Activation of lysosomal SMPD1 is thought to be a major cellular response to stress leading to the production of CERs.Citation22 Lipidomic analysis revealed no differences in total SM in PE compared to PTC placental tissue (Fig. S1B). These data argue against an activation of SMPD1 and are more indicative of a reduced activity in PE. To investigate this possibility, we determined the expression and activity of SMPD1. Although no differences in SMPD1 transcripts between PE and PTC were found (data not shown), SMPD1 protein levels, specifically the 75-kDa precursor protein, were markedly increased in PE placentae (). SMPD1 contains 6 N-linked oligosaccharide chains, which are known to affect trafficking, processing, folding, and activity of this enzyme.Citation4 To examine whether the glycosylation status of SMPD1 was altered in PE placenta, SMPD1 was immunoprecipitated followed by immunoblotting with concanavalin A (detects N-glycans such as a-D-Man and a-D-Glc). Markedly more N-linked glycans were found in SMPD1 of PTC vs PE placentae (, lower panel), suggesting that N-glycosylation of SMPD1 is altered in PE. We then examined SMPD1 activity and observed a significant decrease in SMPD1 activity in PE placentae when compared to PTC (). Together, the findings suggest that SMPD1 processing is altered in placentae from PE pregnancies, resulting in a reduction of its activity and favoring SM instead of CER formation.
Figure 4. Expression, glycosylation, and activity of acid sphingomyelinase are altered in preeclampsia. (A) Upper panel: Protein expression of SMPD1 (70-kDa active and 75-kDa precursor protein) in PE compared to PTC placentae. Lower panel: Immunoprecipitation of SMPD1 from PE placental lysates followed by western blot using concanavalin A (ConA) in PE vs PTC placentae. (N represents immunoprecipitation with nonimmune IgG control). (B) SMPD1 enzyme activity in PE compared to PTC placentae (PE, n = 6; PTC, n = 6 *P<0.05). (C) SMPD1 protein expression (upper panel) and enzyme activity (lower panel) in human villous explants following exposure to SNP (n = 5 *P<0.02). (D) Protein expression (upper panel) and enzyme activity (lower panel) in JEG3 cells treated with SNP (n = 6 *P<0.05). (E) SMPD1 and phosphorylated pSMAD2 in JEG3 cells following treatment with TGFB1 and TGFB3. (F) SMPD1 enzyme activity in villous explants after exposure to the TGFBR1/ALK5 inhibitor SB-431542 (n = 3, *P < 0.05). RFU, relative fluorescence units.
Oxidative stress and SMPD1 expression, trafficking, and activity
To determine if the oxidative stress status typical of PE pathologies was a contributing factor to altered SMPD1 expression and processing, we treated placental villous explants and JEG3 cells with SNP and observed a dose-dependent increase in SMPD1 protein expression. Similar to PE placentae, SNP increased the 75-kDa SMPD1 precursor levels () and significantly reduced SMPD1 activity in both explants and JEG3 cells (, lower panels). We then examined SMPD1 subcellular localization in JEG3 cells following SNP treatment. In vehicle-treated (control) cells positive SMPD1 signal was detected in the cytoplasm where it colocalized with LysoTracker®Red, indicating its presence in the lysosomal compartment (Fig. S2, left panel). In contrast, SNP treatment resulted in colocalization of SMPD1 with the ER marker CALR (calreticulin; Fig. S2, right panel), suggesting that SNP-induced oxidative stress affects the intracellular shuttling of the SMPD1 precursor. Since TGFB3 is elevated in PE,Citation20,23 we examined whether SMPD1 was regulated by TGFBs. Similarly to PE and SNP, TGFB3 and to a lesser extent TGFB1 increased SMPD1 75-kDa precursor levels while reducing its active 70-kDa form in JEG3 cells (). Conversely, inhibition of TGFB signaling using SB-431542, an established blocker of TGFBR1/ALK5, significantly increased SMPD1 activity in villous explants ().
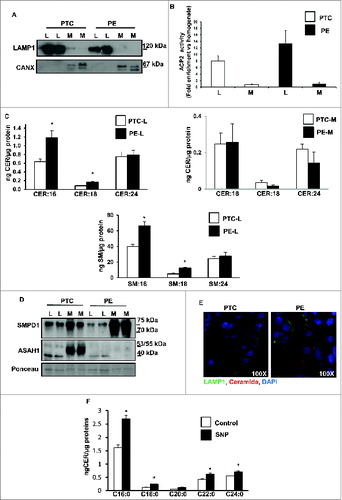
Lysosomal accumulation of CERs and SMs in preeclampsia
Since the aforementioned experiments were performed with whole-tissue lysates, we next examined CER metabolism in lysosome-enriched fractions of PE and PTC placentae as well as villous explants treated with and without SNP. Purity of lysosomal fractions was validated with LAMP1 (endo/lysosome marker) and CANX (calnexin; ER-microsome marker) () as well as by activity measurements of ACP2 (acid phosphatase 2, lysosomal) (). Lysosomal fractions purified from PE tissue had significant elevated levels of C16 and C18 CER () as well as of SM:16 and SM:18 (, lower panel). No significant changes in CERs were detected in the microsomal fractions purified from PE placentae relative to PTC (, right panel). Western blot analysis showed striking changes in subcellular distribution of SMPD1 between PE and PTC samples. Active SMPD1 levels were reduced in lysosomes from PE placentae compared to PTC, while the 75-kDa precursor was markedly increased in the microsomal fractions from PE placentae, in line with impairment in subcellular trafficking of this enzyme (). Both immature (53 kDa) and mature (40 kDa) ASAH1 levels were markedly decreased in microsomes and lysosomes, respectively, from PE placentae compared to PTC, in agreement with reduced gene expression (). Immunofluorescence analysis using a specific CER antibody in conjunction with LAMP1 confirmed that CERs specifically accumulated in the lysosomes of trophoblastic layers of PE placentae (). To exclude that the lysosomal CERs increase in PE placentae was due to an increased breakdown of glycosylceramides we measured lysosomal glucosyl- and galactosyl-ceramide levels as well as lysosomal GBA (glucosidase, β, acid) activity (Fig. S1E and F). Both glycosylceramides increased in PE vs. PTC (Fig. S1E); however, GBA activity did not change (Fig. S1F). Moreover, glycosylceramides were approximately 50-fold less abundant than lysosomal ceramides. Thus, it is unlikely that they markedly contributed to the increase in lysosomal ceramides in PE placentae. Lysosomal analysis of villous explants after SNP treatment resulted in similar ceramide increases as seen in PE placental lysosomes, suggesting that oxidative stress altered lysosomal ceramide metabolism ().
Figure 5. Ceramide accumulates in lysosomal fractions in preeclampsia. (A and B) PE and PTC placental tissue were subjected to subcellular fractionation. Lysosomal (L) fractions were enriched in LAMP1 (A) and ACP2/acid phosphatase activity (B) whereas microsomal (M) fractions contained CANX (A). (C upper panel) CER levels in lysosomal (L) and microsomal (M) subfractions isolated from PE and PTC placentae (PE, n = 5; PTC, n = 5 *P<0.05). (C lower panel) SM content in L subfractions from PE and PTC placentae. (D) SMPD1 and ASAH1 protein expression in L and M subfractions from PE and PTC placentae. (E) Immunofluorescence analysis of CER and LAMP1 of placental sections from PTC and PE to visualize CER compartmentalization to lysosomes. (F) CER levels in L subfractions from villous explants treated with SNP or control vehicle. CANX, calnexin.
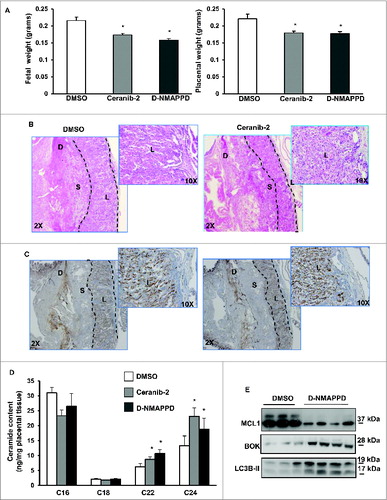
ASAH1 inhibition in pregnant mice
To establish the impact of ASAH1 function in placentation, we administered 2 different ASAH1 inhibitors, namely Ceranib-2 and D-NMAPPD, to pregnant mice starting at E7.5. While no changes in maternal weight were observed, both inhibitors reduced fetal and placental weights at E13.5 (). The fetal weight reductions were in the range of severely growth restricted human fetuses (approximately 15%) at 28 to 32 wk of gestation. In addition, striking abnormalities in placental architecture were observed in Ceranib-2-treated animals including compaction and reduced branching of the labyrinthin zone as well as reduction of the junctional zone and diminished vascularization (). Similar changes in placental architecture were observed with D-NMAPPD (Fig. S4). Importantly, inhibition of ASAH1 activity in pregnant mice led to increases in long-chain CERs in the murine placentae, similar to that seen in the human PE placentae (). These data further underscore the importance of examining altered ASAH1 expression during placental development and in disease.
Figure 6. Addition of Ceranib-2 or D-NMAPPD alters murine placental development. (A) Fetal (left) and placental (right) weights from CD1 mice injected with ASAH1 inhibitor, ceranib-2 or D-NMAPPD (20 mg/kg), or DMSO vehicle (DMSO, n = 9; Ceranib-2, n = 13; D-NMAPPD, n = 8, 2 separate litters, *P<0.05). (B) H&E staining of placental sections from mice injected with ceranib-2 vs DMSO. (C) Placental sections stained with angiogenesis marker, CD34, from ceranib-2-injected mice compared to DMSO (D = decidua, S = spongy layer, L = labyrinth). (D) Placental ceramide levels in mice injected with either ceranib-2 or D-NMAPPD compared to DMSO. (DMSO, n = 7; Ceranib-2, n = 13; D-NMAPPD, n = 4 *P < 0.05). (E) MCL1, BOK and LC3B-II expression in pregnant mice injected with D-NMAPPD compared to DMSO vehicle.
CER and autophagy in JEG3 cells
CERs, known inducers of apoptosis, have recently also been implicated in autophagy, a catabolic lysosomal degradative process that links networks of cellular metabolism and death.Citation24 Since apoptosis and autophagy are disrupted in preeclampsia,Citation17,18,25 it is plausible that elevated CERs seen in PE trigger these events. To determine CER effects on trophoblast cell fate, we treated JEG3 cells with a synthetic C16 CER. Exposure of JEG3 cells to C16 CER for 6 h caused a significant increase in the expression of autophagic marker LC3B-II when compared to cells treated with control (100% ethanol) vehicle (n = 6, P = 0.039) (, upper panel). Levels of SQSTM1/p62, an established marker of autophagic flux involved in LC3 associations to ubiquitinated substrates, were also significantly increased in JEG3 cells following a 6-h exposure to C16 CER (n = 6, P = 0.0329) (, lower panel). After 24 h of C16 CER treatment LC3B-II and SQSTM1 expression disappeared while cleaved CASP3 (caspase 3, apoptosis-related cysteine peptidase) appeared, suggesting an early induction of autophagy followed by a later occurrence of apoptosis (, bottom panel). To further dissect the role of CERs in autophagy we used 2-oleoylethanolamine (2-OE), a well-known inhibitor of ASAH1 activity.Citation26 We reasoned that ASAH1 inhibition in JEG3 cells would increase CERs, thereby mimicking the scenario found in PE. Western blot analysis showed that treatment of JEG3 cells with 2-OE for 6 h resulted in a significant increase in the expression of both autophagic markers: LC3B-II (n = 6, P = 0.042) and SQSTM1 (n = 6, P = 0.0118) (). We next examined the expression of BECN1, a BH3-only BCL2 family member that is central in the crosstalk between apoptosis and autophagy. Treatment of JEG3 cells with 2-OE resulted in a significant increase in BECN1 protein expression (n = 6, P = 0.0423) (Fig.7B). Since autophagy proceeds through fusion of autophagosomes with lysosomes when degradation of cytoplasmic constituents is completed, we analyzed lysosomal activity using LysoTracker®Red, a dye taken up by activated lysosomes. Increased lysosomal activity was detected in JEG3 cells after 6 h treatment with C16 CER (Fig. S3). Additionally, 2-OE exposure led to a concentration-dependent increase in lysosomal activity in JEG3 cells (Fig. S3). TEM of JEG3 cells treated with C16 CER showed a marked number of vacuolar-like structures typifying autophagosomes (indicated by black arrowheads) (). In addition, the C16 CER-induced increase in the number of lysosomes noted with TEM (indicated by black arrows) is consistent with the LysoTracker®Red findings.
Figure 7. Ceramide triggers autophagy in JEG3 cells. (A) LC3B-II, SQSTM1 and cleaved CASP3 (Cl−CASP3) protein expression in JEG3 cells treated with C16 CER or vehicle (C). (B) Autophagy markers, LC3B-II, BECN1, and SQSTM1, in JEG3 cells cultured with ASAH1 inhibitor 2-OE (25 μM or 100 μM) or control vehicle (C). (C) Representative transmission electron micrographs of JEG3 cells treated with C16 CER or 100 μM 2-OE compared to control vehicle. Autophagy is shown by increased number of lysosomes (arrows) and formation of autophagosomal structures (arrowheads). N, nucleus. Scale bars: 2 μm. (D) JEG3 cells treated with C16 CER or 2-OE were labeled with LysoTracker® Red and stained for LC3B. LC3B (green), LysoTracker® Red and nuclear DAPI (blue). (E) LC3B-II expression in JEG3 cells treated with C16 CER (upper panel) or 2-OE (middle panel) in the presence and absence of bafilomycin A1 (Baf A1) or of 3-methyladenine (3-MA; lower panel). (F) MCL1 and BOK expression in JEG3 cells treated with 20 μM or 50 μM C16 CER (upper panel) or 25 or 50 μM 2-OE (lower panel).
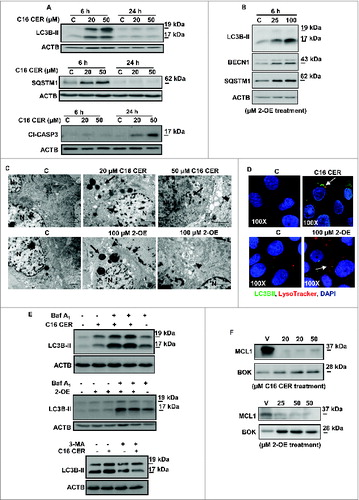
TEM also revealed the presence of autophagosomes and autolysosomal structures (indicated by black arrowheads) in cells exposed to 2-OE while cytoplasmic vacuolization was absent in vehicle (DMSO)-treated control cells (, bottom panels). To establish autophagic flux, we examined LC3B-II expression in JEG3 cells cultured in the presence or absence of C16 CER or 100 μM 2-OE following treatment with bafilomycin A1 (BafA1). Treatment of JEG3 cells with C16 CER and 2-OE resulted in an increased colocalization of LC3B-II with LysoTracker®Red relative to vehicle-treated control cells, supporting autolysosomal fusion and completion of autophagy (). Moreover, both C16 CER and 2-OE treatment increased LC3B-II expression, an effect that was further augmented by BafA1indicating that flux through the autophagic pathway was inhibited (). In addition, treatment of JEG3 cells with 3-methyladenine (3-MA; 5 mM), a PtdIns3K and PI3K inhibitor that blocks early events of autophagy, abrogated the C16 CER-induced effect on LC3B-II expression (, lower panel) demonstrating suppression of autophagy. Thus, CERs directly or indirectly via inhibition of ASAH1 activity promote an autophagic response. We have recently reported that increased autophagy found in PE is due to an altered BOK-MCL1 (BCL2-related ovarian killer-myeloid cell leukemia 1) rheostat.Citation18 Hence, we investigated whether CERs influence the BOK-MCL1 system. Exposure of JEG3 cells to either C16 CER or 2-OE resulted in a marked decrease of prosurvival MCL1 and increase in prodeath BOK (). Notably, administration of ASAH1 inhibitor D-NMAPPD to pregnant mice at E7.5 led to a similar alteration in the placental BOK-MCL1 rheostat at E13.5, favoring BOK and thereby augmenting autophagy as shown by increased LC3B-II production ().
Discussion
Herein, we demonstrate for the first time that changes in SPT, ASAH1, and SMPD1 activities offset the delicate balance between CERs and its metabolites in PE. In combination with an increased de novo CER synthesis via SPT activation, reduced ASAH1 expression together with diminished activity result in elevated CER levels, particularly in the trophoblastic layer and syncytial knots of PE placentae. SMPD1 activity was reduced in PE placentae and, therefore, SM degradation to CER via this enzyme did not contribute to the increase in CER. No alteration in lysosomal degradation of glycosylceramides was observed between PE and PTC placentae, ruling out that their breakdown contributed to the elevated lysosomal CER levels in PE. Pharmacological inhibition of ASAH1 activity in pregnant mice increases placental CERs and negatively affects placental weight and development similar to that seen in human PE pathology. Using human JEG3 choriocarcinoma cells and placental villous explants we further demonstrate that oxidative stress conditions, typical of PE pathology, are responsible for decreased ASAH1 expression and impaired N-glycosylation of SMPD1, preventing its intracellular trafficking and activation. Also, we provide evidence that TGFB3 via E2F4 transcriptional repressor is responsible for downregulation of ASAH1 expression while oxidative stress-induced changes in SMPD1 trafficking and activity are directly mediated via TGFB3. As a result, CERs accumulate and trigger autophagy by shifting the BOK-MCL1 rheostat toward cell death-inducing BOK. Hence, in PE, oxidative stress favors CER accumulation thereby contributing to the increased placental cell death found in this disease.Citation17,18,27
Sphingolipid accumulation due to genetic alterations in their regulatory enzymes characterizes various lysosomal sphingolipid storage disorders in humans, including Niemann-PickCitation28 and Farber diseases.Citation9 Our finding of reduced ASAH1 transcription in conjunction with CER accumulation in lysosomes from PE placentae identifies preeclampsia as a new sphingolipid storage disorder, which results from the oxidative stress milieu typical of this pathology.Citation16,21 There is increasing support for a role of placental-derived circulating factors in the onset of the maternal endothelial dysfunction (i.e., increased hypertension) in pregnancies associated with PE.Citation15 Our data demonstrate that both placenta and sera of PE women exhibited increased levels of specific CERs. Hence, it is plausible that increased CERs found in the circulation of women affected by PE may be, in part, of placental origin. Our observation that CERs were primarily elevated in the trophoblastic layers and syncytial knots of preeclamptic villi underscores this possibility as these structures are shed in the circulation.Citation15 Elevation of vascular CERs in spontaneously hypertensive rats leads to vasoconstrictionCitation29 and humans with essential hypertension have increased plasma CER levels compared to normotensive patients.Citation30 Hence, elevation of CERs in maternal sera may contribute to the hypertensive phenotype characteristic of PE.
CER accumulation causes cell death in cystic fibrosis and cancer.Citation10,31,32 Furthermore, it has been reported that CERs are important regulators of tumor cell death following exposure to stress stimuliCitation33,34 and changes in sphingolipid metabolism impact on pancreatic β-cell function.Citation35 Our in vivo and in vitro findings of CERs and cell death are in agreement with these previous observations. Notably, we established a critical role for CERs in placental autophagy, a cellular event that in some instances functions as an alternative cell death pathway.Citation10 CERs have been shown to trigger autophagy by activating the MAPK8/JNK1 (mitogen-activated protein kinase 8) pathway thereby freeing and allowing BECN1 to perform its role in the initiation of the autophagic response.Citation36 Similarly, we found that inhibition of the ASAH1 enzyme with 2-OE in JEG3 cells, led to increased expression of proteins involved in the induction of this catabolic pathway, including BECN1, SQSTM1, and LC3B-II. It is likely that this increase in autophagy is due to the accumulation of CERs since newly synthesized CERs are not sufficiently degraded by ASAH1 in the presence of 2-OE. Our finding of increased autophagy in JEG3 cells after C16 CER exposure supports this idea. We also demonstrate that CERs alter the BOK-MCL1 rheostat in JEG3 cells in favor of BOK, which we have shown to enhance autophagy in PE.Citation18
Autophagy can serve as a stress adaptation to avoid cell death; however, excessive autophagy can bring to cellular demise.Citation10 Our in vitro findings indicate rapid activation of autophagy upon C16 CER treatment. This is in line with a previous report showing that exogenous C16 CER acts as an inducer of autophagy in HCT116 human colon carcinoma cells.Citation37 Hence, CER-induced autophagy in trophoblast cells may be an attempt by the cells to swiftly respond to CER accumulation. Previous studies have shown that accumulation of CERs, DHCers, and SPH in the autolysosome can cause membrane destabilization resulting in the release of cathepsins leading to activation of CASP3 and subsequent apoptosis.Citation9 In line with these observations we found activation of CASP3 following 24-h treatments with C16 CER, which may be indicative of autophagy progressing into cell death. Thus, CER may gauge the level of cell injury and depending on downstream factors determines specific biological outcomes.
ASAH1 is a lipid hydrolase that directly regulates CER metabolism by catalyzing its degradation into SPH and fatty acid.Citation3 ASAH1 is essential for mammalian development as Asah1 deficiency in mice results in embryonic lethality due to increased pools of CERs.Citation38 Other studies have shown that ASAH1 is overexpressed in prostate cancer, which may be a compensatory mechanism to lower CER levels, thereby providing protection from cell death.Citation39 At the transcriptional level, ASAH1 is regulated by a variety of transcription factors;Citation40 however, little is known about the role of hypoxia or oxidative stress on ASAH1 gene expression. Herein, we show that ASAH1 expression and activity is decreased in preeclampsia, a disorder associated with oxidative stress. Imposing an environment of hypoxia/oxidative stress on placental cells using low oxygen and SNP caused similar effects on CERs and ASAH1 protein expression as those observed in PE placentae. Our observations of elevated E2F4, but not E2F1, levels and augmented E2F4 binding to the ASAH1 promoter in preeclampsia as well as E2F4 siRNA knockdown stimulation of ASAH1 expression, support the idea of transcriptional repression of ASAH1 expression by E2F4 in preeclampsia. Together with our observation of TGFB3 inducing E2F4 expression, these findings provide the first evidence that hypoxia/oxidative stress via TGFB3 and subsequently, E2F4, has a detrimental effect on ASAH1 expression, thereby contributing to increased levels of CERs found in preeclampsia.
In the present study, we show that ASAH1 inhibition in pregnant mice using 2 different inhibitors increases placental CERs. Specifically long-chain CERs (C22 and C24) were elevated. In contrast, PE placentae exhibit significant increases in C16 and C18 CER compared to age-matched control placentae. Comparison of CER composition of normal murine and human placentae revealed that the murine placenta is enriched in C16 CER while C24 CER is the predominant CER in the human placenta (Table S1). This suggests that particular CERs may have diverse functions during placental development in different species. Intriguingly, ASAH1 inhibition during pregnancy in mice led to reduced fetal and placental growth, abnormal placental development including impaired vascularization as well as altered BOK-MCL1 expression and increased autophagy, all characteristics of PE pathology.Citation12,17,18,41 These findings strongly suggest that reduced ASAH1 expression in PE placentae contributes to CER accumulation, thereby influencing placental cell fate and development via the BOK-MCL1 system.
SMPD1 is another key enzyme in generating CERs in response to cellular stress.Citation42 Previous studies have shown that increased SMPD1 activity triggered by hypoxic conditions contributes to CER generation and consequently to the apoptotic response in neuronal cells.Citation43 In contrast, we observed a downregulation of SMPD1 activity in PE placentae. Following synthesis in the ER, SMPD1 undergoes extensive post-translational modification during its transport to the lysosomes where it becomes active. Six N-glycosylation sites are essential for the trafficking, processing, folding, and activity of this enzyme.Citation3,4 In the present study, we provide the first evidence that N-glycosylation of SMPD1 is impaired in PE placentae. Hypoxia affects key enzymes involved in glycosylation, including glucosyltransferases and sugar transporters.Citation44 Indeed, we observed that SNP-induced oxidative stress led to a buildup of SMPD1 precursor in the ER and impaired activity of the enzyme in a similar fashion as that seen in PE, suggesting that N-glycosylation of SMPD1 is affected by oxidative stress. Various hypoxic (oxidative stress) responses in PE are mediated via the HIF1A-TGFB3 axis.Citation20,45 Our finding of SMPD1 precursor accumulation and reduced activity in the presence of TGFB1/3 suggests that the activated HIF1A-TGFB3 axis in PE is responsible for the observed N-glycosylation changes of SMPD1 leading to reduced shuttling to the lysosomes and therefore activity. Thus, elevated CER levels in PE are not due to increased SM degradation via SMPD1.
Our data infer that the CERs in PE placentae are not originating from SM but are generated de novo. In line with a heightened flux through the de novo pathway we observed increased SPT activity and high levels of Sa and DHCers in PE placentae. Activation of the de novo pathway in PE led to an elevation in Golgi-associated CER but not ER-associated CER (preliminary data not shown). No significant increase in the total concentration of SM was noted. Parallel accumulation of CER and SM as a result of various stressors has been reported.Citation9 Likewise, increased levels of SMs have been found in Wharton jelly, the gelatinous connective tissue that surrounds the umbilical cord, from preeclamptic mothers.Citation46 It is plausible that SGMS/sphingomyelin synthase activity is reduced in PE placentae, which would explain the absence of an increase in total SM.
In conclusion, our results support the idea that the rheostat between CERs and its metabolites governs trophoblast cell fate and that both hypoxia and SNP-induced oxidative stress impinge on sphingolipid homeostasis. In PE placentae, reduced ASAH1 expression and activity, induced by the oxidative stress via HIF1A and subsequently TGFB3 and E2F4, together with an elevated de novo CER synthesis favors an elevation in CERs, which in turn alters the BOK-MCL1 rheostat leading to augmented autophagy and cell death typical of this disorder.
Materials and Methods
Placental tissue and sera collection
Informed consent was obtained from each individual. Tissue and serum collection was carried out in agreement with collaborating institutions' ethics guidelines (ethics guidelines of the University of Toronto's Faculty of Medicine and Mount Sinai Hospital) by Biobank of Mount Sinai Hospital and by the O.I.R.M Sant' Anna Hospital, University of Turin, Italy in accordance with the Helsinki Declaration of 1975. First trimester human placental tissues (5 to 8 wk of gestation, n = 24) were obtained at once following elective termination of pregnancies. The PE group (PE, n = 68) was selected on the basis of American College of Obstetrics and Gynecology clinical and pathological criteria.Citation47 Placental tissues obtained from age-matched preterm control (PTC, n = 64) and from term control (TC, n = 23) pregnancies deliveries from healthy pregnancies with normally grown fetuses that did not have signs of PE or other placental dysfunctions were included as controls. Serum samples were obtained prior delivery from women exhibiting clinical signs of early onset PE (PE, n = 10) and from normotensive PTC, n = 10. Patients' information and clinical parameters are outlined in .
Table 1. Clinical parameters of the study population
Mouse experiments
CD1 mice were obtained from Charles River (St. Constant, QC). Animal studies were conducted abiding by the criteria established by the Canadian Council for Animal Care and approved by the Animal Care and Use Committee of the Hospital for Sick Children, Toronto, ON. Ceranib-2 and D-NMAPPD injections: Timed pregnant CD1 mice were intraperitoneally injected daily starting at E7.5 with either ceranib-2 (20 mg/kg; Cayman Chemical, 11092) or D-NMAPPD (20 mg/kg; Cayman Chemical, 10006305). Both ASAH1 inhibitors were dissolved in DMSO and mice injected with DMSO (as per body weight) only were used as controls. At E13.5 placentae and fetuses were microdissected, weighed and gross morphology assessed. Placental tissue was then snap frozen for biochemical analysis or fixed in 4% paraformaldehyde for histology.
Histology
Placentae were sectioned and stained with Harris' haematoxylin and eosin. Adjacent sections were probed with rat anti-CD34 antibody (Abcam, ab8158).
Mass spectral analysis
Placental tissues and sera from PE and PTC pregnancies as well as JEG3 choriocarcinoma cells and human villous explants treated with and without SNP (Sigma, 228710) or cultured at 3% or 21% oxygen were processed for lipid extraction. Lipid extraction was performed according to Bligh and Dyer.Citation48 Following extraction, sphingolipids were separated using high performance liquid chromatography (LC) and then analyzed by tandem mass spectrometry (MS/MS) at the Analytical Facility for Bioactive Molecules of the Hospital for Sick Children, Toronto, ON (see detailed procedures in the online Supplemental Materials).
MALDI-mass spectral imaging
Placental tissues from PE and PTC pregnancies were processed for MALDI-spectrometry imaging. A time-of-flight tandem mass spectrometer (AB SciexTOF/TOFTM 5800 System, AB SCIEX, Vaughan, ON) was used to acquire the images (see detailed procedure in the online Supplemental Materials).
First trimester villous explant and cell line cultures
Chorionic villous explant and human choriocarcinoma JEG3 cells cultures were performed as previously described.Citation20,49 Briefly, small fragments of placental villi were dissected and cultured in serum-free DMEM/F12 (GIBCO-BRL, 11039-021), supplemented with 10,000 units/ml of penicillin/streptomycin. Villous explants were placed at 37°C in either standard culture condition (5% CO2 in 95% air) or kept in an atmosphere of 3% O2/93% N2/5% CO2. Human choriocarcinoma JEG3 cells seeded at a density of 1.5 × 10⁵ cells/well into 6-well plates were maintained at 37°C in standard conditions and cultured in EMEM media (ATCC, 30-2003) supplemented with 10% heat-inactivated fetal bovine serum.
SNP and TGFB treatments: JEG3 cells and human villous explants were treated with and without either SNP (2.5, 5.0 and 10 mM) or TGFB1 and TGFB3 (5 to 10 ng/ml, recombinant human TGFB1 (R&D Systems, 420-B3) and TGFB3 (R&D Systems, 243-B3) for 24 h. Cells were collected in RIPA buffer solution for western blotting or fixed in 4% paraformaldehyde to perform immunofluorescence analysis. Explants were washed in cold PBS (phosphate buffered saline; 137 mM NaCl, 2 mM KCl, 10 mM Na2HPO4, 1.8 mM KH2PO4) and snap frozen for protein extraction. SNP induced oxidative stress was confirmed by Amplex® Red Hydrogen Peroxide/Peroxidase Assay kit (Life Technologies, A22188).
C16-ceramide and 2-oleoylethanolamine treatments: JEG3 cells were treated with and without 2-oleoylethanolamine (25 to 100 μM 2-OE; Invitrogen, 0383) dissolved in DMSO or C16CER (20 to 50 μM C16 CER; Enzo Life Sciences, BML-SL115) dissolved in 100% ethanol. After 6 and 24 h of treatment, cells were collected for either western blotting or fixed in 4% paraformaldehyde for immunofluorescence analysis.
Subcellular fractionation
Subcellular fractions were prepared by differential centrifugation. Briefly, placenta tissues and JEG3 cells treated with SNP were homogenized in cold buffer (0.25 M sucrose, 1 mM EDTA in 10 mM Tris-HCl, pH 7.4) and subjected to a series of centrifugations to obtain pure lysosomal and microsomal fractions. Homogenates were first centrifuged at 1,000 × g for 10 min after which the resulting supernatant fractions were spun at 12,000 × g for 10 min. The subsequent supernatant fractions were then centrifuged at 25,000 × g for 15 min to pellet lysosomes, while the resulting supernatant fractions were subjected to a 105,000 × g centrifugation for 60 min to spin down microsomes. All centrifugations were performed at 4°C. The lysosomal and microsomal fractions were then analyzed by western blotting for the presence of lysosomal (LAMP1) and microsomal (CANX) markers and subjected to extraction for lipid analysis. In addition, to further validate the purity of lysosomal fractions, ACP2/acid phosphatase (a lysosomal enzyme) activity was assayed by incubating lysosomal and microsomal fractions as well as total homogenate with citrate buffer containing 5.5 mM p-nitrophenylphosphate, for 30 min at 37°C. Reactions were stopped with addition of 0.05 M NaOH and formation of para-nitrophenol (yellow at alkaline pH) was measured at 405 nm.
RNA analysis
Real-time PCR analysis using specific Taqman primers and probes was performed as previously described.Citation14 In brief, RNA was extracted from frozen placental tissue using an RNeasy Mini Kit (Qiagen, 74134). All samples were treated with DNase I to eliminate genomic DNA contamination followed by reverse transcription using random hexamers (Applied Biosystems, N8080127) and amplified by 20 cycles of PCR (5 min at 95°C, cycle: 30s at 95°C, 30 s at 55°C and 1.5 min at 72°C). Analysis was performed using the DNA Engine Opticon 2 System (Bio-Rad Canada, Mississauga, ON) as previously described.Citation12 Taqman Universal Master Mix and specific Taqman primers and probe for SMPD1, ASAH1, and 18S were purchased from ABI as assays-on-demand for human genes. Data were normalized against expression of 18S rRNA using the 2ΔΔCt formula as previously described.Citation12
Antibodies, HRP substrates, and western blot analysis
Western blotting was performed using tissue and cell lysates from PTC and PE placentae and JEG3 cells as previously described.Citation12 Antibodies against ACTB (actin, β) (I-19, sc-1616, goat [WB 1:1000]), ASAH1 (T-20, sc-28486, goat [IF 1:200, WB 1:350]), E2F1 and E2F4 (sc-193 and sc-866, rabbit [WB1:500], MCL1 (sc-819, rabbit; WB 1:500), SMPD1 (H-181, sc-11352, rabbit [IF 1:200, WB 1:350]), and SQSTM1 (G-10, sc-28359, mouse monoclonal [WB 1:500]) were purchased from Santa Cruz Biotechnology. Rabbit anti-BECN1 (3495S, [WB 1:1000]), cleaved CASP3 (9661S, [1:1000]) and LC3B (2775S, [WB 1:1000]) antibodies were obtained from Cell Signaling Technology. CALR/calreticulin (FMC 75, ab22683, mouse monoclonal [IF 1:2000]) and rat anti-CD34 (MEC 14.7, ab8158, [IHC 1:25]) were purchased from Abcam. Mouse monoclonal anti-CANX/calnexin (AB2301, [WB 1:1000]) and rabbit polyclonal anti-LAMP1 (AB2971, [WB 1:1000]) were purchased from Millipore. Rabbit polyclonal anti-BOK was purchased from Abgent (AP16794, WB 1:500). Monoclonal anti-ceramide mouse IgM (MAB-0013 [IF: 1:200]) was purchased from Glycobiotech. Secondary antibodies were horseradish peroxidase-conjugated donkey anti-goat, goat anti-rabbit, goat anti-mouse IgG (Santa Cruz Biotechnology, sc-2020, sc-2004, sc-2005); Alexa Fluor® 594: donkey anti–rabbitIgG (A21207), Alexa Fluor® 594: goat-anti-mouse IgM [μ chain] (A-21044) and Alexa Fluor® 488: donkey anti-rabbit IgG (A21206) [IF 1:200, Invitrogen] and rabbit anti-rat IgG, biotin conjugated (Vector Labs, BA-2020). Biotinylated concanavalin A (C2272, [WB: 3μg/mL]) and streptavidin-peroxidase (S5512) were purchased from Sigma Aldrich.
Western blotting was performed using tissue and cell lysates from PTC and PE placentae and JEG3 cells as previously described.Citation12 Primary antibodies were used in the dilutions stated above. Following incubation with HRP-conjugated secondary antibodies, membrane blots were visualized using enhanced chemiluminescence (PerkinElmer Inc., NEL103001EA) and imaged on X-ray film (GE Healthcare). All western blots were confirmed for equal protein loading by probing for ACTB. For quantification purposes, bands of interest were digitized for analysis using a CanoScanLiDE20 image scanner (Canon Canada Inc.). Quantification of western blots was accomplished by densitometry using Image Quant 5.0 software (Molecular Dynamics).
Immunoprecipitation analysis
Placental tissue lysates were precleared using a combination of protein A-agarose (10 μL; Santa Cruz Biotechnology, sc-2001) and protein G-agarose (10 μL; Santa Cruz Biotechnology, sc-2002). Lysates were then incubated overnight with antibodies against SMPD1. Nonimmune rabbit IgG (Santa Cruz Biotechnology, sc-2027) was used as a negative control. The immunoprecipitated lysates were subsequently immunoblotted for SMPD1. SMPD1 N-linked oligosaccharide chains were detected using biotinylated concanavalin A with stepavidin-peroxidase.
Chromatin immunoprecipitation (ChIP) assay
ChIP was performed using tissue lysates from PTC and PE placentae as previously described.Citation50 Briefly, tissues were fixed in formaldehyde, lysed in lysis buffer (10 mM Tris, 10 mM NaCl, 0.2% Nonidet P-40 [Sigma, N6507], pH 8.0 containing protease inhibitors [Roche, 11873580001] and PMSF [Sigma, P7626]), and nuclei were collected by centrifugation. Nuclei were then lysed in ice-cold nuclei lysis buffer (50 mM Tris, 10 mM EDTA, 1% sodium dodecyl sulfate [SDS; Wisent, 880 550-CL]), 10 mM sodium butyrate (Sigma, B5887), protease inhibitors, 50 μg/ml PMSF, pH 8.1), sonicated and precleared with protein G-coated agarose beads (Santa Cruz Biotechnology, sc-2002). Equal aliquots of precleared chromatin samples were incubated overnight with specific rabbit anti-E2F4 or nonspecific rabbit IgG at 4°C. An additional aliquot of chromatin sample, 20% of the volume of other aliquots (input), was saved for the subsequent PCR analysis. Immune complexes collected on protein G-coated agarose beads were eluted and incubated at 65°C with RNaseA (Abcam, ab52579) in 0.3 M NaCl. Samples were digested with proteinase K (Abcam, ab51501) and immunoprecipitated DNA was purified by extraction with phenol/chloroform followed by ethanol precipitation. Purified immunoprecipitated DNA and input DNA were resuspended in water and amplified by PCR using primers corresponding to the human ASAH1 promoter region (EpiTect ChIP qPCR primer assay for human ASAH1, SABiosciences, A Qiagen 334471).
SPT activity
SPT activity was determined according to a modified method of Rütti et al.Citation51 Placental tissues were homogenized in lysis buffer (50 mM HEPES-NaOH, pH 8, 1 mM EDTA pH 8, 0.1% w/v sucrose monolaurate (Sigma, 84110). Lysates were then centrifuged at 2500 × g for 2 min and supernatant aliquots (100 100 μg mu;g of total protein) were incubated at 37 ˚C in 10 mM L-serine, 0.25 mM palmitolyl Co-A (Avanti Polar Lipids, 870716), 0.25 mM pyridoxal 5'-phosphate (total volume 200 μl; Sigma, P9255) with and without 1 mg/mL myriocin (negative control; Sigma, D3314). After 30 min, the reaction was stopped by addition of 500 μL ice-cold methanol. Standards (3-keto dihydrosphingosine (3-KDS; Matreya LLC, 1876) in 200 μL lysate buffer) and samples were spiked with 10 ng sphingosine-d7 (internal standard/IS; Avanti Polar Lipids, 860657) and lipids were extracted by adding 800 μL ultrapure water, 500 μL methanol, and 2 mL of chloroform. The chloroform layer was collected, the aqueous layer was re-extracted and the chloroform layer was recombined with the previous extract. Extracts were taken to dryness under stream of nitrogen, reconstituted in 100 μL 9:2 ethanol/water + 0.2% formic acid and analyzed by LC-MS/MS. HPLC was performed using an Agilent 1200 Series binary pump and auto-sampler. The analytical column was a Kinetex XB C18 (50 × 3.0 mm, 2.6 6 μm mu;m particle size) from Phenomenex. The isocratic HPLC mobile phases consisted of 40:60 A:B (A) = 0.2% formic acid in water and (B) = 0.2% formic acid in acetonitrile. A flow rate of 0.6 mL/minute was used. The HPLC system was coupled to an AB SCIEX API 4000 triple-quadrupole mass spectrometer. Positive ESI multiple reaction monitoring (MRM) was used. The product 3-KDS was quantified by monitoring the 300.4/270.4 m/z transition and that of the IS (307.4/289.5 m/z) and using the area ratios of the standards to create a standard curve by which the concentrations of 3-KDS in the samples were calculated.
ASAH1 activity
ASAH1 (N-acylsphingosine amidohydrolase [acid ceramidase] 1) activity was measured by the conversion of C12:0 ceramide to lauric acid according to a modified method of Realini et al.Citation52 Placental tissues were homogenized in cold buffer (50 mM Tris-HCl, 0.32 M sucrose [Sigma, S-9378], pH 7.4), centrifuged at 800 × g for 15 min at 4˚C to remove debris and supernatants were then centrifuged for 30 min at 12,000 × g at 4˚C. Resulting pellet fractions were resuspended in PBS and subjected to 2 freeze-thaw cycles at −80˚C. Samples were then centrifuged at 100,000 × g for 1 h at 4˚C and protein content in the supernatant fractions was quantified. Supernatant aliquots (10 μg of protein) were then mixed with assay buffer, pH 4.5 (100 mM sodium citrate dihydrate, 150 mM sodium chloride, 100 mM sodium phosphate monobasic, 0.1% v/v IGEPAL CA-630 [Sigma, I-8896], 3 mM DTT) to a final volume of 190 uL. Ceramide 12:0 (Avanti Polar Lipids, 860512) was then added to a final concentration of 50 mM and samples were incubated for 1 h at 37˚C. Activity was stopped with 600 μL ice cold 2:1 chloroform:methanol. Internal standard (100 ng heptadecanoic acid; Sigma, H3500) was added and samples were centrifuged at 800 × g for 10 min. The organic layer was transferred into conical glass tubes and dried under a gentle stream of nitrogen at 37˚C. Residues were reconstituted in 200 μL methanol and analyzed by LC-MS/MS. A standard curve of lauric acid (Cayman Chemical, 10006626) was also prepared ranging from 0.5 to 250 μM. HPLC was performed using an Agilent 1200 Series binary pump, and auto-sampler. The analytical column was Kinetex XB C18 (50 × 3 mm, 2.6 6 μm mu;m particle size) from Phenomenex. The HPLC mobile phases consisted of A) 5 mM ammonium acetate, 0.25% acetic acid and B) 5 mM ammonium acetate in methanol, 0.25% acetic acid. A flow rate of 0.6 mL/minute was used and samples were eluted using a gradient starting at 60% B, holding for 1 min, and then increasing to 100% B over 1.5 min, holding at that condition for 1 min, and then returning to the starting conditions, for a total of 5 min. The HPLC system was coupled to an AB SCIEX API5000 triple-quadrupole mass spectrometry. Negative ESI multiple reaction monitoring (MRM) was used. Lauric acid was quantified by monitoring the 199.17/199.17 m/z transition and that of the IS (269.3/269.3 m/z) and using the area ratios of the standards to create a standard curve by which the concentrations of lauric acid in the samples were calculated.
SMPD1 activity
SMPD1/acid sphingomyelinase (sphingomyelin phosphodiesterase 1, acid lysosomal) activity was assessed in placental tissue lysates using an Echelon SMPD1 assay kit according to the manufacturer's protocol (Echlon Bioscience, K-3200). Briefly, 50 μg of protein lysate from placental tissues and 30 μg of protein lysate from JEG3 cells and human villous explants were used to determine SMPD1 activity. After incubation with the SMPD1 substrate at 37°C for 3 h SMPD1 activity was analyzed using a 96-well fluorescence microtiter plate reader (Tecan Infinite M200, Tecan US Inc., Morrisville, NC) at 360 nm excitation and 460 nm emission. The enzyme activity was calculated from the slope of the graph of intrinsic fluorescence plotted against time.
GBA activity
GBA (glucosidase, β, acid) activity was measured by incubating 2 to 4 μg of lysosomal protein at 45°C in a 50 mM sodium acetate buffer (pH 5.0) containing 2 mM p-nitrophenyl-β-D-glucopyranoside (Sigma, N7006). After a 10-min incubation, the reaction was stopped with addition of 1M Na2CO3 and formation of para-nitrophenol (yellow at alkaline pH) was measured at 405 nm. Specific activity was defined as μmol of para-nitrophenol formed per mg of protein per min.
Hydrogen peroxide/peroxidase assay
Villous explants were treated with SNP (5.0 mM) or vehicle. After 24 h condition media was collected. H2O2 from condition media was detected according to the manufacturer's instruction (Amplex® Red Hydrogen Peroxide/Peroxidase Assay kit; Life Technologies, A22188). Briefly, H2O2 standard curve was prepared by serially diluting a 20 mM stock solution of H2O2. Condition media was loaded into a 96-well microplate. A working solution of 100 μM Amplex® red reagent and 0.2 U/mL horeseradish peroxidase was prepared and added to the condition media followed by a 30-min incubation. Fluorescence was measured using a microplate reader (Tecan Infinite M200) in the range of 530 to 560 nm and fluorescence emission detection at ∼590 nm.
Immunofluorescence staining
Immunofluorescence staining was performed as previously described.Citation17 In placental tissue sections, antigen retrieval was performed using 10 mM sodium citrate, pH 6.0, followed by treatment with Sudan Black (Sigma, 199664; 0.3% Sudan Black in 70% ethanol) to quench endogenous fluorescence. JEG3 cells were permeabilized with 0.2% Triton X-100 (Bioshop, TRX506) in PBS. Both placental sections and cells were preincubated at room temperature with 5% normal horse serum (Sigma, H0146) diluted in PBS to block nonspecific binding sites. Cells were then incubated with primary antibodies diluted in 5% blocking serum and antibody diluent (0.4% sodium azide, 0.625% gelatin [Sigma, G8150] in PBS) overnight at 4°C. For negative controls, the primary antibody was replaced by a corresponding concentration of nonimmune mouse (Santa Cruz Biotechnology, sc-2025), goat (Santa Cruz Biotechnology, sc-2028) or rabbit IgG. Cells/sections were treated with DAPI (4′,6-diamino-2-phenylindole) for nuclear detection. Fluorescence images were viewed and captured using the DeltaVision Deconvolution microscopy with z-stacking (GE Healthcare, Baie d'Urfe, Quebec). LysoTracker® Red (Invitrogen, L7528) was used to monitor lysosomal activity. LysoTracker® Red dye at a concentration of 1 mM in DMSO was mixed with culture media to a final concentration of 50 nM. Following treatment with 2-OE or C16 CER, cells were incubated in this mixture for 1 h at 37°C. Following 4% formaldehyde fixation, cells were washed in PBS and nuclei were subsequently counterstained with 4′,6-diamidino-2-phenylindole (DAPI; Sigma, D9542). To determine ASAH1 and SMPD1 lysosomal localization following SNP hindrance, JEG3 cells treated for 1 h with LysoTracker® Red (50 nM). Cells were subsequently fixed and incubated with primary antibody against ASAH1 or SMPD1 overnight and secondary detection was performed as described above. Fluorescence images were viewed and captured using the Delta Vision Deconvolution microscopy with z-stacking.
Transmission electron microscopy
JEG3 cells were treated either with DMSO (vehicle for 2-OE), 100 μM 2-oleoylethanolamine (2-OE), 100% ethanol (vehicle for C16 CER) or 50 μM C16CER were processed for TEM analysis. Samples for TEM were fixed in 2% glutaraldehyde in 0.1 M sodium cacodylate buffer, rinsed in buffer, postfixed in 1% osmium tetroxide in buffer, dehydrated in a graded ethanol series followed by propylene oxide, and finally embedded in Quetol-Spurr resin (Electron Microscopy Scieneces, 20440). Sections 100-nm thick were cut on an RMC MT6000 ultramicrotome, stained with uranyl acetate and lead citrate, and viewed with an FEI Tecnai 20 TEM (Hillsboro, Oregon).
Statistical analysis
Statistical analysis was performed using GraphPad Prism 4 software. For comparison of data between 2 groups we used the paired or unpaired Student t test, where applicable. For comparison between multiple groups, one-way analysis of variance (ANOVA) with post-hoc Dunnett or Newman-Keuls test was performed, where applicable. Statistical significance was defined as P < 0.05. Results are expressed as the mean ± SEM.
Disclosure of Potential Conflicts of Interest
No potential conflicts of interest were disclosed.
Supplemental Material
Supplemental data for this article can be accessed on the pub-lisher's website.
1034414_Supplemental_materials.pdf
Download PDF (334 KB)Acknowledgments
We thank Julia Garcia, Sruthi Alahari, and Angie Griffin for technical assistance.
Funding
This work was supported by the Canadian Institutes of Health Research (CIHR) Grant (MOP-89813) to Isabella Caniggia and Canadian Foundation of Innovation (CFI) grant to Martin Post. Martin Post is the holder of a Canadian Research Chair in Fetal, Neonatal, and Maternal Health.
References
- Hannun YA, Obeid LM. Principles of bioactive lipid signalling: lessons from sphingolipids. Nat Rev Mol Cell Biol 2008; 9:139-50; PMID:18216770; http://dx.doi.org/10.1038/nrm2329
- Hannun YA. Functions of ceramide in coordinating cellular responses to stress. Science 1996; 274:1855-9; PMID:8943189; http://dx.doi.org/10.1126/science.274.5294.1855
- Ferlinz K, Kopal G, Bernardo K, Linke T, Bar J, Breiden B, Neumann U, Lang F, Schuchman EH, Sandhoff K. Human acid ceramidase: processing, glycosylation, and lysosomal targeting. J Biol Chem 2001; 276:35352-60; PMID:11451951; http://dx.doi.org/10.1074/jbc.M103066200
- Ferlinz K, Hurwitz R, Moczall H, Lansmann S, Schuchman EH, Sandhoff K. Functional characterization of the N-glycosylation sites of human acid sphingomyelinase by site-directed mutagenesis. Eur J Biochem 1997; 243:511-7; PMID:9030779; http://dx.doi.org/10.1111/j.1432-1033.1997.511_1a.x
- Jenkins RW, Idkowiak-Baldys J, Simbari F, Canals D, Roddy P, Riner CD, Clarke JC, Hannun YA. A novel mechanism of lysosomal acid sphingomyelinase maturation: requirement for carboxyl-terminal proteolytic processing. J Biol Chem 2011; 286:3777-88; PMID:21098024; http://dx.doi.org/10.1074/jbc.M110.155234
- Brady RO, Kanfer JN, Mock MB, Fredrickson DS. The metabolism of sphingomyelin. II. evidence of an enzymatic deficiency in niemann-pick disease. Proc Nat Acad Sci U S A 1966; 55:366-9; PMID:5220952; http://dx.doi.org/10.1073/pnas.55.2.366
- Park JH, Schuchman EH. Acid ceramidase and human disease. Biochim Biophys Acta 2006; 1758:2133-8; PMID:17064658; http://dx.doi.org/10.1016/j.bbamem.2006.08.019
- Kolesnick RN, Kronke M. Regulation of ceramide production and apoptosis. Annual Rev Physiol 1998; 60:643-65; PMID:9558480; http://dx.doi.org/10.1146/annurev.physiol.60.1.643
- Zheng W, Kollmeyer J, Symolon H, Momin A, Munter E, Wang E, Kelly S, Allegood JC, Liu Y, Peng Q, et al. Ceramides and other bioactive sphingolipid backbones in health and disease: lipidomic analysis, metabolism and roles in membrane structure, dynamics, signaling and autophagy. Biochim Biophys Acta 2006; 1758:1864-84; PMID: 17052686; http://dx.doi.org/10.1016/j.bbamem.2006.08.009
- Young MM, Kester M, Wang HG. Sphingolipids: regulators of crosstalk between apoptosis and autophagy. J Lipid Res 2013; 54:5-19; PMID:23152582; http://dx.doi.org/10.1194/jlr.R031278
- Spiegel S, Cuvillier O, Edsall LC, Kohama T, Menzeleev R, Olah Z, Olivera A, Pirianov G, Thomas DM, Tu Z, et al. Sphingosine-1-phosphate in cell growth and cell death. Ann N Y Acad Sci 1998; 845:11-8; PMID:9668339; http://dx.doi.org/10.1111/j.1749-6632.1998.tb09658.x
- Soleymanlou N, Wu Y, Wang JX, Todros T, Ietta F, Jurisicova A, Post M, Caniggia I. A novel Mtd splice isoform is responsible for trophoblast cell death in pre-eclampsia. Cell Death Differ 2005; 12:441-52; PMID:15775999; http://dx.doi.org/10.1038/sj.cdd.4401593
- ACOG. Hypertension in pregnancy. Report of the american college of obstetricians and gynecologists' task force on hypertension in pregnancy. Obstet Gynecol 2013; 122:1122-31; PMID:24150027; http://dx.doi.org/10.1097/01.AOG.0000437382.03963.88
- Soleymanlou N, Jurisica I, Nevo O, Ietta F, Zhang X, Zamudio S, Post M, Caniggia I. Molecular evidence of placental hypoxia in preeclampsia. J Clin Endocrinol Metab 2005; 90:4299-308; PMID:15840747; http://dx.doi.org/10.1210/jc.2005-0078
- Redman CW, Sargent IL. Latest advances in understanding preeclampsia. Science 2005; 308:1592-4; PMID:15947178; http://dx.doi.org/10.1126/science.1111726
- Hubel CA. Oxidative stress in the pathogenesis of preeclampsia. Proc Society Exp Biol Med 1999; 222:222-35; http://dx.doi.org/10.1046/j.1525-1373.1999.d01-139.x
- Soleymanlou N, Jurisicova A, Wu Y, Chijiiwa M, Ray JE, Detmar J, Todros T, Zamudio S, Post M, Caniggia I. Hypoxic switch in mitochondrial myeloid cell leukemia factor-1/Mtd apoptotic rheostat contributes to human trophoblast cell death in preeclampsia. Am J Pathol 2007; 171:496-506; PMID:17600131; http://dx.doi.org/10.2353/ajpath.2007.070094
- Kalkat M, Garcia J, Ebrahimi J, Melland-Smith M, Todros T, Post M, Caniggia I. Placental autophagy regulation by the BOK-MCL1 rheostat. Autophagy 2013; 9:2140-53; PMID:24113155; http://dx.doi.org/10.4161/auto.26452
- Redman CW, Sargent IL. Microparticles and immunomodulation in pregnancy and pre-eclampsia. J Rep Immunol 2007; 76:61-7; PMID: 17482271; http://dx.doi.org/10.1016/j.jri.2007.03.008
- Caniggia I, Mostachfi H, Winter J, Gassmann M, Lye SJ, Kuliszewski M, Post M. Hypoxia-inducible factor-1 mediates the biological effects of oxygen on human trophoblast differentiation through TGFbeta(3). J Clin Invest 2000; 105:577-87; PMID:10712429; http://dx.doi.org/10.1172/JCI8316
- Myatt L, Cui X. Oxidative stress in the placenta. Histochem Cell Biol 2004; 122:369-82; PMID:15248072; http://dx.doi.org/10.1007/s00418-004-0677-x
- Marchesini N, Hannun YA. Acid and neutral sphingomyelinases: roles and mechanisms of regulation. Biochem Cell Biol 2004; 82:27-44; PMID:15052326; http://dx.doi.org/10.1139/o03-091
- Roberts JM, Hubel CA. Oxidative stress in preeclampsia. Am J Obstetric Gynecol 2004; 190:1177-8; PMID: 15167813; http://dx.doi.org/10.1016/j.ajog.2004.04.001
- Das G, Shravage BV, Baehrecke EH. Regulation and function of autophagy during cell survival and cell death. Cold Spring Harb Perspect Biol 2012; 4:1-14; PMID:22661635; http://dx.doi.org/10.1101/cshperspect.a008813
- Oh SY, Choi SJ, Kim KH, Cho EY, Kim JH, Roh CR. Autophagy-related proteins, LC3 and Beclin-1, in placentas from pregnancies complicated by preeclampsia. Reproductive Sci 2008; 15:912-20; PMID: 19050324; http://dx.doi.org/10.1177/1933719108319159
- Proksch D, Klein JJ, Arenz C. Potent inhibition of acid ceramidase by novel B-13 analogues. J Lipids 2011; 2011:1-8; PMID: 21490813; http://dx.doi.org/10.1155/2011/971618
- Longtine MS, Chen B, Odibo AO, Zhong Y, Nelson DM. Villous trophoblast apoptosis is elevated and restricted to cytotrophoblasts in pregnancies complicated by preeclampsia, IUGR, or preeclampsia with IUGR. Placenta 2012; 33:352-9; PMID:22341340; http://dx.doi.org/10.1016/j.placenta.2012.01.017
- Schulze H, Sandhoff K. Lysosomal lipid storage diseases. Cold Spring Harb Perspect Biol 2011; 3:a004804; PMID: 21502308; http://dx.doi.org/10.1101/cshperspect.a004804
- Spijkers LJ, Alewijnse AE, Peters SL. Sphingolipids and the orchestration of endothelium-derived vasoactive factors: when endothelial function demands greasing. Mol Cells 2010; 29:105-11; PMID:20127284; http://dx.doi.org/10.1007/s10059-010-0042-y
- Spijkers LJ, van den Akker RF, Janssen BJ, Debets JJ, De Mey JG, Stroes ES, van den Born BJ, Wijesinghe DS, Chalfant CE, MacAleese L, et al. Hypertension is associated with marked alterations in sphingolipid biology: a potential role for ceramide. PloS One 2011; 6:e21817; PMID:21818267; http://dx.doi.org/10.1371/journal.pone.0021817
- Brodlie M, McKean MC, Johnson GE, Gray J, Fisher AJ, Corris PA, Lordan JL, Ward C. Ceramide is increased in the lower airway epithelium of people with advanced cystic fibrosis lung disease. Am J Resp Critical Care Med 2010; 182:369-75; PMID: 20395562; http://dx.doi.org/10.1164/rccm.200905-0799OC
- Furuya H, Shimizu Y, Kawamori T. Sphingolipids in cancer. Cancer Metastasis Rev 2011; 30:567-76; PMID:22005951; http://dx.doi.org/10.1007/s10555-011-9304-1
- Ogretmen B, Hannun YA. Biologically active sphingolipids in cancer pathogenesis and treatment. Nat Rev Cancer 2004; 4:604-16; PMID:15286740; http://dx.doi.org/10.1038/nrc1411
- Olivier S, Fillet M, Malaise M, Piette J, Bours V, Merville MP, Franchimont . Sodium nitroprusside-induced osteoblast apoptosis is mediated by long chain ceramide and is decreased by raloxifene. Biochemical Pharmacol 2005; 69:891-901; PMID: 20395562; http://dx.doi.org/10.1016/j.bcp.2004.11.030
- Boslem E, Meikle PJ, Biden TJ. Roles of ceramide and sphingolipids in pancreatic β-cell function and dysfunction. Islets 2012; 4:177-87; PMID:22847494; http://dx.doi.org/10.4161/isl.20102
- Pattingre S, Bauvy C, Carpentier S, Levade T, Levine B, Codogno P. Role of JNK1-dependent Bcl−2 phosphorylation in ceramide-induced macroautophagy. J Biol Chem 2009; 284:2719-28; PMID:19029119; http://dx.doi.org/10.1074/jbc.M805920200
- Deroyer C, Renert AF, Merville MP, Fillet M. New role for EMD (emerin), a key inner nuclear membrane protein, as an enhancer of autophagosome formation in the C16-ceramide autophagy pathway. Autophagy 2014; 10:1229-40; PMID:24819607; http://dx.doi.org/10.4161/auto.28777
- Li CM, Park JH, Simonaro CM, He X, Gordon RE, Friedman AH, Ehleiter D, Paris F, Manova K, Hepbildikler S, et al. Insertional mutagenesis of the mouse acid ceramidase gene leads to early embryonic lethality in homozygotes and progressive lipid storage disease in heterozygotes. Genomics 2002; 79:218-24; PMID:11829492; http://dx.doi.org/10.1006/geno.2002.6686
- Liu X, Cheng JC, Turner LS, Elojeimy S, Beckham TH, Bielawska A, Keane, TE, Hannun YA, Norris JS. Acid ceramidase upregulation in prostate cancer: role in tumor development and implications for therapy. Expert Opin Therap Target 2009; 13:1449-58; PMID: 19874262; http://dx.doi.org/10.1517/14728220903357512
- Li CM, Park JH, He X, Levy B, Chen F, Arai K, Adler DA, Disteche CM, Koch J, Sandhoff K, et al. The human acid ceramidase gene (ASAH): structure, chromosomal location, mutation analysis, and expression. Genomics 1999; 62:223-31; PMID:10610716; http://dx.doi.org/10.1006/geno.1999.5940
- Mayhew TM. A stereological perspective on placental morphology in normal and complicated pregnancies. J Anatomy 2009; 215:77-90; PMID: 19141109; http://dx.doi.org/10.1111/j.1469-7580.2008.00994.x
- Santana P, Pena LA, Haimovitz-Friedman A, Martin S, Green D, McLoughlin M, Cordon-Cardo C, Schuchman EH, Fuks Z, Kolesnick R. Acid sphingomyelinase-deficient human lymphoblasts and mice are defective in radiation-induced apoptosis. Cell 1996; 86:189-99; PMID:8706124; http://dx.doi.org/10.1016/S0092-8674(00)80091-4
- Jin J, Hou Q, Mullen TD, Zeidan YH, Bielawski J, Kraveka JM, Bielawska A, Obeid LM, Hannun YA, Hsu YT. Ceramide generated by sphingomyelin hydrolysis and the salvage pathway is involved in hypoxia/reoxygenation-induced Bax redistribution to mitochondria in NT-2 cells. J Biol Chem 2008; 283:26509-17; PMID:18676372; http://dx.doi.org/10.1074/jbc.M801597200
- Shirato K, Nakajima K, Korekane H, Takamatsu S, Gao C, Angata T, Ohtsubo K, Taniguchi N. Hypoxic regulation of glycosylation via the N-acetylglucosamine cycle. J Clinical Biochem Nutrition 2011; 48:20-5; PMID: 21297907; http://dx.doi.org/10.3164/jcbn.11-015FR
- Ietta F, Wu Y, Winter J, Xu J, Wang J, Post M, Caniggia I. Dynamic HIF1A regulation during human placental development. Biol Reprod 2006; 75:112-21; PMID:16611863; http://dx.doi.org/10.1095/biolreprod.106.051557
- Romanowicz L, Bankowski E. Lipid compounds of human wharton's jelly and their alterations in preeclampsia. Int J Exp Pathol 2010; 91:1-9; PMID:19878355; http://dx.doi.org/10.1111/j.1365-2613.2009.00675.x
- ACOG PB. Practice bulletin # 33: diagnosis and management of preeclampsia and eclampsia. Obstetric Gynecol 2002; 99:159-67; http://dx.doi.org/10.1016/S0029-7844(01)01747-1
- Bligh EG, Dyer WJ. A rapid method of total lipid extraction and purification. Canadian J Biochem Physiol 1959; 37:911-7; PMID: 13671378; http://dx.doi.org/10.1139/o59-099
- Ray JE, Garcia J, Jurisicova A, Caniggia I. Mtd/Bok takes a swing: proapoptotic Mtd/Bok regulates trophoblast cell proliferation during human placental development and in preeclampsia. Cell Death Differ 2010; 17:846-59; PMID:19942931; http://dx.doi.org/10.1038/cdd.2009.167
- Luo D, Wang J, Li J, Post M. Mouse snail is a target gene for HIF. Mol Cancer Res 2011; 9:234-45; PMID:21257819; http://dx.doi.org/10.1158/1541-7786.MCR-10-0214
- Rutti MF, Richard S, Penno A, von Eckardstein A, Hornemann T. An improved method to determine serine palmitoyltransferase activity. J Lipid Res 2009; 50:1237-44; PMID:19181628; http://dx.doi.org/10.1194/jlr.D900001-JLR200
- Realini N, Solorzano C, Pagliuca C, Pizzirani D, Armirotti A, Luciani R, Costi MP, Bandiera T, Piomelli D. Discovery of highly potent acid ceramidase inhibitors with in vitro tumor chemosensitizing activity. Sci Rep 2013; 3:1-7; PMID: 23301156; http://dx.doi.org/10.1038/srep01035