
Abstract
Cadmium is one of the most toxic metal compounds found in the environment. It is well established that Cd induces hepatotoxicity in humans and multiple animal models. Melatonin, a major secretory product of the pineal gland, has been reported to protect against Cd-induced hepatotoxicity. However, the mechanism behind this protection remains to be elucidated. We exposed HepG2 cells to different concentrations of cadmium chloride (2.5, 5, and 10 μM) for 12 h. We found that Cd induced mitochondrial-derived superoxide anion-dependent autophagic cell death. Specifically, Cd decreased SIRT3 protein expression and activity and promoted the acetylation of SOD2, superoxide dismutase 2, mitochondrial, thus decreasing its activity, a key enzyme involved in mitochondrial ROS production, although Cd did not disrupt the interaction between SIRT3 and SOD2. These effects were ameliorated by overexpression of SIRT3. However, a catalytic mutant of SIRT3 (SIRT3H248Y) lacking deacetylase activity lost the capacity to suppress Cd-induced autophagy. Notably, melatonin treatment enhanced the activity but not the expression of SIRT3, decreased the acetylation of SOD2, inhibited mitochondrial-derived O2•− production and suppressed the autophagy induced by 10 μM Cd. Moreover, 3-(1H-1,2,3-triazol-4-yl)pyridine, a confirmed selective SIRT3 inhibitor, blocked the melatonin-mediated suppression of autophagy by inhibiting SIRT3-SOD2 signaling. Importantly, melatonin suppressed Cd-induced autophagic cell death by enhancing SIRT3 activity in vivo. These results suggest that melatonin exerts a hepatoprotective effect on mitochondrial-derived O2•−-stimulated autophagic cell death that is dependent on the SIRT3/SOD2 pathway.
Abbreviations
| ACTB | = | actin, β |
| Cd | = | cadmium |
| CdCl2 | = | cadmium chloride |
| Baf A1 | = | bafilomycin A1 |
| GPT/ALT | = | glutamic-pyruvate transaminase (alanine aminotransferase) |
| H2O2 | = | hydrogen peroxide |
| LC3 | = | microtubule-associated protein 1 light chain 3 |
| mel | = | melatonin |
| mROS | = | mitochondrial reactive oxygen species |
| O2•− | = | superoxide anion |
| SIRT1 | = | sirtuin 1 |
| SIRT3 | = | sirtuin 3 |
| SOD2 | = | superoxide dismutase 2, mitochondrial |
| SQSTM1/p62 | = | sequestosome 1 |
| tf-LC3 | = | tandem fluorescent mRFP-GFP-LC3B |
| 3-MA | = | 3-methyladenine |
| 3-TYP | = | 3-(1H-1,2,3-triazol-4-yl)pyridine |
Introduction
Cadmium (Cd), a heavy metal, is an environmental and industrial pollutant with high cytotoxicity.Citation1,2 Atmospheric contamination by the cadmium mining industry and cigarette smoke are the main sources of cadmium exposure to humans.Citation3,4 The increasing Cd concentration in the environment is cause for great concern, especially in China.Citation5,6 The liver is an important organ for processing of absorbed nutrients and for detoxification, and it is a main target for Cd.Citation7 Autophagy has been proposed to play a pivotal role in Cd-mediated hepatotoxicity. Previously, we demonstrated that excess autophagy may be the primary contributing factor underlying mitochondrial loss, cellular energy depletion, and cell death in Cd–induced hepatotoxicity.Citation8 These findings highlight the role of autophagy in Cd-induced hepatotoxicity and suggest that the modulation of this process is a viable and novel therapeutic strategy.
The molecular mechanism underlying autophagy has been extensively investigated in recent years. These studies revealed that mitochondrial reactive oxygen species (mROS) generation can induce autophagy. Alterations in mROS and autophagy regulation contribute to many diseases such as cancer, atherosclerosis, and neurological disorders.Citation9 SIRT3 (sirtuin 3) is the primary mitochondrial acetyl-lysine deacetylase that modulates various proteins to control mitochondrial function and mROS generation.Citation10 SIRT3 primarily regulates mROS clearance by altering the acetylation of SOD2 (superoxide dismutase 2, mitochondrial). More importantly, SIRT3 directly binds and deacetylates SOD2, which increases SOD2 activity and leads to a significant effect on mROS homeostasis and autophagic flux.Citation11,12
Melatonin is the major secretory product of the pineal gland. It and its metabolites are best known for their free radical scavenging and antioxidative effects.Citation13-15 Melatonin is a lipophilic molecule that freely crosses cell membranes and enters cells, and it preserves cellular redox balance by maintaining mitochondrial homeostasis.Citation16,17 Recent studies have focused on the role of melatonin in the regulation of autophagy in healthy and disease states. For example, melatonin is reported to attenuate methamphetamine-induced autophagy in SK-N-SH cells, rotenone-induced autophagic cell death in HeLa cells, and morphine-induced autophagy in mouse neurons.Citation18-20 However, the ability of melatonin to protect against Cd-induced autophagic cell death in the human liver remains unknown.
The data presented in the current report indicate that melatonin efficiently protected HepG2 cells against Cd-induced mitochondrial-derived O2•−-dependent autophagic cell death by promoting SIRT3-SOD2 signaling both in vitro and in vivo. These data illustrate a new molecular mechanism of melatonin that may be utilized for future clinical treatments of Cd-induced hepatotoxicity.
Results
Cadmium induces autophagic cell death in cultured HepG2 cells
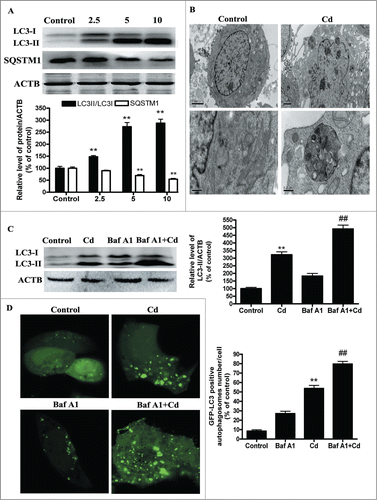
To investigate whether autophagy is involved in the cytotoxicity of Cd, we first examined the processing of full-length LC3-I to LC3-II, a hallmark of autophagy, in Cd-treated HepG2 cells. Cd exposure increased the protein levels of LC3-II in a dose-dependent manner (). Evidence of cadmium-induced autophagy was determined by direct observation of the formation of autophagosomes using electron microscopy (). SQSTM1/p62 serves as a link between LC3 and ubiquitinated substrates and a reduction in the amount of SQSTM1 reflects an increase in autophagic degradation. We also examined the total cellular quantity of SQSTM1 that was delivered to lysosomes for degradation.Citation21 Immunoblot analysis showed that Cd treatment decreased the level of SQSTM1 (), confirming that Cd enhances the autophagic degradation process. Autophagy is a dynamic process of flux. As such, increased levels of autophagosomes can signify either an increase of autophagy, a block in downstream lysosomal processing of these autophagosomes, or both. Bafilomycin A1 (Baf A1), a specific inhibitor of the vacuolar-type H+-ATPase, prevents autophagy at a latest stage by inhibiting the fusion between autophagosomes and lysosomes. To detect autophagic flux, we measured the level of LC3-II and GFP-LC3-positive autophagosomes in the absence or presence of Baf A1. We found that a Baf A1 challenge resulted in increased LC3-II expression and GFP-LC3- positive autophagosomes in the cells treated with 10μM Cd (). Moreover, we transfected HepG2 cells with tandem fluorescent mRFP-GFP-LC3B (tf-LC3), a novel marker that allows assessing of autophagic flux, that is, the complete processing of autophagosomes after fusing with lysosomes, using fluorescence microscopy.Citation22 Cd increased red puncta in the merged image, which indicates formation of autolysosomes (Fig. S1). It is noteworthy that combination treatment of Cd with Baf A1 changed the puncta color to yellow, representing accumulation of autophagosomes resulting from blocked Cd-induced autophagy (Fig. S1). Taken together, these findings demonstrated that Cd treatment induced autophagic flux in HepG2 cells. To further ascertain the role of autophagy in Cd-induced cytotoxicity, 3-MA, an autophagy inhibitor, was employed. As shown in Figures S2A, B and S3A, 3-MA reduced the percentage of autophagy from 250% to 170% and improved cell viability from 56% to 80%. These data indicate that Cd induced autophagic cell death in HepG2 cells. Moreover, ATG5 siRNA treatment also efficiently protected against Cd-induced cell death (Figs. S2C, D and S3B)
Figure 1. For figure legend, see page 1040.
Mitochondrial-derived O2•− mediates cadmium-induced autophagy in HepG2 cells
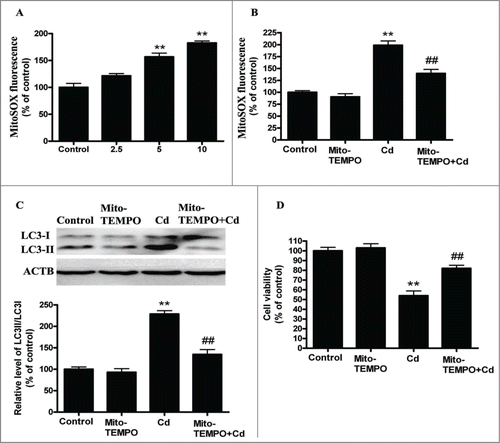
Mitochondrial ROS (mROS) have been implicated in autophagy,Citation23 and the initial oxygen reduction product generated in mitochondria is superoxide (O2•−), which is quickly dismutated to hydrogen peroxide (H2O2).Citation24 Thus, we analyzed the mitochondrial-derived O2•− levels in Cd-exposed cells. MitoSOX-based measurements revealed that mitochondrial-derived O2•− levels were significantly increased by 1.58- and 1.84- fold when compared with control cells, respectively (). Then, HepG2 cells were preincubated with 10 μM Mito-TEMPO for 2 h before the 12-h Cd treatment. The mitochondrial antioxidant Mito-TEMPO (mitochondrial-targeted SOD mimetic)Citation25 enhanced SOD2 activity but not SOD2 levels, suppressed mitochodria-derived O2•− generation, and significantly suppressed the Cd-mediated increase in LC3-II expression ( and Fig. S4). Moreover, the Cd-induced decrease in cell viability was significantly attenuated after treatment with Mito-TEMPO ( and Fig. S3C). Taken together, these results suggest that the oxidative stress induced by Cd triggers autophagy, and antioxidants, such as Mito-TEMPO, can mitigate mitochondrial oxidative stress and reduce this excess autophagy.
Figure 2. Mitochondrial-derived O2•− mediates Cd-induced autophagy in cultured HepG2 cells. (A) Quantification of mitochondrial-derived O2•− levels using a fluorescence spectrometer after HepG2 cells were treated with Cd at different concentrations for 12 h. HepG2 cells were preincubated with Mito-TEMPO (10 μM) for 2 h and then treated with 10 μM Cd, then the mitochondrial-derived O2•− levels (B), LC3 level (C) and cell viability (D) were determined. The results are expressed as a percentage of the control, which is set at 100 %. The values are presented as the means ± SEM, **p < 0.01 versus the control group, ##p < 0.01 vs. the Cd (10 μM) group. (n=6.)
Cadmium exposure inhibits SIRT3 expression and activity and increases SOD2 acetylation
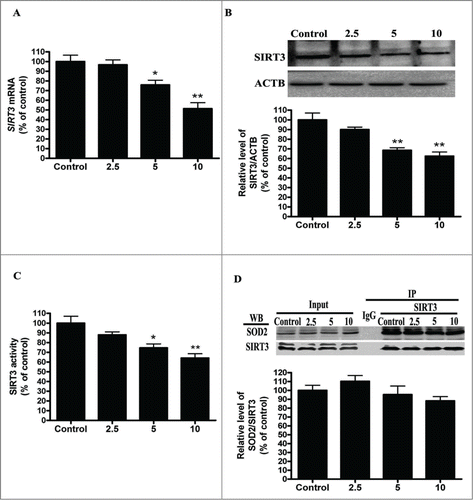
SOD2, the primary mitochondrial oxidative scavenger, plays a crucial role in the regulation of mROS by catalyzing O2•− conversation to H2O2.Citation26 The effects of cadmium-induced mROS production on SOD2 expression were investigated. Interestingly, Cd treatment significantly decreased SOD2 activity in a dose-dependent manner without changing SOD2 expression levels (). SOD2 activity is tightly regulated by acetylation at its lysine residues.Citation27 We measured SOD2 acetylation levels with immunoprecipitation and subsequent western blotting using an anti-acetyl-lysine antibody. Cd significantly increased the acetylation levels of SOD2 2.2-, 3.1-, and 3.6-fold, when compared with controls (). SOD2 is mainly regulated by the deacetylation of specific conserved lysines in a reaction catalyzed by the mitochondrial sirtuin, SIRT3.Citation27-29 We therefore investigated the effect of Cd on SIRT3 expression and activity. Cd treatment resulted in a significant decrease in SIRT3 mRNA and protein levels (). Our experimental data also showed that SIRT3 activity was reduced in the Cd group when compared with the control (). SIRT3 and SOD2 functionally and physically interact with each other to form a stable complex that regulates the activity and acetylation of SOD2.Citation28 The results of the co-immunoprecipitation (Co-IP) affinity isolation assay indicate that Cd treatment does not increase or disrupt the interaction of SIRT3 and SOD2 ().
Figure 3. Cd exposure increases acetylated-SOD2 expression in HepG2 cells in a dose-dependent manner. (A) Representative immunoblot of SOD2 protein levels in HepG2 cells. (B) SOD2 activity in HepG2 cells (C) Acetylation of SOD2 after Cd exposure was determined by immunoprecipitation with an anti-SOD2 antibody, followed by immunoblot analysis of acetylated-lysine. The results are expressed as a percentage of the control, which is set at 100 %. The values are presented as the means ± SEM, **p < 0.01 versus the control group. (n = 4.)
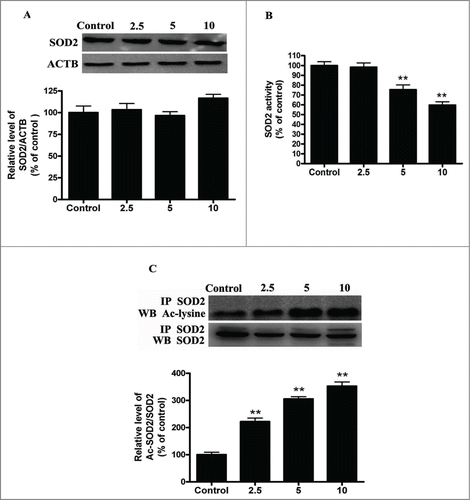
Figure 4. Cd exposure decreases SIRT3 protein expression and activity in a dose-dependent manner. (A) Quantitative real-time PCR analysis was applied to detect SIRT3 mRNA levels. (B) Representative immunoblot of SIRT3 protein levels in HepG2 cells. (C) SIRT3 activity was measured based on an enzymatic reaction using a SIRT3 assay kit. (D) Cell lysates were mixed with various concentrations Cd for 12 h. Antibodies against SIRT3 were added to immunoprecipitate the SIRT3-containing complexes, and then immunoblotted for SOD2 or SIRT3. The results are expressed as a percentage of the control, which is set at 100 %. The values are presented as the means ± SEM, *p < 0.05, **p < 0.01 vs. the control group. (n = 4.)
SIRT3-SOD2 modulates cadmium-induced mitochondrial-derived O2•− accumulation and autophagy in cultured HepG2 cells
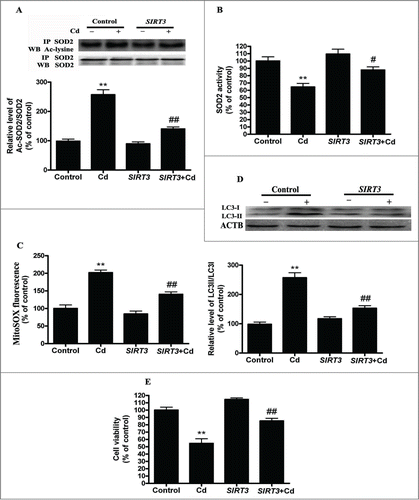
To assess if the restoration of SIRT3 levels or activity is sufficient to inhibit Cd-induced autophagy, we overexpressed SIRT3 in HepG2 cells using a transient transfection method. We found that overexpression of SIRT3 attenuated the Cd-induced suppression of SIRT3 protein expression and activity (Fig. S5A and B). Furthermore, overexpression of SIRT3 decreased the expression of acetylated-SOD2, increased SOD2 activity (), and efficiently depressed mitochondrial-derived O2•− production in HepG2 cells exposed to 10 μM Cd (). SIRT3-overexpressing cells also exhibited a marked reduction in LC3 expression and an elevation in cell viability ( and Fig. S3D).
Figure 5. SIRT3-SOD2 modulates Cd-induced mitochondrial-derived O2•− accumulation and autophagy in cultured HepG2 cells. (A) SIRT3 overexpression induced deacetylation of SOD2 after 10 μM Cd treatment. (B) SOD2 activity in HepG2 cells. (C) Mitochondrial-derived O2•− production in HepG2 cells. (D) Representative immunoblot of LC3 protein levels in HepG2 cells. (E) Cell viability. The results are expressed as a percentage of the control, which is set at 100 %. The values are presented as the means ± SEM, **p < 0.01 versus control group, #p < 0.05, ##p < 0.01 vs. the Cd (10 μM) group. (n = 6.)
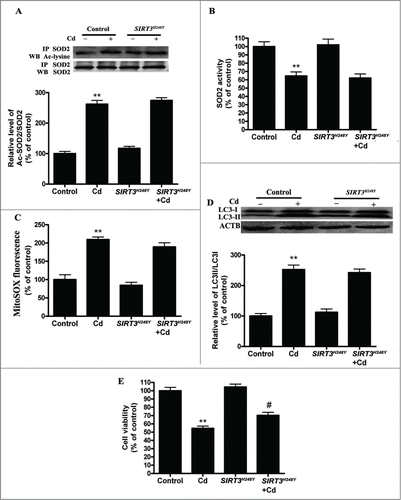
SIRT3 deacetylase deficiency does not affect mitochondrial-derived O2•− accumulation and autophagy in cadmium-treated HepG2 cells
To test if deacetylase activity is required for SIRT3 action in autophagic metabolism, we generated a catalytic mutant of SIRT3 (SIRT3H248Y) lacking deacetylase activity. We found that the overexpression of SIRT3H248Y attenuated the Cd-induced decrease in SIRT3 protein expression but not SIRT3 activity (Fig. S5A and B).The acetylation of SOD2 and SOD2 activity was unchanged in SIRT3H248Y-overexpressing HepG2 cells (). Moreover, the overexpression of SIRT3H248Y in HepG2 cells did not block Cd-induced mitochondrial-derived O2•− production (). SIRT3H248Y did not attenuate Cd-induced autophagy, but it did restore cell viability when compared with wild-type SIRT3 ( and Fig. S3D).
Figure 6. SIRT3 deacetylase deficiency does not affect mitochondrial-derived O2•− accumulation and autophagy in Cd-treated HepG2 cells. (A) SIRT3H248Y overexpression did not induce deacetylation of SOD2 after 10 μM Cd treatment. (B) SOD2 activity in HepG2 cells. (C) Mitochondrial-derived O2•− production. (D) Representative immunoblot of LC3 protein levels in HepG2 cells. (E) Cell viability. The results are expressed as a percentage of the control, which is set at 100%. The values are presented as the means ± SEM, **p < 0.01 versus control group, #p < 0.05 vs. the Cd (10 μM) group. (n = 6.)
Melatonin protects against cadmium-induced autophagic cell death
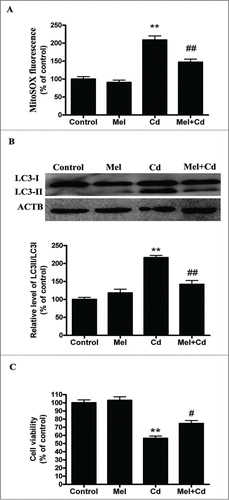
Melatonin is a mitochondrial antioxidant that aids in the elimination of mROS.Citation30 We tested whether melatonin protects mitochondria against Cd-induced oxidative stress and autophagy. We found that melatonin blocked mitochondrial-derived O2•− elevation induced by Cd in HepG2 cells (). Concordantly, melatonin restored the levels of LC3-II and cell viability in Cd-treated HepG2 cells to that of untreated controls ( and Fig. S3E).
Figure 7. Melatonin suppresses Cd-induced autophagic cell death. (A) Mitochondrial-derived O2•− production. (B) A representative immunoblot and quantification analysis of LC3. (C) Cell viability. The results are expressed as a percentage of the control, which is set at 100 %. The values are presented as the means ± SEM, **p < 0.01 vs. the control group, and #p < 0.05, ##p < 0.01 vs. the Cd (10 μM) group. (n = 6.)
Melatonin suppresses cadmium-induced autophagy through a SIRT3-SOD2-dependent mechanism
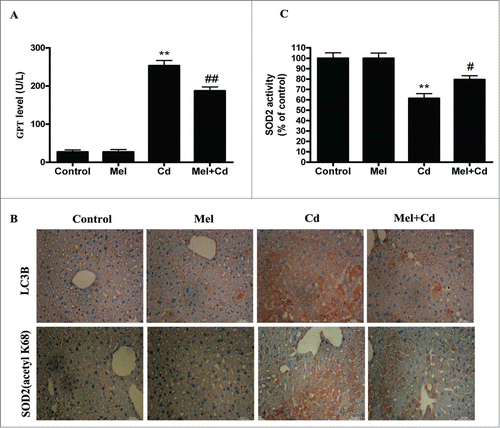
SIRT3 is involved in the inhibition of Cd-induced autophagy and hepatotoxicity; thus, the relationship between SIRT3 and melatonin in liver cells was investigated. Interestingly, melatonin restored the Cd-mediated reduction in SIRT3 activity without significantly affecting SIRT3 protein levels (). As expected, melatonin significantly blocked the Cd-induced expression of acetylated-SOD2 and restored SOD2 activity (). We used SIRT3 inhibitor (3-TYP) to confirm that melatonin was involved in Cd-induced autophagy and the disruption of SIRT3-regulated mitochondrial-derived O2•− production. 3-TYP is a selective SIRT3 inhibitor.Citation31 Exposure to 3-TYP inhibited melatonin-enhanced SIRT3 activity but did not affect SIRT3 protein expression (Fig. S6A and B). Moreover, 3-TYP pretreatment reversed the protective effects of melatonin on Cd-induced mitochondrial-derived O2•− production and autophagic cell death ( and Fig. S3F). As shown in , melatonin-induced increases in deacetylated-SOD2 expression and SOD2 activity were significantly attenuated by 3-TYP in HepG2 cells exposed to Cd. To determine whether melatonin suppressed Cd-induced autophagy through a SIRT3-SOD2-dependent pathway in vivo, we examined the effects of melatonin in a mouse model. The effects of melatonin on Cd-induced liver damage are presented in . Melatonin successfully reduced GPT/ALT, glutamic-pyruvate transaminase (alanine aminotransferase) levels in the Cd-treated mice. Moreover, melatonin restored the Cd-mediated reduction in SIRT3 activity without significantly affecting SIRT3 protein levels in mice (Fig. S7). Next, the level of SOD2 (acetyl K68), a downstream target of the SIRT3 pathway, was also measured. Melatonin significantly attenuated Cd-induced upregulation of acetylated-SOD2, restored the SOD2 activity and suppressed autophagy (). These data suggest a SIRT3-dependent effect of melatonin on acetylated-SOD2 expression in hepatic cells exposed to cadmium both in vitro and in vivo.
Figure 8. Melatonin increases SIRT3 activity but not expression, and it inhibits acetylated-SOD2 expression after Cd treatment in vitro. Melatonin enhances SIRT3 activity (A) but not the expression of SIRT3 (B) at 12 h after exposure to 10 μM Cd. Melatonin induced deacetylation of SOD2 (C) and increased SOD2 activity (D) after Cd treatment. The results are expressed as a percentage of the control, which is set at 100 %. The values are presented as the means ± SEM, **p < 0.01 versus the control group, and #p < 0.05 vs. the Cd (10 μM) group. (n = 4.)
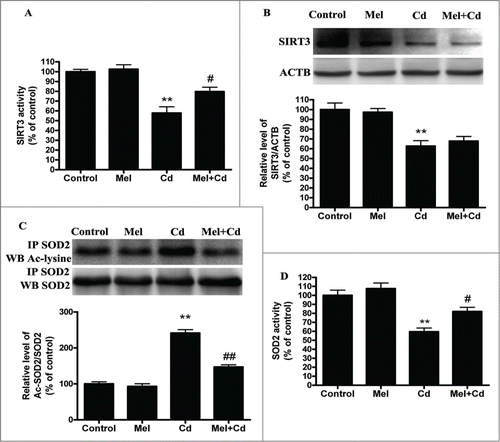
Figure 9. 3-TYP pretreatment abolishes the melatonin-suppressed autophagy in Cd-injured HepG2 cells. The effects of melatonin and 3-TYP pretreatment on mitochondrial-derived O2•− production (A), (B) A representative immunoblot and quantification analysis of LC3, (C) cell viability, (D) acetylated-SOD2 expression and (E) SOD2 activity. The results are expressed as a percentage of the Cd group, which is set at 100%. The values are presented as the means ± SEM, *p < 0.05, **p < 0.01 versus the Cd (10 μM) group, and #p < 0.05, ##p < 0.01 vs. the Mel + Cd group. (n = 6.)
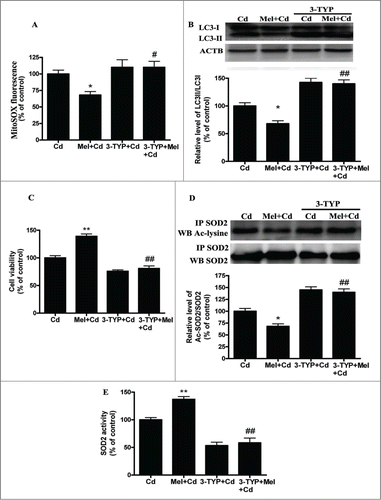
Figure 10. Melatonin suppresses Cd-induced autophagic cell death by enhancing SIRT3 activity in vivo. (A) Serum GPT activity was measured. (B) Immunohistochemical analysis of LC3B and SOD2 (acetyl K68) expression in liver tissue. (C) SOD2 activity in liver tissue. The results are expressed as a percentage of the control group, which is set at 100 %. The values are presented as the means ± SEM, **p < 0.01 versus the Cd group, and #p < 0.05, ##p < 0.01 vs. the Mel + Cd group. (n = 8.)
Discussion
Cd is one of the most toxic metal compounds found in the environment, and it is an important environmental pollutant that can be distributed through the food chain.Citation32 Melatonin has remarkable antioxidant properties and is a strong candidate for the treatment of Cd–induced hepatotoxicity; Citation33-38 however, the precise mechanism behind these effects is unclear. The current study is the first to show that melatonin is a feasible treatment option for Cd-induced autophagic cell death. We demonstrated that Cd augmented cellular autophagy, which is dependent on mROS generation in liver cells. We also showed that a reduction in SIRT3 reduced the deacetylation of SOD2, resulting in a loss in SOD2 activity and an elevation in the mROS responsible for Cd–induced autophagy. In addition, our data show that SIRT3 deacetylase activity, rather than SIRT3 expression, may contribute to SOD2 activity in Cd–induced autophagy. Moreover, we determined that melatonin antagonizes Cd-induced autophagic cell death by regulating SIRT3 activity but not influencing its protein expression.
Autophagy may aid in cell survival by removing cells damaged by toxic metabolites and intracellular pathogens. However, autophagy may also promote cell death through excessive self-digestion and degradation of essential cellular constituents.Citation39 In our previous study, we showed that Cd exposure induced a significant degree of autophagy, which led to cell death and hepatotoxicity in L02 cells.Citation8 Here, we show that Cd-induced increases in the number of GFP-LC3 puncta resulted from an elevation in autophagic flux rather than an inhibition of autophagosome degradation in HepG2 cells. In addition, Cd treatment decreased the viability of HepG2 cells, and 3-MA or ATG5 silencing significantly inhibited this decrease in cell viability. These results provide further evidence that autophagy contributes predominantly to Cd-mediated cytotoxicity in the liver.
Increased generation of mROS is an important stimulus of autophagy in several diseases.Citation40-44 Autophagic degradation and removal of damaged oxidized proteins in response to mitochondrial oxidative stress is reportedly beneficial for the cell. Conversely, severe oxidative stress and increasing amounts of mROS may activate signaling pathways that lead to autophagic cell death.Citation23 Here, we observed that a 12-h Cd exposure promoted mitochondrial-derived O2•− levels 2-fold when compared with the control. Treatment with the mitochondrial-targeted SOD mimetic, Mito-TEMPO, mitigated oxidative stress and reduced autophagic cell death, suggesting that mitochondrial-derived O2•− accumulation is an important mechanism behind the sensitization of cells to autophagy. Thus, maintaining mitochondrial-derived O2•− at tolerable levels may be a viable strategy to treat Cd-induced autophagic cell death. However, a therapeutic window for mitochondrial-derived O2•− suppression in this model requires clarification in future studies. H2O2 also is an important member of the mROS family. The production of O2•− and H2O2 is a chain reaction, where O2•− is converted to H2O2 by SOD.Citation45 Interestingly, Cd dose-dependently inhibited the generation of H2O2 in HepG2 cells (Fig. S8). Autophagy is involved in human diseases and is regulated by ROS including O2•− and H2O2. Our result may confirm that Cd-induced autophagy specifically mediated by O2•−, but not H2O2.Citation46,47
While mitochondrial oxidative stress is involved in autophagy, the molecular mechanisms by which mitochondrial-derived O2•− accumulate remain unknown. Mitochondrial-derived O2•− levels are carefully regulated in the cell, and the mitochondria contain specific processes to scavenge and remove mitochondrial-derived O2•− to maintain homeostasis. Mitochondria consume over 90% of intracellular oxygen and produce a large flux of mitochondrial-derived O2•−; thus, SOD2 activity is crucial for maintaining mitochondrial-derived O2•− balance.Citation28,48 In the present study, we found that SOD2 activity was significantly reduced in Cd-induced hepatotoxicity. SOD2 is regarded as a scavenging enzyme, and its activity is thought to be dependent on its mitochondrial levels.Citation49,50 However, the expression of SOD2 protein was unaffected by Cd treatment. Moreover, regulation of the activity of SOD2 has been mainly reported at the transcriptional level, and the activity of SOD2 is inversely proportional to its acetylation.Citation27,28,48 Consistent with previous studies, we observed that Cd increased acetylated-SOD2 levels in a dose-dependent manner. We also found that SOD2 activity was significantly reduced. These data suggest that Cd increased mitochondrial-derived O2•− through the up-regulation of acetylated SOD2 without affecting SOD2 protein levels.
Lysine acetylation has recently emerged as an important posttranslational modification employed to regulate mitochondrial proteins and autophagy.Citation51-53 Recently, 3 mitochondrial deacetylation enzymes have been identified, including SIRT3, SIRT4, and SIRT5.Citation54 SIRT3 is the most robust mitochondrial deacetylase, and it directs biological functions involved in mitochondrial energy production and limits the accumulation of mitochondrial-derived O2•−.Citation55 Deacetylation of SOD2 by SIRT3 regulates SOD2 enzymatic activity, and target lysines have been identified. SIRT3 deacetylates SOD2 in response to ionizing radiation, indicating that SOD2 is a major downstream signal of SIRT3-mediated mitochondrial-derived O2•− reduction.Citation27 Herein, we found that although Cd decreased SIRT3 protein expression and activity, it did not disrupt the interaction between SIRT3 and SOD2, providing new evidence for a likely mechanism by which acetylation modifies the transcription activity of SOD2 in Cd-induced hepatotoxicity. In addition, SIRT3 overexpression maintained mitochondrial-derived O2•− homeostasis and reversed Cd-induced autophagy by deacetylating SOD2 and regulating the antioxidant activity of SOD2. These findings suggest that SIRT3-SOD2-mediated autophagy is an essential mechanism underlying Cd-induced hepatotoxicity. Mechanistically, how Cd decreases SIRT3 levels and activities is unclear, we consider 2 distinct alternatives. First, we found that Cd-mediated decreases in SIRT3 mRNA levels may contribute to the changes of SIRT3 levels or activity. Second, another new finding shows us that the sequential actions of nuclear SIRT1 (Sirtuin 1) and mitochondrial SIRT3 link nuclear and mitochondrial functions.Citation56,57 Our previous studies showed SIRT1 progressively decreased in Cd-injured HepG2 cells.Citation38 Notably, SIRT1 overexpression increased SIRT3 activity without altering its expression levels in Cd-treated HepG2 cells, which confirmed that communication between SIRT1 (nuclear) and SIRT3 (mitochondrial) may influence Cd-induced hepatotoxicity (Fig. S9). However, it is noteworthy that the activity of SIRT3 can be controlled by the availability of its substrates, post-translational modifications, interactions with other proteins, or changes in its expression levels.Citation58 Further study is needed to identify other mechanisms of Cd-mediated effects on the SIRT3 pathway.
Although SIRT3H248Y overexpression increased SIRT3 protein levels when compared with wild-type SIRT3, SIRT3H248Y was unable to reverse the Cd-induced increase in mitochondrial-derived O2•− and autophagy. These data indicate that SIRT3 activates SOD2 through its deacetylase activity to suppress autophagy. Interestingly, SIRT3H248Y displayed a certain protective effect in cell death against Cd in HepG2 cells without deacetylase activity. This beneficial role may be explained by a compensation of SIRT3H248Y overexpression by increased expression of other sirtuins, which leads to a reduction in cell death mechanisms other than autophagy, such as apoptosis, pyroptosis, or necrosis.Citation59 This hypothesis and the details of these mechanisms need further research.
Cd-induced hepatotoxicity may be the consequence of autophagy, and the antioxidant activity of melatonin was shown to reduce autophagy. Therefore, we tested if melatonin reversed the deleterious effects of Cd by inhibiting autophagy. We found that melatonin attenuated the Cd-induced rise in mitochondrial-derived O2•− in cultured cells. Most importantly, melatonin ameliorated the Cd-induced decrease in SIRT3 activity but did not affect its protein levels. Thus, melatonin restored autophagy levels in cultured cells exposed to Cd. Although melatonin and its metabolites modulate the expression of genes involved in detoxification or generation of mitochondrial-derived O2•−, melatonin may not change SIRT3 gene expression. Rather, melatonin may only upregulate SIRT3 activity.Citation60 To identify if the SIRT3-SOD2 pathway mediated the observed protective effects of melatonin, HepG2 cells were pretreated with 3-TYP, followed by melatonin treatment and Cd exposure for 12 h. This study documented that blocking SIRT3 activity with 3-TYP blocked the effects of melatonin on Cd-induced autophagy. Moreover, 3-TYP remarkably reversed the effects of melatonin on acetylated-SOD2 expression and SOD2 activity. Importantly, mice lacking SIRT3, a mitochondrial deacetylase, have increased acetylation and inhibition of many mitochondrial enzymes and complexes, suppressing mitochondrial function.Citation61 In our study, melatonin suppressed Cd-induced autophagic cell death in the livers of mice by enhanced SIRT3 activity. These data are consistent with melatonin suppressing mitochondrial-derived O2•− production and restoring autophagy levels through the upregulation of the SIRT3-SOD2 pathway both in vitro and in vivo.
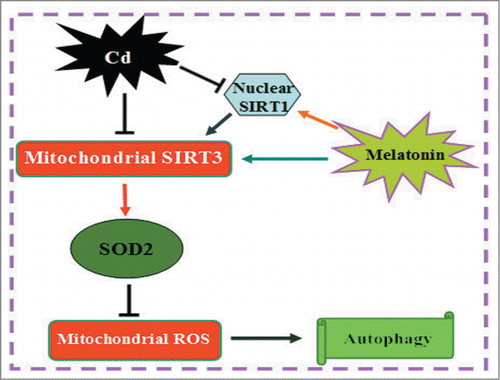
In summary, we propose an intriguing mechanism whereby Cd induces hepatotoxicity via mitochondrial-derived O2•− -dependent-autophagy. Importantly, melatonin shows a compensatory and protective role in eliminating mitochondrial-derived O2•− and suppressing autophagy through the SIRT3-SOD2 pathway both in vitro and in vivo. Taken together, these findings provide new insights into the link between melatonin and autophagy signaling, which could contribute to a better understanding of a melatonin-mediated protective effect in Cd-induced hepatotoxicity ().
Figure 11. Melatonin inhibits autophagic cell death by promoting SIRT3-SOD2-mROS pathway in cadmium-induced hepatotoxicity.
Materials and Methods
Cell culture
The human hepatocellular carcinoma cell line, HepG2, was purchased from the Cell Bank of the Institute of Biochemistry and Cell Biology (Shanghai, China). The HepG2 cells were cultured in DMEM medium (HyClone, SH30022.01B) that was supplemented with 10% heat-inactivated FBS (HyClone, SV30087.02) and 1% (v/v) penicillin/ streptomycin (Sigma, P4333). Cells were grown in a 5% CO2 humidified atmosphere at 37°C.
Cell experimental protocol
The effects of Cd on autophagy in HepG2 cells were evaluated. At 80% confluence, the cells were treated with cadmium chloride (CdCl2; Sigma, 439800) at different concentrations (0, 2.5, 5, 10 μM) for 12 h.
Next, we investigated the ability of melatonin to alleviate Cd-induced hepatotoxicity. HepG2 cells were pretreated with 1 μM melatonin for 2 h prior to 10 μM Cd treatment. Melatonin (Sigma, M5250) was freshly dissolved in ethanol to produce a 10 mM stock solution that was kept at 4°C until use. The stock solution was further diluted in culture medium before being added to the cells. The final ethanol concentration did not exceed 0.1% for cell culture experiments. The vehicle control used for each in vitro assay was 0.1% ethanol.
Finally, the role of the SIRT3-SOD2 pathway in hepatic cell protection after melatonin pretreatment was investigated. Cells were randomly divided into the following treatment groups: 10 μM Cd; melatonin (1μM) + 10 μM Cd; 3-TYP (50 μM) + 10 μM Cd; and 3-TYP (50 μM) + melatonin (1 μM) +10 μM Cd. 3-TYP (50 μM) had no significant effect on cell viability when compared with the control group (data not shown). 3-(1H-1,2,3-triazol-4-yl)pyridine (3-TYP, CAS: 120241-79-4) was synthesized and characterized by the IDRC innovative drug research center at Chongqing University (Fig. S10–S13) as previously described.Citation31
Animal studies
Thirty-three 2-mo-old C57BL/6 mice were maintained on a 12:12 h light-dark phase and fed ad libitum. They were adapted for 2 wk to the above conditions before experiments. All mice except controls were injected intraperitoneally with Cd (2 mg/kg) for 7 d. Some mice were intraperitoneally injected with melatonin (5 mg/kg) at 2 h before Cd treatment. The control mice received an equal volume of normal saline or equal doses of melatonin.Citation62 All animal experiments were approved by the Third Military Medical University for Accreditation of Laboratory Animal Care.
Electron microscopy
We used electron microscopy to morphologically observe the induction of autophagy in Cd-treated HepG2 cells.Citation8 After being treated with Cd (10 μM) for 12 h, cells were washed twice with phosphate-buffered saline (ZSGB-BIO, ZLI-9061) and fixed with ice-cold glutaraldehyde for 30 min at 4°C. Cells were post fixed in 1% osmium tetroxide for 30 min at 4°C and embedded in LX 122 before being cut and stained with uranyl acetate/lead citrate. Next, the cells were observed using a Hitachi-7500 electron microscope (Hitachi Instrument, Tokyo, Japan).
Determination of autophagic cells
To assess autophagy, the cells that overexpressed GFP-LC3 (Cell Biolabs, CBA-401) were examined at 63× magnification, and autophagic cells were classified as those with diffuse GFP-LC3 fluorescence or as cells with >20 GFP-LC3 puncta/cell.Citation63 The cells were treated with either control vehicle or 10 μM Cd for 12 h, and then imaged using a Zeiss confocal laser scanning microscope (Carl Zeiss, LSM 780 Confocal Laser Scanning Microscope).
Evaluation of fluorescent LC3 puncta
HepG2 cells were transfected with tandem fluorescent mRFP-GFP-LC3B (tf-LC3) (Invitrogen, P36239) in a 35-mm cell culture dish, according to the manufacturer's instructions. Twenty-four h after virus transduction, the cells were treated with either control vehicle or 10 μM Cd for 12 h, and then imaged using a Zeiss confocal laser scanning microscope. The number of GFP and RFP dots was determined by manual counting of fluorescent puncta with a 63× objective. At least 50 cells were counted for each experiment.Citation64,65
RNA interference of ATG5
The HepG2 cells (1 × 10Citation6) were transfected with either 100 nmol/L ATG5-targeting small siRNA (Santa Cruz Biotechnology, sc41445) or a control nonspecific siRNA (Santa Cruz Biotechnology, sc37007). 24 h following transfection, the cells were exposed to 10 μM Cd for 12 h. The cells were then collected and processed for immunoblotting of LC3B and cell death analyzed.
Cell viability and death assay
Cell viability was analyzed using Cell Counting Kit-8 according to the manufacturer's instructions (Dojindo Molecular Technologies, CK04). Briefly, 1 × 10Citation4 cells were inoculated into 96-well plates. After being treated, 90 μl of medium and 10 μl of CCK-8 solution were added to each well. The cells were then incubated at 37°C for 2 h. After incubation, the absorption at 450 nm was measured using an Infinite™ M200 Microplate Reader (Tecan, Mannedorf, Switzerland). The results are expressed as a percentage of the control. The cell death was also evaluated using the trypan blue assay (Beyotime, C0011).Citation41 HepG2 cells were plated in the 6-well plates (5×10Citation5 cells per well) and incubated for 24 h. After being treated with Cd or melatonin, the cells were detached with 300 μl trypsin-EDTA solution (Beyotime, C0011-2). The mixture of detached cells was centrifugated at 300 g for 5 min. Then, the residue was combined with 800 μl trypan blue solution and dispersed. After 3 min staining, cells were counted using an automated cell counter (TC10, Bio-Rad). The dead cells were stained with the blue color. Cell mortality (%) is expressed as percentage of the dead cell number/the total cell number.
Determination of mitochondria-derived O2•−and H2O2
To assess mitochondrial-derived O2•−, HepG2 cells were incubated with culture medium containing 10 μM MitoSOX (Invitrogen, M36008) for 20 min at 37°C. The fluorescence intensity was analyzed with an Infinite™ M200 Microplate Reader at an excitation wavelength of 492 nm and an emission wave length of 595 nm.Citation66 Cellular fluorescence intensity is expressed as the fold change relative to the control. Production of H2O2 was measured using the hydrogen peroxide assay kit (Beyotime Company, S0038).Citation67 The lysis buffer solution supplied in the kit was added at a ratio of 100 μl per 10Citation6 cells. Then the supernatant fractions were gathered by centrifuging at 12 000 g for 5 min for the following tests. All operations were carried out on ice. Then, the test-tubes containing 50 µl of the supernatant fractions and 100 µl of test solutions were placed at room temperature for 20 min, and the absorbance at 560 nm was instantly measured using an Infinite™ M200 Microplate Reader. The level of H2O2 was calculated according to a standard concentration curve originating from standard solutions using an identical protocol.
Measurement of SOD2 enzyme activity
SOD2 enzymatic activity was assayed using a SOD1 and SOD2 Assay Kit with WST-8 (Beyotime Company, S0103) following the manufacturer's instructions. One unit of SOD was defined as the amount of enzyme that inhibits the rate of NBT reduction observed in a blank sample by 50%. The SOD isoforms were identified by adding SOD1 inhibitor A and B to inhibit SOD1 activity (i.e., to detect SOD2). The absorption at 450 nm was measured using an Infinite™ M200 Microplate Reader.
Plasmids and transfection
Three plasmids, pEGFP-N1-SIRT3, pEGFP-N1-SIRT3H248Y and pEGFP-N1-SIRT1, were designed by the Invitrogen Corporation, as described previously.Citation68 HepG2 cells grown in antibiotic-free DMEM on culture dishes for 24 h were transfected with SIRT3, SIRT3H248Y, and control plasmids using Opti-MEM® I reduced serum media and Lipofectamine 2000 according to the manufacturer's instructions (Invitrogen, 11668-019). Twenty-four h after transfection, cells were washed and processed for immunoblotting and other studies as described.
Real-time PCR analysis to detect SIRT3 mRNA
All reagents used for real-time PCR were obtained from Life Technologies. The SIRT3 probes were (5′- GACATTCGGGCTGACGTGAT-3′) and (5′- ACCACATGCAGCAAGAACC TC-3′); the GAPDH probes were (5′-TGACAACAGCCTCAAGAT-3′) and (5′-GAGTCCTTCCACGATACC-3′). The mean fold change is shown as the natural logarithm of RQ values and the error is estimated by evaluating the 2−△△Ct equation using △△Ct plus standard deviation and △△Ct minus the standard deviation.
SIRT3 activity
SIRT3 enzymatic activity was assayed using a fluorometric kit (Enzo Life Sciences Inc., BML-AK557-0001) following the manufacturer's instructions with modifications as described.Citation69 Protein (40 μg) was incubated at 37°C for 45 min with specific substrates. Next, 25 μl of developer was added and, samples were incubated for an additional 45 min. SIRT3 activity was then measured using an Infinite™ M200 Microplate Reader at 350 nm/450 nm.
Immunoprecipitation
HepG2 cells were treated with Cd and lysed with cell lysis buffer (Beyotime Company, P0013). Lysates were clarified by centrifugation at 12,000 g for 15 min and were used for immunoprecipitation. A total of 2 μg of antibody was incubated with 500–1000 μg of protein overnight at 4°C. Next, protein A beads (Beyotime Company, P2006) were added and the mixture was incubated overnight at 4°C. After incubation, the beads were washed 3 times, solubilized in 40 μl 3xSDS sample buffer (Cell Signaling Technology, 7722), and analyzed by western blotting.
Western blot analysis
The HepG2 cell and the liver tissue lysates were centrifuged for 15 min at 12,000 g, and the resulting supernatant fraction was transferred to a new tube. The protein concentrations were determined using a Bradford protein assay kit (Beyotime Company, P0006). The protein samples were separated by SDS-PAGE. Following protein transfer to PVDF membranes, the membranes were blocked and then incubated overnight at 4°C with antibodies against LC3(1:1000; Sigma, L7543), SQSTM1/p62 (1:1000; Abcam, ab56416), SIRT3 (1:100; Santa Cruz Biotechnology, sc-99143), SOD2 (1:100; Santa Cruz Biotechnology, sc-33254), and ACTB (1:5000; Sigma, A5441) The membrane was visualized by enhanced chemiluminescence using Super Signal West Pico blotting (Pierce, 34079) detection reagents and exposure to Hyper Performance Chemiluminescence film.
Immunohistochemical analyses
Fixed mice livers were embedded in paraffin and were sectioned at a thickness of 3 μm, and immunohistochemical staining was performed with LC3B (1:50; Abacam, ab168831) and SOD2 (acetyl K68) (1:100; Abacam, ab137037) antibody. The sections were mounted in a mounting medium containing glycerol (Beyotime, P0126) and visualized with a light microscope (Leica, DM6000M).
Serum enzyme activity assays
Biochemical evaluation of liver injury was performed by quantifying serum activities of GPT using GPT/ALT test kits (Uscn, SEA207Mu) according to the manufacturer's instructions.
Statistical analysis
Data were analyzed using GraphPad Prism-5 software. All of the experimental data are expressed as the mean ± SEM, and each experiment was performed a minimum of 3 times. One-way ANOVA was used to determine statistical significance, and P < 0.05 was considered to be statistically significant.
Disclosure of Potential Conflicts of Interest
No potential conflicts of interest were disclosed.
Supplemental Material
Supplemental data for this article can be accessed on the publisher's website.
1052208_supplemental_figures.doc
Download MS Word (8 MB)Acknowledgments
We are grateful to Dr Panlin Shao and Dr Gongming Shi in Chongqing University for their professional assistance in the synthesis and characterization of 3-(1H-1,2,3-triazol-4-yl)pyridine.
Funding
This work was supported by the National Natural Science Foundation of China (no. 81422039), and the grant for Outstanding Young Scientist was from Chongqing Science and Technology Commission (CSTC2013JCYJJQ10002).
Related Research Data
References
- Waalkes MP. Cadmium carcinogenesis. Mutat Res 2003; 533:107-20; PMID:14643415; http://dx.doi.org/10.1016/j.mrfmmm.2003.07.011
- Satarug S, Baker JR, Urbenjapol S, Haswell-Elkins M, Reilly PE, Williams DJ, Moore MR. A global perspective on cadmium pollution and toxicity in non-occupationally exposed population. Toxicol Lett 2003; 137:65-83; PMID:12505433; http://dx.doi.org/10.1016/S0378-4274(02)00381-8
- Perlman GD, Berman L, Leann K, Bing L. Agency for toxic substances and disease registry brownfields/ land-reuse site tool. J Environ Health 2012; 75:30-4; PMID:23270111
- Huang J, Okuka M, McLean M, Keefe DL, Liu L. Telomere susceptibility to cigarette smoke-induced oxidative damage and chromosomal instability of mouse embryos in vitro. Free Radic Biol Med 2010; 48:1663-76; PMID:20381605; http://dx.doi.org/10.1016/j.freeradbiomed.2010.03.026
- Larson C. ENVIRONMENTAL SCIENCE China gets serious about its pollutant-laden soil. Science 2014; 343:1415-6; PMID:24675928; http://dx.doi.org/10.1126/science.343.6178.1415
- Jin L, Liu J, Ye B, Ren A. Concentrations of selected heavy metals in maternal blood and associated factors in rural areas in Shanxi Province, China. Environ Int 2014; 66:157-64; PMID:24584080; http://dx.doi.org/10.1016/j.envint.2014.01.016
- Xu S, Pi H, Chen Y, Zhang N, Guo P, Lu Y, He M, Xie J, Zhong M, Zhang Y, et al. Cadmium induced Drp1-dependent mitochondrial fragmentation by disturbing calcium homeostasis in its hepatotoxicity. Cell Death Dis 2013; 4:e540; PMID:23492771; http://dx.doi.org/10.1038/cddis.2013.7
- Pi H, Xu S, Zhang L, Guo P, Li Y, Xie J, Tian L, He M, Lu Y, Li M, et al. Dynamin 1-like-dependent mitochondrial fission initiates overactive mitophagy in the hepatotoxicity of cadmium. Autophagy 2013; 9:1780-800; PMID:24121705; http://dx.doi.org/10.4161/auto.25665
- Essick EE, Sam F. Oxidative stress and autophagy in cardiac disease, neurological disorders, aging and cancer. Oxid Med Cell Longev 2010; 3:168-77; PMID:20716941; http://dx.doi.org/10.4161/oxim.3.3.12106
- Bause AS, Haigis MC. SIRT3 regulation of mitochondrial oxidative stress. Exp Gerontol 2013; 48:634-9; PMID:22964489; http://dx.doi.org/10.1016/j.exger.2012.08.007
- Qiu XL, Brown K, Hirschey MD, Verdin E, Chen D. Calorie Restriction Reduces Oxidative Stress by SIRT3-Mediated SOD2 Activation. Cell Metab 2010; 12:662-7; PMID:21109198; http://dx.doi.org/10.1016/j.cmet.2010.11.015
- Liang QL, Benavides GA, Vassilopoulos A, Gius D, Darley-Usmar V, Zhang JH. Bioenergetic and autophagic control by Sirt3 in response to nutrient deprivation in mouse embryonic fibroblasts. Biochem J 2013; 454:249-57; PMID:23767918; http://dx.doi.org/10.1042/BJ20130414
- Suzen S. Melatonin and Synthetic Analogs as Antioxidants. Curr Drug Deliv 2013; 10:71-5; PMID:22998047; http://dx.doi.org/10.2174/1567201811310010013
- Galano A, Tan DX, Reiter RJ. On the free radical scavenging activities of melatonin's metabolites, AFMK and AMK. J Pineal Res 2013; 54:245-57; PMID:22998574; http://dx.doi.org/10.1111/jpi.12010
- Zhang HM, Zhang YQ. Melatonin: a well-documented antioxidant with conditional pro-oxidant actions. J Pineal Res 2014; 57:131-46; PMID:25060102; http://dx.doi.org/10.1111/jpi.12162
- Acuna Castroviejo D, Lopez LC, Escames G, Lopez A, Garcia JA, Reiter RJ. Melatonin-mitochondria interplay in health and disease. Curr Top Med Chem 2011; 11:221-40; PMID:21244359; http://dx.doi.org/10.2174/156802611794863517
- Jimenez-Aranda A, Fernandez-Vazquez G, Mohammad ASM, Reiter RJ, Agil A. Melatonin improves mitochondrial function in inguinal white adipose tissue of Zucker diabetic fatty rats. J Pineal Res 2014; 57:103-9; PMID:24867433; http://dx.doi.org/10.1111/jpi.12147
- Chang CF, Huang HJ, Lee HC, Hung KC, Wu RT, Lin AM. Melatonin attenuates kainic acid-induced neurotoxicity in mouse hippocampus via inhibition of autophagy and alpha-synuclein aggregation. J Pineal Res 2012; 52:312-21; PMID:22212051; http://dx.doi.org/10.1111/j.1600-079X.2011.00945.x
- Zhou H, Chen J, Lu X, Shen C, Zeng J, Chen L, Pei Z. Melatonin protects against rotenone-induced cell injury via inhibition of Omi and Bax-mediated autophagy in Hela cells. J Pineal Res 2012; 52:120-7; PMID:21883444; http://dx.doi.org/10.1111/j.1600-079X.2011.00926.x
- Feng YM, Jia YF, Su LY, Wang D, Lv L, Xu L, Yao YG. Decreased mitochondrial DNA copy number in the hippocampus and peripheral blood during opiate addiction is mediated by autophagy and can be salvaged by melatonin. Autophagy 2013; 9:1395-406; PMID:23800874; http://dx.doi.org/10.4161/auto.25468
- Klionsky DJ, Abdalla FC, Abeliovich H, Abraham RT, Acevedo-Arozena A, Adeli K, Agholme L, Agnello M, Agostinis P, Aguirre-Ghiso JA, et al. Guidelines for the use and interpretation of assays for monitoring autophagy. Autophagy 2012; 8:445-544; PMID:22966490; http://dx.doi.org/10.4161/auto.19496
- Kimura S, Noda T, Yoshimori T. Dissection of the autophagosome maturation process by a novel reporter protein, tandem fluorescent-tagged LC3. Autophagy 2007; 3:452-60; PMID:17534139; http://dx.doi.org/10.4161/auto.4451
- Sena LA, Chandel NS. Physiological roles of mitochondrial reactive oxygen species. Mol Cell 2012; 48:158-67; PMID:23102266; http://dx.doi.org/10.1016/j.molcel.2012.09.025
- Lambert AJ, Brand MD. Reactive oxygen species production by mitochondria. Methods Mol Biol 2009; 554:165-81; PMID:19513674
- El Assar M, Ruiz de Adana JC, Angulo J, Pindado Martinez ML, Hernandez Matias A, Rodriguez-Manas L. Preserved endothelial function in human obesity in the absence of insulin resistance. J Transl Med 2013; 11:263; PMID:24138787; http://dx.doi.org/10.1186/1479-5876-11-263
- Tao RD, Vassilopoulos A, Parisiadou L, Yan YF, Gius D. Regulation of MnSOD enzymatic activity by Sirt3 connects the mitochondrial acetylome signaling networks to aging and carcinogenesis. Antioxid Redox Signal 2014; 20:1646-54; PMID:23886445; http://dx.doi.org/10.1089/ars.2013.5482
- Tao R, Coleman MC, Pennington JD, Ozden O, Park SH, Jiang H, Kim HS, Flynn CR, Hill S, Hayes McDonald W, et al. Sirt3-mediated deacetylation of evolutionarily conserved lysine 122 regulates MnSOD activity in response to stress. Mol Cell 2010; 40:893-904; PMID:21172655; http://dx.doi.org/10.1016/j.molcel.2010.12.013
- Chen Y, Zhang J, Lin Y, Lei Q, Guan KL, Zhao S, Xiong Y. Tumour suppressor SIRT3 deacetylates and activates manganese superoxide dismutase to scavenge ROS. EMBO Rep 2011; 12:534-41; PMID:21566644; http://dx.doi.org/10.1038/embor.2011.65
- Qiu X, Brown K, Hirschey MD, Verdin E, Chen D. Calorie restriction reduces oxidative stress by SIRT3-mediated SOD2 activation. Cell Metab 2010; 12:662-7; PMID:21109198; http://dx.doi.org/10.1016/j.cmet.2010.11.015
- Xu SC, He MD, Lu YH, Li L, Zhong M, Zhang YW, Wang Y, Yu ZP, Zhou Z. Nickel exposure induces oxidative damage to mitochondrial DNA in Neuro2a cells: the neuroprotective roles of melatonin. J Pineal Res 2011; 51:426-33; PMID:21797922; http://dx.doi.org/10.1111/j.1600-079X.2011.00906.x
- Galli U, Mesenzani O, Coppo C, Sorba G, Canonico PL, Tron GC, Genazzani AA. Identification of a sirtuin 3 inhibitor that displays selectivity over sirtuin 1 and 2. Eur J Med Chem 2012; 55:58-66; PMID:22835719; http://dx.doi.org/10.1016/j.ejmech.2012.07.001
- Larison JR, Likens GE, Fitzpatrick JW, Crock JG. Cadmium toxicity among wildlife in the Colorado Rocky Mountains. Nature 2000; 406:181-3; PMID:10910356; http://dx.doi.org/10.1038/35018068
- El-Sokkary GH, Nafady AA, Shabash EH. Melatonin administration ameliorates cadmium-induced oxidative stress and morphological changes in the liver of rat. Ecotoxicol Environ Saf 2010; 73:456-63; PMID:19913298; http://dx.doi.org/10.1016/j.ecoenv.2009.09.014
- Kim CY, Lee MJ, Lee SM, Lee WC, Kim JS. Effect of melatonin on cadmium-induced hepatotoxicity in male Sprague-Dawley rats. Tohoku J Exp Med 1998; 186:205-13; PMID:10348216; http://dx.doi.org/10.1620/tjem.186.205
- Chwelatiuk E, Wlostowski T, Krasowska A, Bonda E. The effect of orally administered melatonin on tissue accumulation and toxicity of cadmium in mice. J Trace Elem Med Biol 2006; 19:259-65; PMID:16443174; http://dx.doi.org/10.1016/j.jtemb.2005.10.006
- Kara H, Cevik A, Konar V, Dayangac A, Servi K. Effects of selenium with vitamin E and melatonin on cadmium-induced oxidative damage in rat liver and kidneys. Biol Trace Elem Res 2008; 125:236-44; PMID:18528643; http://dx.doi.org/10.1007/s12011-008-8168-x
- Romero A, Ramos E, de Los Rios C, Egea J, Del Pino J, Reiter RJ. A review of metal-catalyzed molecular damage: protection by melatonin. J Pineal Res 2014; 54;343-70; http://dx.doi.org/10.1111/jpi.12132
- Guo P, Pi H, Xu S, Zhang L, Li Y, Li M, Cao Z, Tian L, Xie J, Li R, et al. Melatonin improves mitochondrial function by promoting MT1/SIRT1/PGC-1 Alpha-dependent mitochondrial biogenesis in cadmium-induced hepatotoxicity in vitro. Toxicol Sci 2014;142:182-95; PMID:25159133; http://dx.doi.org/10.1093/toxsci/kfu164
- Liu Y, Levine B. Autosis and autophagic cell death: the dark side of autophagy. Cell Death Differ 2014; 22: 367-76; PMID:25257169; http://dx.doi.org/10.1038/cdd.2014.143
- Essick EE, Sam F. Oxidative stress and autophagy in cardiac disease, neurological disorders, aging and cancer. Oxid Med Cell Longev 2010; 3:168-77; PMID:20716941; http://dx.doi.org/10.4161/oxim.3.3.12106
- Zhang T, Li Y, Park KA, Byun HS, Won M, Jeon J, Lee Y, Seok JH, Choi SW, Lee SH, et al. Cucurbitacin induces autophagy through mitochondrial ROS production which counteracts to limit caspase-dependent apoptosis. Autophagy 2012; 8:559-76; PMID:22441021; http://dx.doi.org/10.4161/auto.18867
- Shen W, Tian C, Chen H, Yang Y, Zhu D, Gao P, Liu J. Oxidative stress mediates chemerin-induced autophagy in endothelial cells. Free Radic Biol Med 2013; 55:73-82; PMID:23195684; http://dx.doi.org/10.1016/j.freeradbiomed.2012.11.011
- Dai DF, Rabinovitch P. Mitochondrial oxidative stress mediates induction of autophagy and hypertrophy in angiotensin-II treated mouse hearts. Autophagy 2011; 7:917-8; PMID:21505274; http://dx.doi.org/10.4161/auto.7.8.15813
- Kim Y, Kim YS, Kim DE, Lee JS, Song JH, Kim HG, Cho DH, Jeong SY, Jin DH, Jang SJ, et al. BIX-01294 induces autophagy-associated cell death via EHMT2/G9a dysfunction and intracellular reactive oxygen species production. Autophagy 2013; 9: 2126-39; PMID:24322755; http://dx.doi.org/10.4161/auto.26308
- Rubio N, Coupienne I, Di Valentin E, Heirman I, Grooten J, Piette J, Agostinis P. Spatiotemporal autophagic degradation of oxidatively damaged organelles after photodynamic stress is amplified by mitochondrial reactive oxygen species. Autophagy 2012; 8:1312-24; PMID:22889744; http://dx.doi.org/10.4161/auto.20763
- Kim EH, Sohn S, Kwon HJ, Kim SU, Kim MJ, Lee SJ, Choi KS. Sodium selenite induces superoxide-mediated mitochondrial damage and subsequent autophagic cell death in malignant glioma cells. Cancer Res 2007; 67:6314-24; PMID:17616690; http://dx.doi.org/10.1158/0008-5472.CAN-06-4217
- Chen Y, Azad MB, Gibson SB. Superoxide is the major reactive oxygen species regulating autophagy. Cell Death Differ 2009; 16:1040-52; PMID:19407826; http://dx.doi.org/10.1038/cdd.2009.49
- Zhu Y, Park SH, Ozden O, Kim HS, Jiang H, Vassilopoulos A, Spitz DR, Gius D. Exploring the electrostatic repulsion model in the role of Sirt3 in directing MnSOD acetylation status and enzymatic activity. Free Radic Biol Med 2012; 53:828-33; PMID:22732184; http://dx.doi.org/10.1016/j.freeradbiomed.2012.06.020
- Zeng L, Yang Y, Hu Y, Sun Y, Du Z, Xie Z, Zhou T, Kong W. Age-related decrease in the mitochondrial sirtuin deacetylase Sirt3 expression associated with ROS accumulation in the auditory cortex of the mimetic aging rat model. PloS One 2014; 9:e88019; PMID:24505357; http://dx.doi.org/10.1371/journal.pone.0088019
- Li MY, Chiu JF, Mossman BT, Fukagawa NK. Down-regulation of manganese-superoxide dismutase through phosphorylation of FOXO3a by Akt in explanted vascular smooth muscle cells from old rats. J Biol Chem 2006; 281:40429-39; PMID:17079231; http://dx.doi.org/10.1074/jbc.M606596200
- Banreti A, Sass M, Graba Y. The emerging role of acetylation in the regulation of autophagy. Autophagy 2013; 9:819-29; PMID:23466676; http://dx.doi.org/10.4161/auto.23908
- Papanicolaou KN, O'Rourke B, Foster DB. Metabolism leaves its mark on the powerhouse: recent progress in post-translational modifications of lysine in mitochondria. Front Physiol 2014; 5:301; PMID:25228883; http://dx.doi.org/10.3389/fphys.2014.00301
- Hebert AS, Dittenhafer-Reed KE, Yu W, Bailey DJ, Selen ES, Boersma MD, Carson JJ, Tonelli M, Balloon AJ, Higbee AJ, et al. Calorie restriction and SIRT3 trigger global reprogramming of the mitochondrial protein acetylome. Mol Cell 2013; 49:186-99; PMID:23201123; http://dx.doi.org/10.1016/j.molcel.2012.10.024
- Schwer B, Verdin E. Conserved metabolic regulatory functions of sirtuins. Cell Metab 2008; 7:104-12; PMID:18249170; http://dx.doi.org/10.1016/j.cmet.2007.11.006
- Giralt A, Villarroya F. SIRT3, a pivotal actor in mitochondrial functions: metabolism, cell death and aging. Biochem J 2012; 444:1-10; PMID:22533670; http://dx.doi.org/10.1042/BJ20120030
- Liu TF, Vachharajani V, Millet P, Bharadwaj MS, Molina AJ, McCall CE. Sequential actions of SIRT1-RelB-SIRT3 coordinate nuclear-mitochondrial communication during immunometabolic adaptation to acute inflammation and sepsis. J Biol Chem 2015; 290:396-408; PMID:25404738; http://dx.doi.org/10.1074/jbc.M114.566349
- Das S, Mitrovsky G, Vasanthi HR, Das DK. Antiaging properties of a grape-derived antioxidant are regulated by mitochondrial balance of fusion and fission leading to mitophagy triggered by a signaling network of Sirt1-Sirt3-Foxo3-PINK1-PARKIN. Oxid Med Cell Longev 2014; 345105; PMID:24669285
- Peserico A, Chiacchiera F, Grossi V, Matrone A, Latorre D, Simonatto M, Fusella A, Ryall JG, Finley LW, Haigis MC, et al. A novel AMPK-dependent FoxO3A-SIRT3 intramitochondrial complex sensing glucose levels. Cell Mol Life Sci 2013; 70:2015-29; PMID:23283301; http://dx.doi.org/10.1007/s00018-012-1244-6
- Koyama T, Kume S, Koya D, Araki S, Isshiki K, Chin-Kanasaki M, Sugimoto T, Haneda M, Sugaya T, Kashiwagi A, et al. SIRT3 attenuates palmitate-induced ROS production and inflammation in proximal tubular cells. Free Radic Biol Med 2011; 51:1258-67; PMID:21664458; http://dx.doi.org/10.1016/j.freeradbiomed.2011.05.028
- Govender J, Loos B, Marais E, Engelbrecht AM. Mitochondrial catastrophe during doxorubicin-induced cardiotoxicity: a review of the protective role of melatonin. J Pineal Res 2014; 57:367-80; PMID:25230823; http://dx.doi.org/10.1111/jpi.12176
- Paulin R, Dromparis P, Sutendra G, Gurtu V, Zervopoulos S, Bowers L, Haromy A, Webster L, Provencher S, Bonnet S, et al. Sirtuin 3 deficiency is associated with inhibited mitochondrial function and pulmonary arterial hypertension in rodents and humans. Cell Metab 2014; 20:827-39; PMID:25284742; http://dx.doi.org/10.1016/j.cmet.2014.08.011
- Ji YL, Wang H, Meng C, Zhao XF, Zhang C, Zhang Y, Zhao M, Chen YH, Meng XH, Xu DX. Melatonin alleviates cadmium-induced cellular stress and germ cell apoptosis in testes. J Pineal Res 2012; 52:71-9; PMID:21793897; http://dx.doi.org/10.1111/j.1600-079X.2011.00921.x
- Hanna RA, Quinsay MN, Orogo AM, Giang K, Rikka S, Gustafsson AB. Microtubule-associated protein 1 light chain 3 (LC3) interacts with Bnip3 protein to selectively remove endoplasmic reticulum and mitochondria via autophagy. J Biol Chem 2012; 287:19094-104; PMID:22505714; http://dx.doi.org/10.1074/jbc.M111.322933
- Hariharan N, Zhai P, Sadoshima J. Oxidative stress stimulates autophagic flux during ischemia/reperfusion. Antioxid Redox Signal 2011; 14:2179-90; PMID:20812860; http://dx.doi.org/10.1089/ars.2010.3488
- Lu Y, Dong S, Hao B, Li C, Zhu K, Guo W, Wang Q, Cheung KH, Wong CW, Wu WT, et al. Vacuolin-1 potently and reversibly inhibits autophagosome-lysosome fusion by activating RAB5A. Autophagy 2014; 10:1895-905; PMID:25483964; http://dx.doi.org/10.4161/auto.32200
- Bao JJ, Scott I, Lu ZP, Pang LY, Dimond CC, Gius D, Sack MN. SIRT3 is regulated by nutrient excess and modulates hepatic susceptibility to lipotoxicity. Free Radical Bio Med 2010; 49:1230-7; http://dx.doi.org/10.1016/j.freeradbiomed.2010.07.009
- Shi R, Hu C, Yuan Q, Yang T, Peng J, Li Y, Bai Y, Cao Z, Cheng G, Zhang G. Involvement of vascular peroxidase 1 in angiotensin II-induced vascular smooth muscle cell proliferation. Cardiovasc Res 2011; 91:27-36; PMID:21292788; http://dx.doi.org/10.1093/cvr/cvr042
- Ahn BH, Kim HS, Song S, Lee IH, Liu J, Vassilopoulos A, Deng CX, Finkel T. A role for the mitochondrial deacetylase Sirt3 in regulating energy homeostasis. Proc Natl Acad Sci U S A 2008; 105:14447-52; PMID:18794531; http://dx.doi.org/10.1073/pnas.0803790105
- Kendrick AA, Choudhury M, Rahman SM, McCurdy CE, Friederich M, Van Hove JLK, Watson PA, Birdsey N, Bao JJ, Gius D, et al. Fatty liver is associated with reduced SIRT3 activity and mitochondrial protein hyperacetylation. Biochem J 2011; 433:505-14; PMID:21044047; http://dx.doi.org/10.1042/BJ20100791