ABSTRACT
Monitoring autophagic flux in vivo or in organs remains limited and the ideal methods relative to the techniques possible with cell culture may not exist. Recently, a few papers have demonstrated the feasibility of measuring autophagic flux in vivo by intraperitoneal (IP) injection of pharmacological agents (chloroquine, leupeptin, vinblastine, and colchicine). However, the metabolic consequences of the administration of these drugs remain largely unknown. Here, we report that 0.8 mg/kg/day IP colchicine increased LC3-II protein levels in the liver of fasted trout, supporting the usefulness of this drug for studying autophagic flux in vivo in our model organism. This effect was accompanied by a decrease of plasma glucose concentration associated with a fall in the mRNA levels of gluconeogenesis-related genes. Concurrently, triglycerides and lipid droplets content in the liver increased. In contrast, transcript levels of β-oxidation-related gene Cpt1a dropped significantly. Together, these results match with the reported role of autophagy in the regulation of glucose homeostasis and intracellular lipid stores, and highlight the importance of considering these effects when using colchicine as an in vivo “autophagometer.”
Introduction
Autophagy functions as an important catabolic mechanism by mediating the turnover of intracellular organelles and protein complexes through a lysosome-dependent degradative pathway. This system involves dynamic rearrangements of double-membrane organelles called autophagosomes, which engulf a portion of cytoplasm for its degradation via the lysosome. One of the primary roles of autophagy is to allow cell survival under stress conditions through the bulk degradation of intracellular organelles and protein complexes to produce amino acids, nucleotides, sugars and fatty acids that can be used for the metabolic compensation. However, basal autophagy makes also a substantial contribution to cellular quality control. Accordingly, liver-, brain-, and muscle-specific autophagy deficient mice exhibit cumulative effects of impaired basal autophagy, which is responsible for diverse pathological symptoms.Citation1-4
One of the most widely monitored autophagy-related protein is LC3 (a mammalian ortholog of Atg8 in yeast). This ubiquitin-like molecule is present as a nonlipidated form (LC3-I) that is conjugated covalently to phosphatidylethanolamine on the phagophore membrane to form LC3-II, which is a good indicator of autophagosome formation. The measure of the conversion of LC3-I to LC3-II by immunoblot is a reliable indicator of autophagic activity. However, this method needs to be complemented by assays to estimate overall autophagic flux or rate of flow, since LC3-II is both induced and degraded during autophagy. Several studies have investigated in depth the autophagy flux assay in mammalian cell culture models, and reported that the exposure of cells to lysosomal inhibitors, protease inhibitors or agent that block fusion of autophagosome with lysosomes consequently leads to LC3-II accumulation in autolysosomes, which can be quantitatively measured.Citation5,6 Provided that the necessary precautions are taken in the experimental designs (e.g., by plotting LC3-II levels over time during inhibitor treatment and not only at a single time point) and in the interpretation of obtained results, these assays allow the measurement of autophagic flux in a sensitive and quantifiable manner.Citation7,8
Nevertheless, measuring autophagic flux in vivo is not as advanced as in cell culture.Citation5 The major hurdle with in vivo analyses is the ability to “block” autophagosome degradation by the administration of pharmacological agents. Several studies have successfully done this in select tissues in vivo by treating mice with, for example, chloroquine,Citation9 leupeptin,Citation10 or colchicineCitation11 and then monitoring the change in accumulation of LC3-II. However, the time period of the treatment to achieve a block in autophagosome-lysosome fusion differs considerably between organs.Citation10,11 It has thus been shown that intraperitoneal (IP) injection of leupeptin triggers significant accumulation of LC3-II in liver as early as 30 to 60 min after the treatment,Citation10 whereas most of the studies focusing on skeletal muscle treated mice for no less than 2 d (i.e., a daily injection from 2 to 10 d).Citation9,11-13 As a consequence, the prolonged use of these drugs could induce collateral effects that might directly or indirectly affect autophagy. For instance, Ju et al. report that both LC3-I and LC3-II levels increase in skeletal muscle of mice treated with colchicine beyond 5 d, suggesting that the long- period treatments induce autophagic flux blockage but also enhance autophagy.Citation11 This upregulation in autophagy could be explained by the compensatory effects of blocking agents used for a long period. However, the consequence of these prolonged treatments has not been reported so far.
To clarify this issue, we used the rainbow trout (Oncorhynchus mykiss) as a study model. This species, as other salmonids, is adapted to experience long periods of fasting and emerged as a relevant model organism for studying and monitoring autophagy. We first tested 3 different pharmacological drugs for their ability to block LC3-II degradation. We reported that 0.8 mg/kg/d IP injection of colchicine increased LC3-II protein levels in the liver of fasted trout. We then analyzed the consequences of this drug on the liver metabolism, by assessing plasma and liver metabolites but also genes expression of key metabolic pathways in the liver of trout. Our results show that the prolonged use of these drugs can profoundly affect metabolic and cellular homeostasis and highlight the importance to consider these effects when performing autophagic flux assays in vivo.
Results
Colchicine promotes an increase of LC3-II and autophagosome-related vacuoles in the liver of trout
We first tested 3 different lysosomotropic agents (chloroquine, vinblastine and colchicine) for their ability to block autophagosome degradation in vivo.Citation11 We treated juvenile immature rainbow trout with IP vehicle, chloroquine (20, 40 and 50 mg/kg/d), colchicine (0.4 mg/kg/d) or vinblastine (2 mg/kg/d) for 2 d and then isolated the liver. Chloroquine treatment resulted in animal death on d 2, revealing high toxicity of this drug in this species. For the other 2 drugs, no weight loss or distress was seen after the 2 d of treatment (data not shown). The liver was homogenized and the resultant lysate was subjected to SDS-PAGE and immunoblotted with an antibody to LC3B. The ratio of LC3-II to TUBB/β-tubulin was significantly elevated in the colchicine but not vinblastine-treated trout in comparison to the vehicle-treated fish ().
Figure 1. Colchicine promotes an increase of LC3-II in the liver of trout. (A) Representative LC3-II and TUBB immunoblots of liver homogenates from trout treated with water, 2 mg/kg/d vinblastine or 0.4, mg/kg/d colchicine for 2 d. Graph represents the ratio between LC3-II and TUBB used as loading control. Different letters represent significantly different values (P < 0.05; n = 6). (B) Representative LC3-II and TUBB immunoblots of liver homogenates from trout treated with water, 0.4, 0.8 or 3.2 mg/kg/d colchicine for one d. Graph represents the ratio between LC3-II and TUBB used as loading control. Different letters represent significantly different values (P < 0.05; n = 6). (C) Representative LC3-II and TUBB immunoblots of liver homogenates from trout treated with water or 0.8 mg/kg/day colchicine for one, 2 or 3 d. Graph represents the ratio between LC3-II and TUBB used as loading control. * was used to indicate significant difference between treatment (P < 0.05; n = 6).
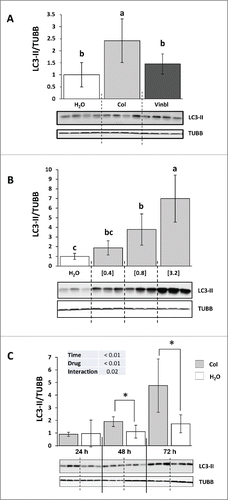
To define the best conditions for measuring autophagic flux in trout, we then tested different doses of colchicine treatment. Fish received IP-injections of 3 doses of colchicine (0.4, 0.8 and 3.2 mg/kg/d) that produced a strong, dose-dependent, increase in LC3-II to TUBB ratio in the liver (). However, the higher concentration (3.2 mg/kg/d) resulted in the death of several animals few hours after the treatment, revealing high toxicity of this drug at this concentration. Fish were then treated with either vehicle or the intermediate dose of colchicine (0.8 mg/kg/d) for 24, 48 and 72 h in order to determine the rate of LC3-II accumulation after colchicine injection. As shown in , compared to vehicle-treated trout, colchicine injection lead to a significant increase of LC3-II to TUBB ratio from the d 2 of treatment.
We next performed transmission electron microscopy on liver samples to assess autophagosome formation at the 72 h time point. Consistent with the western blot analysis, we found that the number of autophagosome- and lysosome-related vacuoles is most abundant in colchicine-treated fish in comparison to the vehicle-treated fish ().
Figure 2. Electron microscopy (EM) analysis of liver sections of trout. The trout were treated for 72 h with water (A to C) or 0.8 mg/kg/d colchicine (D to H). N, nucleus; white arrow, autophagic vacuole; black arrow, lysosome. Graphs: average number of autophagosomes (I) and lysosomes (J) per mm2 in the EM images. (*, P < 0.05; n = 3 samples with 8 to 10 micrographs per sample).
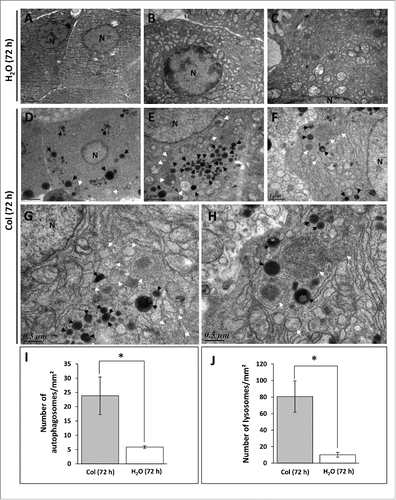
Overall, these results indicated that colchicine treatment is able to block autophagosome degradation in trout liver and validated the use of this drug for measuring autophagic flux in this species.
Colchicine treatment affects hepatic carbohydrates and protein metabolisms
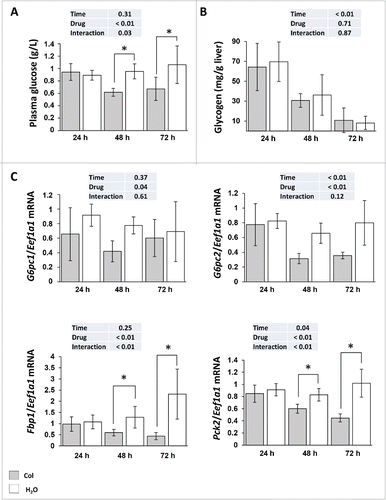
Having demonstrated that colchicine is able to block autophagic flux in the liver of rainbow trout, we addressed the question of colchicine treatment induced metabolic changes. As shown in , compared with control groups, plasma glucose concentration decreased significantly from d 2 of colchicine treatment. These lower blood glucose levels in colchicine-treated fish did not seem to result from decreased glycogenolysis or glycophagy, because the decrease in glycogen levels induced by starvation was comparable in both groups of animals (). In contrast, we found that colchicine lowered significantly the mRNA levels of the gluconeogenesis genes G6pc, Fbp1 and Pck2 from the second d of treatment ().
Figure 3. Altered hepatic carbohydrates metabolism in colchicine-treated fish. Trout were treated with water or 0.8 mg/kg/d colchicine for one, 2 or 3 d. (A) Plasma glucose levels (*, P < 0.05; n = 6). (B) Hepatic glycogen levels (*, P < 0.05; n = 6). (C) Hepatic mRNA levels of the gluconeogenesis-related genes G6pc1, G6pc2, Fbp1, and Pck2. Expression values are normalized with Eef1a1-expressed transcripts (*, P < 0.05; n = 6).
Liver autophagy contributes to the maintenance of fasting glycemia by releasing amino acids to be used as precursors for glucose production via gluconeogenesis.Citation14 We therefore examined the concentration of each of 20 amino acids in the liver of control and colchicine-treated fish. During the measured time period of starvation, the levels of some amino acids (including branched-chain amino acids) in the liver of control fish increased gradually and significantly (, Fig. S1). For most of these amino acids, the increase during starving was lowered by colchicine treatment, in accordance with the reported role of liver autophagy on amino acid release during starvation. In contrast, the levels of alanine, a major glucogenic amino acid released by skeletal muscle during fasting, increased significantly in colchicine-treated fish supporting the observed decrease of gluconeogenesis “capacity.”
Figure 4. Time courses of the changes in branched-chain amino acids and alanine levels in the liver of trout during starvation. Livers were isolated from trout treated with water (red square) or 0.8 mg/kg/d colchicine (blue circle) for one, 2 or 3 d. The concentration of each amino acid is expressed as µmol/g wet tissue. Each value is the mean ± 95% confidence limit of data from 6 trout. *, P < 0.05.
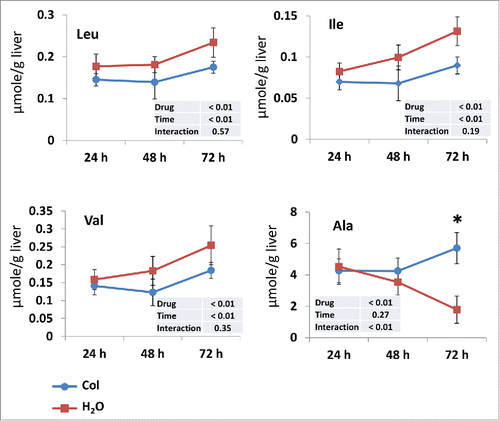
Overall, these results show that colchicine treatment decreases plasma glucose concentration and link this effect to an autophagy-dependent gluconeogenesis inhibition.
Colchicine treatment disturbs the major energy sensors AMPK but not the nutrient sensor MTOR
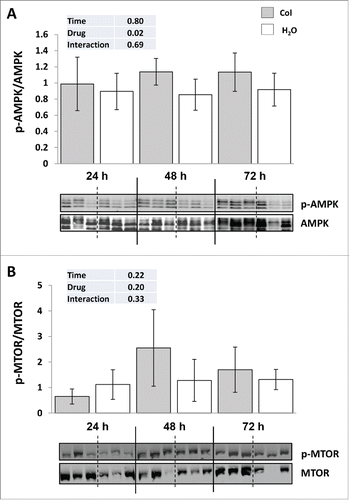
It is well accepted that MTOR and AMPK sense and integrate cellular nutrition and energy signals to maintain cellular homeostasis. We therefore monitored the phosphorylation status of these 2 factors in both control fish and colchicine-treated fish, which display profound disorders of hepatic carbohydrates and protein metabolism. As shown in , colchicine treatment significantly increased the phosphorylation of AMPK on Thr172 supporting a fall in the liver energy status. In contrast, no difference of the phosphorylation status of MTOR at Ser2448 was observed between control and colchicine-treated fish ().
Figure 5. Colchicine treatment disturbs the major energy sensors AMPK but not the nutrient sensor MTOR. (A) Representative phospho-AMPK at Thr172 and total AMPK immunoblots of liver homogenates from trout treated with water or 0.8 mg/kg/d colchicine for one, 2 or 3 d. Graph represents the ratio between phospho-AMPK and total AMPK. (B) Representative phospho-MTOR at Ser2448 and total MTOR immunoblots of liver homogenates from trout treated with water or 0.8 mg/kg/day colchicine for one, 2 or 3 d. Graph represents the ratio between phospho-MTOR and total MTOR.
Colchicine treatment leads to hepatosteatosis
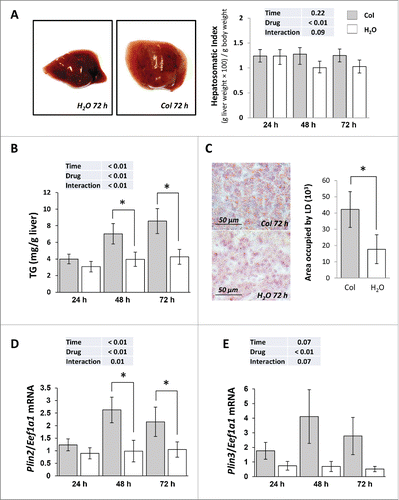
Colchicine injected fish exhibited an enlarged liver from d 2 of treatment (). This was accompanied by a concomitant increase of hepatic triglycerides (TG) content (), a positive staining of liver sections with the neutral lipid dye oil red O (ORO) () and a significant rise of the mRNA levels of the 2 lipid droplets (LD) markers, namely Plin2/Adrp (perilipin 2) and Plin3/Tip47 (perilipin 3) (). Thus, these results suggest that inhibition of autophagy by colchicine treatment induces hepatic steatosis.
Figure 6. Colchicine treatment leads to hepatosteatosis. Trout were treated with water or 0.8 mg/kg/d colchicine for one, 2 or 3 d. (A) Left: representative images of livers of fish treated for 72 h. Right: Hepatosomatic index, n = 6. (B) Hepatic TG levels (*, P < 0.05; n = 6). (C) Left: Oil red O (ORO) staining of liver sections from 72 h colchicine- or water-treated fish. Right: Quantification of area occupied by lipid droplets (LD). *, P < 0.05; n = 6. (D) Hepatic mRNA levels of Plin2/Adrp and (E) Plin3/Tip47. Expression values are normalized with Eef1a1-expressed transcripts (*, P < 0.05; n = 6).
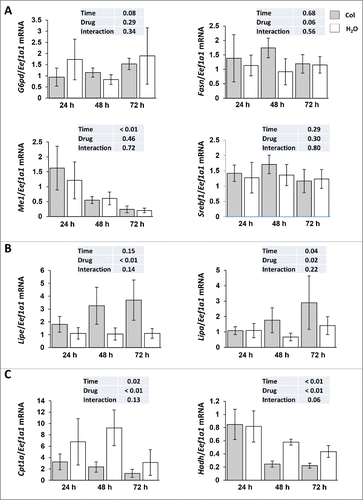
However, the observed accumulation of TG in colchicine-treated fish could also originate from autophagy-independent side effects induced by the administered drug. We therefore examined the expression of several genes involved in lipid metabolism. As shown in , the mRNA expression of all monitored lipogenic genes (G6pd, Fasn, Me1 and Srebf1) remained unchanged between control and colchicine injected fish throughout the starvation periods. In contrast, the mRNA levels of Lipa (lysosomal acid lipase A) and Lipe (lipase, hormone sensitive) strongly increased in colchicine-treated fish, consistent with reduced substrate delivery to the lysosome rather than reduced lysosomal or cytosolic enzymatic machinery (). Also, supporting a fall in the levels of free fatty acids generated by TG hydrolysis, the mRNA levels of 2 main β-oxidation-related genes (Cpt1a and Hadh) significantly decreased in colchicine-treated fish ().
Figure 7. Altered hepatic lipid metabolism in colchicine-treated fish. Trout were treated with water or 0.8 mg/kg/d colchicine for one, 2 or 3 d. Hepatic mRNA levels of (A) lipogenic genes (G6pd, Fasn, Me1 and Srebf1), (B) Lipe (lipase, hormone-sensitive), Lipa (lysosomal acid lipase A) and (C) β-oxidation-related genes (Cpt1a and Hadh). Expression values are normalized with Eef1a1-expressed transcripts (*, P < 0.05; n = 6).
Overall, the results obtained show that colchicine treatment induces hepatic steatosis and link this effect to autophagy inhibition.
Colchicine treatment induces ER stress markers as well as autophagy- and lysosome-related genes but not lysosomal function
Obesity and liver steatosis have been shown to induce ER stress.Citation15-17 We therefore monitored in colchicine-treated and nontreated fish the expression of 2 ER stress-induced genes, Ddit3/Chop (DNA-damage inducible transcript 3) and Asns (asparagine synthetase). As shown in , the mRNA levels of these genes were significantly increased from d 2 of colchicine treatment, supporting the induction of an ER-stress in this condition.
Figure 8. Colchicine treatment induces ER stress markers as well as autophagy- and lysosome-related genes. Trout were treated with water or 0.8 mg/kg/d colchicine for one, 2 or 3 d. Hepatic mRNA levels of (A) ER stress-induced genes Ddit3 and Asns, (B) autophagy- related genes Sqstm1, Atg4b, and (C) lysosome- related genes Atp6v1a and Ctsd. Expression values are normalized with Eef1a1-expressed transcripts (*, P < 0.05; n = 6).
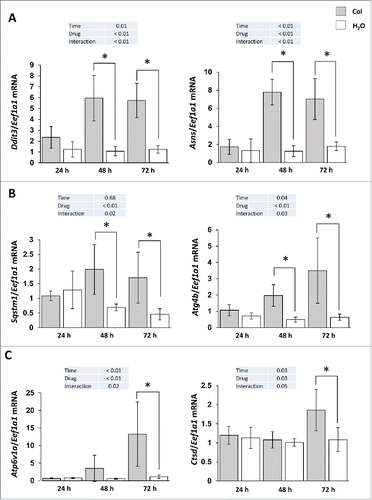
Given that emerging data demonstrated that ER stress is a potent inducer of autophagy,Citation18-20 we also looked at the expression of several autophagy- (Sqstm1/p62, Atg4b) and lysosome- (Atp6v1a and Ctsd) related genes. As expected, the results obtained show a clear induction of these genes in colchicine-treated fish in comparison to control group (). However, this increase of the mRNA levels of lysosomal genes in colchicine-treated fish was not followed by an induction of CTSD activity (data not shown), supporting a lack of activation of lysosomal function in this condition.
Discussion
Reliable and quantitative assays to measure in vivo autophagy are essential. Currently, there are varied methods for monitoring autophagy; however, it remains a challenge to measure “autophagic flux” in an in vivo model system.Citation5 In the present study, we first describe the feasibility of monitoring autophagic flux in vivo in rainbow trout by using colchicine. Although the principle of this colchicine-based assay has been described in mice,Citation11 this report broadens its utility to another organism, the rainbow trout. The results showed that 2 d of colchicine treatment are necessary to induce a significant increase of LC3-II, in line with a previous finding in mice.Citation11 This represents a critical difference with the short period of time (2 to 4 h) necessary to block autophagosome-lysosome fusion with bafilomycin A1 in many cell culture systems including trout myoblasts.Citation5,21 The reason for this difference is not known and could be related to the inhibitory capacity of the used drugs. However, the level of basal autophagy, the time course of autophagic induction and the biovailability of autophagy-inhibiting drugs may also contribute to this difference. In this regard, basal autophagy or sensitivity to autophagic induction may also vary with tissue (as reported in mice by Mizushima and coworkers),Citation22 animal age, sex, or strain background and the protocol (dose and time period of treatment) may need to be optimized in each case.
One major limitation of the in vivo autophagic flux assay is the “toxicity” of the blocking agent (at the concentration and the time period of treatment necessary to block autophagosome degradation) that may affect and invalidate the measurement of the autophagic flux per se.Citation5 It has thus been shown in mice that increasing doses of colchicine to achieve a complete block in LC3-II degradation had lethal consequences as did the addition of a second “blocking” agent.Citation11 Moreover, the authors of this study reported that both LC3-I and LC3-II levels are elevated when mice are treated with colchicine beyond 5 d, suggesting that both an enhancement and blockage of autophagy is occurring with prolonged treatment. In the present study, fish treated with 0.8 mg/kg/d colchicine did not exhibit weight loss or distress. However, they presented a significant decrease in plasma glucose levels associated with a fall in the mRNA levels of gluconeogenesis-related genes from d 2 of treatment. Recently, Ezaki et al. have demonstrated in mice that liver autophagic proteolysis makes a significant contribution to the maintenance of blood glucose during fasting by releasing amino acids for glucose production via gluconeogenesis.Citation14 In liver-specific autophagy (Atg7)-deficient mice, no amino acid release occurs and blood glucose levels continue to decrease in contrast to those of wild-type mice.Citation14 Similarly, autophagy induction is critical during the fasting period between birth and suckling, for the production of amino acids used to sustain plasma glucose levels via gluconeogenesis.Citation23 In this study, fasted neonatal mice expressing a constitutively active form of RRAGA (RRAGAGTP) failed to induce autophagy and to produce amino acids for de novo glucose production. Consequently, the lower levels of gluconeogenic amino acids reduced hepatic generation of glucose, ultimately leading to hypoglycaemia, energetic exhaustion, and accelerated neonatal death. Our results show a similar fall of the concentration of some amino acids (valine, leucine, isoleucine, threonine, ornithine, and arginine) in the liver of colchicine-treated fish compared to the control group. In contrast, the levels of alanine, which is the main amino acid released by skeletal muscle during fasting and taken up by the liver for glucose production, increased significantly in colchicine-treated fish, in line with the observed fall in the gluconeogenesis capacity. Taken together, these data highlight the importance of autophagy in the control of blood glucose levels via the production of amino acids and indicate that a prolonged inhibition of this system to measure autophagic flux could profoundly perturb glucose homeostasis. Furthermore, our results suggest that, in addition to the previously reported role of autophagy in providing substrates for glucose production,Citation14,23 energy furniture, Citation24 or the synthesis of specific proteins,Citation25 it could also play a major role in the regulation of the expression of gluconeogenesis-related genes, known to be under the tight control of amino acid availability.Citation26-29 This would be an unknown function for autophagy that will certainly deserve future investigation.
In addition to a decrease in plasma glucose levels, colchicine-treated fasted trout exhibited a hepatosteatosis associated with a marked increase of the hepatic TG level, a positive staining with the neutral lipid dye ORO and a significant rise in the hepatic mRNA levels of 2 LD markers, Plin2/Adrp and Plin3/Tip47. Recently, hepatic steatosis and liver injury were also shown to be exacerbated by chloroquine treatment in alcoholic and nonalcoholic fatty liver condition in mice,Citation30 supporting a direct effect of autophagy inhibition in the observed phenotype. In this regard, liver-specific autophagy (Atg7)-deficient mice display increased ORO staining of liver sections, hepatic TG accumulation after starvation and LD-associated proteins PLIN2/ADRP and PLIN3/TIP47 compared to wild-type mice.Citation31 Furthermore, to determine how autophagy regulates TG levels, the authors examine rates of TG synthesis and free fatty acid β-oxidation in Atg5-knockdown hepatocytes (siAtg5 cells). Equivalent rates of TG synthesis occur in control and siAtg5 cells. In contrast, rates of β-oxidation, indicative of the levels of free fatty acid generated by TG hydrolysis,Citation32 are slower in cells with inhibited autophagy, consistent with reduced lipolysis. Overall, our results on the expression of lipid metabolism-related genes support these previous findings and suggest that the hepatosteatosis induced by colchicine treatment results in impairment of lipophagy. A consequence of this deficiency of lipophagy and thus of β-oxidation capacity seems to be the establishment of an energy stress, as suggested by the induction of phosphorylation of AMPK in fish treated with colchicine.
Obesity and liver steatosis have been shown to induce ER stress. For instance, mice with high fat feeding not only develop hepatic steatosis, insulin resistance, and type 2 diabetes, but also exhibit ER stress markers in liver and other tissues.Citation15-17 Thus, ER stress and hepatic steatosis can form a positive feedback loop to further amplify liver inflammation and injury. Here, we show that mRNA levels of 2 ER stress-induced genes, namely Ddit3 and Asns, were significantly increased from d 2 of colchicine treatment. Beyond a simple ER-stress marker, Ddit3 encodes a ubiquitous transcription factor that is one of the most important components in the network of stress-inducible transcription.Citation33-37 In this regard, recent studies have identified DDIT3 as a direct regulator of numerous genes involved in the autophagic process.Citation38-40 Here, we show that the increase of transcripts levels of several autophagy- and lysosome-related genes in colchicine-treated fish paralleled that of Ddit3 mRNA supporting these previous studies. However, the increase of lysosomal transcripts was not followed by an increase of the lysosomal function (as evidenced by the activity of CTSD), in line with the demonstrated inhibition of the autophagic flux in our samples and the recently published data showing that activation of lysosomal function depends on autophagosome-lysosome fusion.Citation41 Thus, the observed induction of autophagy- and lysosome-related transcripts in colchicine-treated fish could result from a compensatory mechanism to rescue a dysfunctional autophagic-lysosomal function. Finally, while we cannot account for all the cellular and metabolic perturbations induced by the long term use of colchicine, we speculate that induction of ER stress may also affect major cellular functions, such as apoptosis or chaperone-mediated autophagy (CMA), that crosstalk with autophagic flux. A modulation of the activity of apoptosis or CMA under metabolic stress conditions has already been reported in different cell types and tissues.Citation42,43 However, it remains to be established whether or not CMA or a CMA-like process exists in fish.
Together, the results presented here demonstrated the feasibility of monitoring autophagic flux in vivo in rainbow trout by using colchicine. However, they also show that the concentration and/or the time period of treatment necessary to block autophagosome degradation in vivo profoundly affect metabolic and cellular homeostasis. While we cannot rule out the possibility that the observed effects are independent of autophagy inhibition, the results obtained match closely with the reported role of this degradative system, highlighting the importance of considering these effects when using not only colchicine, but all autophagy blockers as in vivo “autophagometers.” In the future, another important issue will be to adapt the autophagic flux assay (used drug, dose and time period of treatment) to the studied tissue, animal age, sex, or strain background, which may display a different pattern of autophagy induction and/or sensitivity.
Materials and methods
Reagents
Chloroquine diphosphate salt (C6628), colchicine (C9754) and vinblastine sulfate salt (V1377) were purchased from Sigma-Aldrich.
Experimental procedures
The experiments were carried out in accordance with the EU legal frameworks, specifically those relating to the protection of animals used for scientific purposes (i.e., Directive 2010/63/EU), and under the French legislation governing the ethical treatment of animals (Decret no. 2001-464, May 29th, 2001). The investigators carrying out the experiment had “level 1” or “level 2” certification, bestowed by the Direction Départementale des Services Vétérinaires (French veterinary services) to carry out animal experiments (INRA 2002-36, April 14th, 2002).
Juvenile immature rainbow trout were reared in the INRA experimental facilities at Donzacq (Landes, France) at a constant water temperature of 17.5 ± 0.5°C, under natural photoperiod. They were fed a standard trout commercial diet (T-3P classic, Skretting, Fontaine-les-Vervins, France) during the acclimatization period. Prior to the intraperitoneal (IP) administration, fish (mean body mass 130 g) were food deprived for 24 h (minimal time required to ensure the emptying of the digestive tract). After this period, trout were sedated with benzocaine (10 mg/L), and chloroquine (20, 40 or 50 mg/kg/d), vinblastine (2 mg/kg/d), colchicine (0.4, 0.8 or 3.2 mg/kg/d) or vehicle (water) was IP injected at 100 μL/100 g body mass for 1, 2 or 3 d (as specified in the figure legends) under nutrient-starvation conditions. Then, according to each experimental design, 6 fish per treatment were sampled at different times specified in figure legends. Trout were anaesthetized with benzocaine (30 mg/L) and euthanized by a sharp blow to the head. Blood was removed from the caudal vein into heparinized syringes and centrifuged (3000 g, 5 min); the recovered plasma was immediately frozen and kept at −20°C. Livers were dissected and immediately frozen in liquid nitrogen and kept at −80°C.
Protein extraction and western blotting
Protein homogenates from livers were prepared as previously described.Citation44 Protein concentrations were determined with the Bradford reagent method.Citation45 Lysates (10 µg of total protein) were subjected to SDS-PAGE and immunoblotted with an antibody to LC3B (Cell Signaling Technology, 2775), TUBB (Cell Signaling Technology, 2146), anti-phospho AMPK (Thr172; Cell Signaling Technology, 2531), anti-AMPK (Cell Signaling Technology, 2532), anti-phospho-MTOR (Ser2448; Cell Signaling Technology, 2971), anti-MTOR (Cell Signaling Technology, 2972). These primary antibodies have been shown to cross-react successfully with rainbow trout proteins of interest.Citation21,44,46 After washing, membranes were incubated with an IRDye infrared secondary antibody (LI-COR Inc., 956-32221). Bands were visualized by Infrared Fluorescence using the Odyssey® Imaging System and quantified by Odyssey infrared imaging system software (Application software, version 1.2).
Histological procedures and electron microscopy
For Oil Red O staining, liver tissues, which were frozen in OCT compounds (BDH, 361603E), were cut at 10-μm thickness, mounted on slides and allowed to dry for 30 to 60 min. The sections were fixed with 10% formalin for 10 min and then the slides were rinsed with water. After air drying, the slides were placed in 100% propylene glycol (Sigma, 82280) for 3 min, and stained in 0.5% Oil Red O solution (Sigma, O0625) in propylene glycol for 20 min. The slides were transferred to an 85% propylene glycol solution for 2 min, rinsed in distilled water for 2 changes, and processed for hematoxylin counter staining.
For electron microscopy, liver blocks (1 mm3) were fixed in 2.5% gluteraldehyde in 0.1 M phosphate buffer (pH 7.4), and post-fixed in 1% osmium tetroxide in phosphate buffer. After acetone dehydration and embedding in araldite (epoxy resin; Fluka, 10951), ultrathin sections were stained with lead citrate. Observations were performed on a Hitachi H7650 (80 kV) electron microscope (Electronic imaging pole of Bordeaux Imaging Centre, France). Autophagic vacuoles were identified using previously established criteria.Citation31
Metabolic analysis
Plasma glucose and liver TG were undertaken with Glucose RTU (BioMerieux, 61269) and TRG50 (Sobioda, TRIG050) kits, respectively adapted to a microplate format, according to the recommendations of each manufacturer. Free amino acid concentrations in liver were determined by ion exchange chromatography with a ninhydrin post-column reaction (L-8900 Amino Acid Analyzer, Hitachi High-Technologies Corporation, Tokyo, Japan).
mRNA levels analysis: Quantitative RT-PCR
The extraction of total RNA was performed using TRIzol reagent (Invitrogen, 15596018) according to the manufacturer's recommendations. One microgram of the resulting total RNA was reverse transcribed into cDNA, using the SuperScript III RNAseH-reverse transcriptase kit (Invitrogen, 18080085) with random primers (Promega, Charbonniéres, France) according to the manufacturer's instructions. The primer sequences used in the quantitative real-time PCR, as well as the protocol conditions of the assays, have been previously published.Citation47,48 Primers of the Plin2/Adrp, Plin3/Tip47, Atp6v1a and Ddit3 genes were newly designed using Primer3 software, as previously described.Citation49 To confirm specificity of the newly developed RT-PCR assay, the amplicon was purified and sequenced (Beckman-Coulter Genomics, Takeley, UK). The primers used for real-time RT-PCR assays are listed in . Quantitative RT-PCR was carried out on the Roche LightCycler 480 System (Roche Diagnostics, Neuilly sur Seine, France). The assays were performed using a reaction mix of 6 µl per sample, each of which contained 2 µl of diluted cDNA template, 0.24 µl of each primer (10 µM), 3 µl Light Cycler 480 SY Green Master mix (Roche Diagnostics, 4887352001) and 0.52 µl DNAse/RNAse-free water (5 Prime GmbH, 2500020). The PCR protocol was initiated at 95°C for 10 min for initial denaturation of the cDNA and hot-start Taq-polymerase activation, followed by 45 cycles of a 3-step amplification program (15 s at 95°C; 10 s at 60 to 64°C and 15 s at 72°C), according to the primer set used (). Melting curves were systematically monitored (temperature gradient at 1.1°C/10 s from 65 to 94°C) at the end of the last amplification cycle to confirm the specificity of the amplification reaction. Each PCR assay included replicate samples (duplicate of reverse transcription and PCR amplification, respectively) and negative controls (reverse transcriptase- and cDNA template-free samples, respectively). For the expression analysis of mRNA, relative quantification of target gene expression was performed using the delta CT method described by Pfaffl.Citation50 The relative gene expression of Eef1a1 was used for the normalization of measured mRNA and did not significantly change over time (data not shown). In all cases, PCR efficiency (E) was measured by the slope of a standard curve using serial dilutions of cDNA. In all cases, PCR efficiency values ranged between 1.8 and 2.2.
Table 1. Sequences of the primer pairs used for real-time quantitative RT-PCR.
CTSD (cathepsin D) activity assay
Enzyme activity of CTSD was determined with CTSD activity fluorometric assay kit according to the manufacturer's protocol (abcam, AB65302). Briefly, tissue homogenates were centrifuged at 10,000×g for 10 min at 4°C and the supernatant fraction was used for enzymatic assay. Protein was incubated at 37°C for 1 to 2 h with the preferred CTSD substrate sequence GKPILFFRLK(Dnp)-D-R-NH2 labeled with MCA. After incubation for 1 h, fluorescence was measured with a fluorescence microplate reader (Triad Fluorometer, Dynex Technologies) at 328/460 nm (excitation/emission).
Statistical analysis
The data were expressed as means ± 95% confidence limit (n = 6). The effects of time, IP administration of vehicle or drug and their interaction were analyzed using 2-way ANOVA, followed by a Student-Newman-Keuls test when the interaction was significant. For all statistical analyses, the level of significance was set at P < 0.05.
Abbreviations
| AMPK | = | AMP-activated protein kinas |
| ASNS | = | asparagine synthetase |
| ATG4B | = | autophagy-related 4B |
| ATP6V1A | = | ATPase, H+ transporting, lysosomal 70kDa, V1 subunit A |
| CMA | = | chaperone-mediated autophagy |
| CPT1A | = | carnitine palmitoyltransferase 1A, liver |
| CTSD | = | cathepsin D; DDIT3/CHOP, DNA-damage inducible transcript 3 |
| EEF1A1 | = | eukaryotic translation elongation factor 1 α 1 |
| FASN | = | fatty acid synthase |
| FBP1 | = | fructose-1,6-bisphosphatase 1 |
| G6PC | = | glucose 6-phosphatase, catalytic |
| G6PD | = | glucose-6-phosphate dehydrogenase |
| HADH | = | hydroxyacyl-Coenzyme A dehydrogenase |
| IP | = | intraperitoneal |
| MAP1LC3/LC3 | = | microtubule-associated protein 1 light chain 3 |
| LD | = | lipid droplets |
| LIPA | = | lysosomal acid lipase A |
| LIPE | = | lipase, hormone-sensitive |
| ME1 | = | malic enzyme 1, NADP(+)-dependent, cytosolic |
| MTOR | = | mechanistic target of rapamycin (serine/threonine kinase) |
| ORO | = | neutral lipid dye oil red o |
| PCK2 | = | phosphoenolpyruvate carboxykinase 2 (mitochondrial) |
| PLIN2/ADRP | = | perilipin 2 |
| PLIN3/TIP47 | = | perilipin 3 |
| SQSTM1/p62 | = | sequestosome 1 |
| SREBF1 | = | sterol regulatory element binding transcription factor 1 |
| TG | = | triglycerides |
| TUBB/β-tubulin | = | tubulin, β |
Disclosure of potential conflicts of interest
No potential conflicts of interest were disclosed.
KAUP_S_1117732.pptx
Download MS Power Point (235.1 KB)Acknowledgments
We thank AM Cuervo (Albert Einstein College of Medicine, NY) for helpful advice, V Véron and A Hermann (INRA St Pée-sur-Nivelle) for the analysis of plasma glucose and liver TG composition of the fish and the technical staff at the fish farm (F. Vallée, F. Terrier, A. Lanuque, F. Sandres).
Funding
This study was supported by the INRA “Animal Physiology and Livestock Systems” Division, the European Union 7th Framework project (Project Call Identifier: FP7-KBBE-2011-5, Project Number: 288925, Advanced Research Initiatives for Nutrition & Aquaculture (ARRAINA)) and the Conseil Régional d'Aquitaine (CRA n°20121201001) “Nouvelles stratégies alimentaires pour l'aquaculture” (2013–2015).
References
- Hara T, Nakamura K, Matsui M, Yamamoto A, Nakahara Y, Suzuki-Migishima R, Yokoyama M, Mishima K, Saito I, Okano H, et al. Suppression of basal autophagy in neural cells causes neurodegenerative disease in mice. Nature 2006; 441:885-9; PMID:16625204; http://dx.doi.org/10.1038/nature04724
- Komatsu M, Waguri S, Chiba T, Murata S, Iwata J, Tanida I, Ueno T, Koike M, Uchiyama Y, Kominami E, et al. Loss of autophagy in the central nervous system causes neurodegeneration in mice. Nature 2006; 441:880-4; PMID:16625205; http://dx.doi.org/10.1038/nature04723
- Masiero E, Agatea L, Mammucari C, Blaauw B, Loro E, Komatsu M, Metzger D, Reggiani C, Schiaffino S, Sandri M. Autophagy is required to maintain muscle mass. Cell Metab 2009; 10:507-15; PMID:19945408; http://dx.doi.org/10.1016/j.cmet.2009.10.008
- Takamura A, Komatsu M, Hara T, Sakamoto A, Kishi C, Waguri S, Eishi Y, Hino O, Tanaka K, Mizushima N. Autophagy-deficient mice develop multiple liver tumors. Genes Dev 2011; 25:795-800; PMID:21498569; http://dx.doi.org/10.1101/gad.2016211
- Klionsky DJ, Abdalla FC, Abeliovich H, Abraham RT, Acevedo-Arozena A, Adeli K, Agholme L, Agnello M, Agostinis P, Aguirre-Ghiso JA, et al. Guidelines for the use and interpretation of assays for monitoring autophagy. Autophagy 2012; 8:445-544; PMID:22966490; http://dx.doi.org/10.4161/auto.19496
- Mizushima N, Yoshimori T. How to interpret LC3 immunoblotting. Autophagy 2007; 3:542-5; PMID:17611390; http://dx.doi.org/10.4161/auto.4600
- Loos B, du Toit A, Hofmeyr JH. Defining and measuring autophagosome flux-concept and reality. Autophagy 2014; 10:2087-96; PMID:25484088; http://dx.doi.org/10.4161/15548627.2014.973338
- Meijer AJ. Autophagy research: lessons from metabolism. Autophagy 2009; 5:3-5; PMID:19115480; http://dx.doi.org/10.4161/auto.5.1.7207
- Grumati P, Coletto L, Sabatelli P, Cescon M, Angelin A, Bertaggia E, Blaauw B, Urciuolo A, Tiepolo T, Merlini L, et al. Autophagy is defective in collagen VI muscular dystrophies, and its reactivation rescues myofiber degeneration. Nat Med 2010; 16:1313-20; PMID:21037586; http://dx.doi.org/10.1038/nm.2247
- Haspel J, Shaik RS, Ifedigbo E, Nakahira K, Dolinay T, Englert JA, Choi AM. Characterization of macroautophagic flux in vivo using a leupeptin-based assay. Autophagy 2011; 7:629-42; PMID:21460622; http://dx.doi.org/10.4161/auto.7.6.15100
- Ju JS, Varadhachary AS, Miller SE, Weihl CC. Quantitation of “autophagic flux” in mature skeletal muscle. Autophagy 2010; 6:929-35; PMID:20657169; http://dx.doi.org/10.4161/auto.6.7.12785
- Castets P, Lin S, Rion N, Di Fulvio S, Romanino K, Guridi M, Frank S, Tintignac LA, Sinnreich M, Ruegg MA. Sustained activation of mTORC1 in skeletal muscle inhibits constitutive and starvation-induced autophagy and causes a severe, late-onset myopathy. Cell Metab 2013; 17:731-44; PMID:23602450; http://dx.doi.org/10.1016/j.cmet.2013.03.015
- Ching JK, Ju JS, Pittman SK, Margeta M, Weihl CC. Increased autophagy accelerates colchicine-induced muscle toxicity. Autophagy 2013; 9:2115-25; PMID:24184927; http://dx.doi.org/10.4161/auto.26150
- Ezaki J, Matsumoto N, Takeda-Ezaki M, Komatsu M, Takahashi K, Hiraoka Y, Taka H, Fujimura T, Takehana K, Yoshida M, et al. Liver autophagy contributes to the maintenance of blood glucose and amino acid levels. Autophagy 2011; 7:727-36; PMID:21471734; http://dx.doi.org/10.4161/auto.7.7.15371
- Birkenfeld AL, Lee HY, Majumdar S, Jurczak MJ, Camporez JP, Jornayvaz FR, Frederick DW, Guigni B, Kahn M, Zhang D, et al. Influence of the hepatic eukaryotic initiation factor 2alpha (eIF2alpha) endoplasmic reticulum (ER) stress response pathway on insulin-mediated ER stress and hepatic and peripheral glucose metabolism. J Biol Chem 2011; 286:36163-70; PMID:21832042; http://dx.doi.org/10.1074/jbc.M111.228817
- Yang L, Li P, Fu S, Calay ES, Hotamisligil GS. Defective hepatic autophagy in obesity promotes ER stress and causes insulin resistance. Cell Metab 2010; 11:467-78; PMID:20519119; http://dx.doi.org/10.1016/j.cmet.2010.04.005
- Zhou L, Liu F. Autophagy: roles in obesity-induced ER stress and adiponectin downregulation in adipocytes. Autophagy 2010; 6:1196-7; PMID:20864818; http://dx.doi.org/10.4161/auto.6.8.13478
- Liu Y, Burgos JS, Deng Y, Srivastava R, Howell SH, Bassham DC. Degradation of the endoplasmic reticulum by autophagy during endoplasmic reticulum stress in Arabidopsis. Plant Cell 2012; 24:4635-51; PMID:23175745; http://dx.doi.org/10.1105/tpc.112.101535
- Ogata M, Hino S, Saito A, Morikawa K, Kondo S, Kanemoto S, Murakami T, Taniguchi M, Tanii I, Yoshinaga K, et al. Autophagy is activated for cell survival after endoplasmic reticulum stress. Mol Cell Biol 2006; 26:9220-31; PMID:17030611; http://dx.doi.org/10.1128/MCB.01453-06
- Yorimitsu T, Nair U, Yang Z, Klionsky DJ. Endoplasmic reticulum stress triggers autophagy. J Biol Chem 2006; 281:30299-304; PMID:16901900; http://dx.doi.org/10.1074/jbc.M607007200
- Seiliez I, Gabillard JC, Riflade M, Sadoul B, Dias K, Averous J, Tesseraud S, Skiba S, Panserat S. Amino acids downregulate the expression of several autophagy-related genes in rainbow trout myoblasts. Autophagy 2012; 8:364-75; PMID:22252009; http://dx.doi.org/10.4161/auto.18863
- Mizushima N, Yamamoto A, Matsui M, Yoshimori T, Ohsumi Y. In vivo analysis of autophagy in response to nutrient starvation using transgenic mice expressing a fluorescent autophagosome marker. Mol Biol Cell 2004; 15:1101-11; PMID:14699058; http://dx.doi.org/10.1091/mbc.E03-09-0704
- Efeyan A, Zoncu R, Chang S, Gumper I, Snitkin H, Wolfson RL, Kirak O, Sabatini DD, Sabatini DM. Regulation of mTORC1 by the Rag GTPases is necessary for neonatal autophagy and survival. Nature 2013; 493:679-83; PMID:23263183; http://dx.doi.org/10.1038/nature11745
- Mizushima N, Klionsky DJ. Protein turnover via autophagy: implications for metabolism. Annu Rev Nutr 2007; 27:19-40; PMID:17311494; http://dx.doi.org/10.1146/annurev.nutr.27.061406.093749
- Sahani MH, Itakura E, Mizushima N. Expression of the autophagy substrate SQSTM1/p62 is restored during prolonged starvation depending on transcriptional upregulation and autophagy-derived amino acids. Autophagy 2014; 10:431-41; PMID:24394643; http://dx.doi.org/10.4161/auto.27344
- Deval C, Chaveroux C, Maurin AC, Cherasse Y, Parry L, Carraro V, Milenkovic D, Ferrara M, Bruhat A, Jousse C, et al. Amino acid limitation regulates the expression of genes involved in several specific biological processes through GCN2-dependent and GCN2-independent pathways. FEBS J 2009; 276:707-18; PMID:19120448; http://dx.doi.org/10.1111/j.1742-4658.2008.06818.x
- Jousse C, Averous J, Bruhat A, Carraro V, Mordier S, Fafournoux P. Amino acids as regulators of gene expression: molecular mechanisms. Biochem Biophys Res Commun 2004; 313:447-52; PMID:14684183; http://dx.doi.org/10.1016/j.bbrc.2003.07.020
- Lansard M, Panserat S, Plagnes-Juan E, Dias K, Seiliez I, Skiba-Cassy S. L-leucine, L-methionine, and L-lysine are involved in the regulation of intermediary metabolism-related gene expression in rainbow trout hepatocytes. J Nutr 2011; 141:75-80; PMID:21106925; http://dx.doi.org/10.3945/jn.110.124511
- Lansard M, Panserat S, Plagnes-Juan E, Seiliez I, Skiba-Cassy S. Integration of insulin and amino acid signals that regulate hepatic metabolism-related gene expression in rainbow trout: role of TOR. Amino Acids 2010; 39:801-10; PMID:20213441; http://dx.doi.org/10.1007/s00726-010-0533-3
- Lin CW, Zhang H, Li M, Xiong X, Chen X, Dong XC, Yin XM. Pharmacological promotion of autophagy alleviates steatosis and injury in alcoholic and non-alcoholic fatty liver conditions in mice. J Hepatol 2013; 58:993-9; PMID:23339953; http://dx.doi.org/10.1016/j.jhep.2013.01.011
- Singh R, Kaushik S, Wang Y, Xiang Y, Novak I, Komatsu M, Tanaka K, Cuervo AM, Czaja MJ. Autophagy regulates lipid metabolism. Nature 2009; 458:1131-5; PMID:19339967; http://dx.doi.org/10.1038/nature07976
- Owen OE, Reichard GA, Jr., Patel MS, Boden G. Energy metabolism in feasting and fasting. Adv Exp Med Biol 1979; 111:169-88; PMID:371355; http://dx.doi.org/10.1007/978-1-4757-0734-2_8
- Bruhat A, Jousse C, Wang XZ, Ron D, Ferrara M, Fafournoux P. Amino acid limitation induces expression of CHOP, a CCAAT/enhancer binding protein-related gene, at both transcriptional and post-transcriptional levels. J Biol Chem 1997; 272:17588-93; PMID:9211906; http://dx.doi.org/10.1074/jbc.272.28.17588
- Ohoka N, Yoshii S, Hattori T, Onozaki K, Hayashi H. TRB3, a novel ER stress-inducible gene, is induced via ATF4-CHOP pathway and is involved in cell death. EMBO J 2005; 24:1243-55; PMID:15775988; http://dx.doi.org/10.1038/sj.emboj.7600596
- Sok J, Wang XZ, Batchvarova N, Kuroda M, Harding H, Ron D. CHOP-Dependent stress-inducible expression of a novel form of carbonic anhydrase VI. Mol Cell Biol 1999; 19:495-504; PMID:9858573; http://dx.doi.org/10.1128/MCB.19.1.495
- Su N, Kilberg MS. C/EBP homology protein (CHOP) interacts with activating transcription factor 4 (ATF4) and negatively regulates the stress-dependent induction of the asparagine synthetase gene. J Biol Chem 2008; 283:35106-17; PMID:18940792; http://dx.doi.org/10.1074/jbc.M806874200
- Wang XZ, Kuroda M, Sok J, Batchvarova N, Kimmel R, Chung P, Zinszner H, Ron D. Identification of novel stress-induced genes downstream of chop. EMBO J 1998; 17:3619-30; PMID:9649432; http://dx.doi.org/10.1093/emboj/17.13.3619
- B'Chir W, Chaveroux C, Carraro V, Averous J, Maurin AC, Jousse C, Muranishi Y, Parry L, Fafournoux P, Bruhat A. Dual role for CHOP in the crosstalk between autophagy and apoptosis to determine cell fate in response to amino acid deprivation. Cell Signal 2014; 26:1385-91; PMID:24657471; http://dx.doi.org/10.1016/j.cellsig.2014.03.009
- B'Chir W, Maurin AC, Carraro V, Averous J, Jousse C, Muranishi Y, Parry L, Stepien G, Fafournoux P, Bruhat A. The eIF2alpha/ATF4 pathway is essential for stress-induced autophagy gene expression. Nucleic Acids Res 2013; 41:7683-99; PMID:23804767; http://dx.doi.org/10.1093/nar/gkt563
- Rouschop KM, van den Beucken T, Dubois L, Niessen H, Bussink J, Savelkouls K, Keulers T, Mujcic H, Landuyt W, Voncken JW, et al. The unfolded protein response protects human tumor cells during hypoxia through regulation of the autophagy genes MAP1LC3B and ATG5. J Clin Invest 2010; 120:127-41; PMID:20038797; http://dx.doi.org/10.1172/JCI40027
- Zhou J, Tan SH, Nicolas V, Bauvy C, Yang ND, Zhang J, Xue Y, Codogno P, Shen HM. Activation of lysosomal function in the course of autophagy via mTORC1 suppression and autophagosome-lysosome fusion. Cell Res 2013; 23:508-23; PMID:23337583; http://dx.doi.org/10.1038/cr.2013.11
- Hotamisligil GS. Endoplasmic reticulum stress and the inflammatory basis of metabolic disease. Cell 2010; 140:900-17; PMID:20303879; http://dx.doi.org/10.1016/j.cell.2010.02.034
- Kaushik S, Singh R, Cuervo AM. Autophagic pathways and metabolic stress. Diabetes Obes Metab 2010; 12 Suppl 2:4-14; PMID:21029294; http://dx.doi.org/10.1111/j.1463-1326.2010.01263.x
- Seiliez I, Gabillard JC, Skiba-Cassy S, Garcia-Serrana D, Gutierrez J, Kaushik S, Panserat S, Tesseraud S. An in vivo and in vitro assessment of TOR signaling cascade in rainbow trout (Oncorhynchus mykiss). Am J Physiol Regul Integr Comp Physiol 2008; 295:R329-35; PMID:18434442; http://dx.doi.org/10.1152/ajpregu.00146.2008
- Bradford MM. A rapid and sensitive method for the quantitation of microgram quantities of protein utilizing the principle of protein-dye binding. Anal Biochem 1976; 72:248-54; PMID:942051; http://dx.doi.org/10.1016/0003-2697(76)90527-3
- Polakof S, Panserat S, Craig PM, Martyres DJ, Plagnes-Juan E, Savari S, Aris-Brosou S, Moon TW. The metabolic consequences of hepatic AMP-kinase phosphorylation in rainbow trout. PLoS One 2011; 6:e20228; PMID:21625448; http://dx.doi.org/10.1371/journal.pone.0020228
- Belghit I, Skiba-Cassy S, Geurden I, Dias K, Surget A, Kaushik S, Panserat S, Seiliez I. Dietary methionine availability affects the main factors involved in muscle protein turnover in rainbow trout (Oncorhynchus mykiss). Br J Nutr 2014; 112:493-503; PMID:24877663; http://dx.doi.org/10.1017/S0007114514001226
- Seiliez I, Panserat S, Lansard M, Polakof S, Plagnes-Juan E, Surget A, Dias K, Larquier M, Kaushik S, Skiba-Cassy S. Dietary carbohydrate-to-protein ratio affects TOR signaling and metabolism-related gene expression in the liver and muscle of rainbow trout after a single meal. Am J Physiol Regul Integr Comp Physiol 2011; 300:R733-43; PMID:21209382; http://dx.doi.org/10.1152/ajpregu.00579.2010
- Seiliez I, Gutierrez J, Salmeron C, Skiba-Cassy S, Chauvin C, Dias K, Kaushik S, Tesseraud S, Panserat S. An in vivo and in vitro assessment of autophagy-related gene expression in muscle of rainbow trout (Oncorhynchus mykiss). Comp Biochem Physiol B Biochem Mol Biol 2010; 157:258-66; PMID:20601058; http://dx.doi.org/10.1016/j.cbpb.2010.06.011
- Pfaffl MW, Horgan GW, Dempfle L. Relative expression software tool (REST) for group-wise comparison and statistical analysis of relative expression results in real-time PCR. Nucleic Acids Res 2002; 30:e36; PMID:11972351; http://dx.doi.org/10.1093/nar/30.9.e36
