
ABSTRACT
Understanding the role of autophagy in cancer has been limited by the inability to measure this dynamic process in formalin-fixed tissue. We considered that 3-dimensional models including ex vivo tumor, such as we have developed for studying mesothelioma, would provide valuable insights. Using these models, in which we could use lysosomal inhibitors to measure the autophagic flux, we sought a marker of autophagy that would be valid in formalin-fixed tumor and be used to assess the role of autophagy in patient outcome. Autophagy was studied in mesothelioma cell lines, as 2-dimensional (2D) monolayers and 3-dimensional (3D) multicellular spheroids (MCS), and in tumor from 25 chemonaive patients, both as ex vivo 3D tumor fragment spheroids (TFS) and as formalin-fixed tissue. Autophagy was evaluated as autophagic flux by detection of the accumulation of LC3 after lysosomal inhibition and as autophagy initiation by detection of ATG13 puncta. We found that autophagic flux in 3D, but not in 2D, correlated with ATG13 positivity. In each TFS, ATG13 positivity was similar to that of the original tumor. When tested in tissue microarrays of 109 chemonaive patients, higher ATG13 positivity correlated with better prognosis and provided information independent of known prognostic factors. Our results show that ATG13 is a static marker of the autophagic flux in 3D models of mesothelioma and may also reflect autophagy levels in formalin-fixed tumor. If confirmed, this marker would represent a novel prognostic factor for mesothelioma, supporting the notion that autophagy plays an important role in this cancer.
Introduction
Macroautophagy (hereafter referred to as autophagy), a degradation process that eliminates dysfunctional proteins and organelles and thereby provides energy and amino acids, may play an important role in cancer, although its actual role is still unclear. Autophagy can play a dual role and both inhibition and stimulation of autophagy have been discussed as potential approaches in cancer therapy.Citation1-7 Some of the confusion about the role of autophagy in cancer may arise from the difficulties in measuring the dynamic process of autophagy in formalin-fixed tumor specimens.Citation2,8,9 The analysis of autophagy in tumor samples will be necessary to understand the level of autophagy at basal conditions and after modulation and perhaps to determine which strategy, either autophagy inhibition or stimulation, would be a more effective therapeutic approach. Currently, autophagy is most accurately measured by determining the autophagic degradation activity, referred to as autophagic flux, which requires inhibition of lysosomal proteases, something that clearly cannot be performed in fixed clinical samples.Citation2,8-12 The study of autophagy in cancer would be advanced by finding static markers in fixed tumor that correlate with the dynamic process of autophagy.
Thus, there is a need for models that provide useful information about autophagy in tumor. In this regard, 3D cultures of cancer cell lines are increasingly used as clinically relevant models for the study of autophagy.Citation13-15 Nevertheless, the findings in in vitro 3D models are limited without a correlation to the autophagic flux in actual tumor. We considered that an ex vivo 3D tumor model in which lysosomal inhibitors could be used ex vivo would enable measurement of autophagic flux in actual tumor. Knowing the autophagic flux in ex vivo tumor, we could then seek accurate markers that could be applied to fixed tumor samples.
In our work in malignant pleural mesothelioma, a highly chemoresistant solid tumor, we have established an ex vivo 3D model of living tumor, the tumor fragment spheroid (TFS) model,Citation16 which has been useful for studying tumor biology.Citation17-19 Here, we measured the levels of autophagy in 2D monolayers and in our 3D models, including ex vivo TFS. We then asked whether the levels of autophagic flux, as measured in 3D models, correlated with a static marker of autophagy that could be measured in fixed tumor samples and, if so, whether such a marker would correlate with clinical outcome.
Results
In 3D multicellular spheroids, autophagic flux differs from that measured in 2D
To determine whether autophagy differs in 2D and 3D, we measured the autophagic flux in cell lines grown in both settings. The autophagic flux was determined by inhibiting the degradation function of lysosomes and then measuring the accumulation of lipidated microtubule-associated protein 1 light chain 3 isoform B (LC3B-II), by immunoblotting, or of autophagic vesicles loaded with LC3B-II, by immunofluorescence.Citation9,10 Six malignant pleural mesothelioma cell lines grown as monolayers (2D) or as multicellular spheroids (MCS, 3D) were exposed or not exposed to the lysosomal inhibitor ammonium chloride (NH4+) for 8 h.
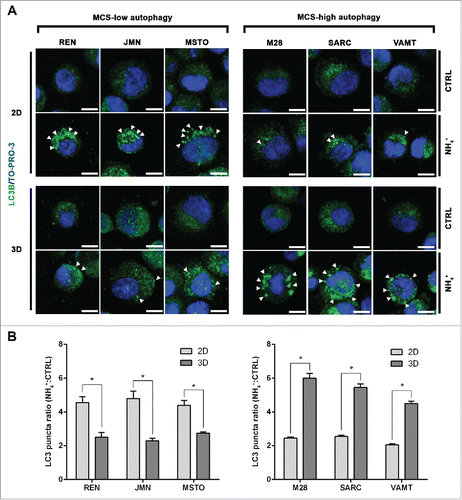
By LC3 immunoblotting (), we found that, for each cell line, the autophagic flux differs between 2D and 3D cultures. The autophagic flux was lower in 3D than in 2D in 3 cell lines (, MCS-low autophagy), and higher in 3D than in 2D in the other 3 (, MCS-high autophagy). The autophagic flux in 3D did not correlate with that in 2D.
Figure 1. In mesothelioma cells, LC3 immunoblotting shows that autophagic flux differs between 2D and 3D cultures. (A) Cells were grown as monolayers (2D) or MCS (3D). Where indicated, the cells were exposed to 10 mM ammonium chloride (NH4+) for 8 h. LC3B expression was assessed by immunoblotting. As a loading control, filters were probed with anti TUBA/α-tubulin antibody. Band intensities were determined by densitometric analysis. The autophagic flux is expressed as a ratio of normalized LC3B-II band intensities after NH4+ to before NH4+ (NH4+:CTRL). A representative immunoblot of 3 independent experiments is shown, with ratios shown below. (B) Bars show the autophagic flux of 2D (light gray) or 3D (dark gray) cultures of the indicated cell lines. Data were obtained from 3 independent experiments, one of which is shown in (A). Asterisks indicate statistically significant differences of autophagic flux between 2D and 3D (P< 0.05). Error bars, SD. The mean LC3-II ratios in 3D are significantly higher in MCS-high autophagy than in MCS-low autophagy cell lines (P < 0.05).

By LC3 immunofluorescence, we verified the levels of autophagic flux in each cell line (). Autophagic vesicles loaded with LC3B-II were counted as LC3 puncta and the ratio between LC3 puncta detected in NH4+-exposed and control unexposed cells is shown in . These findings confirm that autophagy in 3D differs from that in 2D.
Figure 2. In mesothelioma cells, LC3 immunofluorescence confirms that autophagic flux differs between 2D and 3D cultures. (A) Cells were grown as in , trypsinized and cytospun on glass slides. Cells were then fixed and stained for LC3B (green) and nuclei (blue) and imaged by confocal microscopy. Arrowheads indicate LC3 puncta. Representative cells of 2 independent experiments are shown. Scale bars: 10 µm. (B) Bars show the ratio between LC3 puncta counted in cells grown in the presence or absence of 10 mM ammonium chloride (NH4+). Asterisks indicate significantly different LC3 puncta ratios between 2D and 3D (P< 0.05). Error bars, SD. The mean LC3 puncta ratios in 3D are also significantly higher in MCS-high autophagy than in MCS-low autophagy cell lines (P < 0.05).
We considered that some lysosomal inhibitors, including NH4+, may activate autophagy, especially at longer exposures.Citation9 Thus, we repeated the experiment with a second inhibitor and for a shorter duration of exposure. The 6 cell lines grown as 2D or 3D were exposed or not exposed to NH4+ or to hydroxychloroquine (HCQ), as an additional lysosomal inhibitor, for 4 h (Fig. S1). In this experiment, we confirmed the previous results, showing that there are 2 groups of mesothelioma cell lines that exhibit low or high autophagic flux in 3D and that the autophagic flux in 3D does not correlate with that in 2D. The 2 inhibitors, NH4+ and HCQ, led to the same conclusion for each cell line.
In 3D multicellular spheroids, but not in 2D, autophagic flux appears to correlate with the autophagy initiation status (ATG13 puncta)
We next focused on uncovering a marker of autophagy whose static measurement would reflect the autophagic flux in mesothelioma cell lines, allowing assessment of autophagy without the need for lysosomal inhibition. We considered that autophagy proteins involved in the early phases of autophagy would possibly reflect the autophagic flux. In particular, we focused on proteins of the 2 complexes that signal the onset of autophagy: the BECN1/Beclin 1-class III phosphatidylinositol 3-kinase and ULK1 complexes.
The first regulatory complex includes BECN1, which is an autophagy-related protein.Citation9 Moreover, BECN1 expression level correlates with patient outcome in other tumors.Citation20-30 However, we found that BECN1 expression in the 6 mesothelioma cell lines grown as 2D or 3D does not reflect their level of autophagic flux (Fig. S2A).
The second regulatory complex, the ULK1 complex, includes ATG13, which is of pivotal importance to autophagy initiation.Citation31-33 The activity of the ULK1 complex can be assessed by the formation of puncta by its subunits, including ATG13, representing relocation of the complex to the autophagosome, as the earliest event in autophagy initiation.Citation34 Indeed, we recently have found that ATG13 puncta are present in MCS with high autophagy.Citation35 Therefore, we asked whether ATG13 puncta reflect the autophagic flux of the cell lines in either the 2D or 3D setting.
In 2D monolayer cultures of all cell lines, ATG13 puncta were almost undetectable (; 2D) whether or not the cell lines had a high autophagic flux in 2D (see ). We concluded that the autophagy initiation status did not reflect the autophagic flux in 2D.
Figure 3. In mesothelioma cells, ATG13 puncta reflect the autophagic flux only in 3D. Mesothelioma cells were grown as monolayers (2D) on coverslips or as MCS (3D). Spheroid cells were trypsinized and cytospun on glass slides. Cells adherent on cover slips or glass slides were then fixed, stained for ATG13 (green) and nuclei (blue), and imaged by confocal microscopy. Representative ATG13 puncta are indicated by arrowheads. Scale bars: 10 µm.
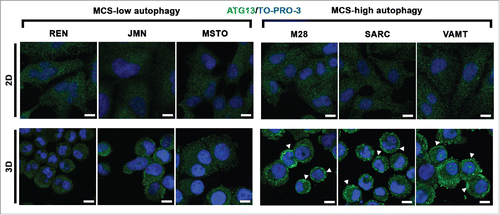
However, in 3D, ATG13 puncta did reflect the autophagic flux. In MCS with low autophagy, ATG13 puncta staining was weak and was seen only in a few cells (; 3D, MCS-low autophagy) whereas, in MCS with high autophagy, ATG13 puncta staining was strong and seen in many cells (; 3D, MCS-high autophagy).
Interestingly, the level of ATG13 protein did not reflect the differences seen in ATG13 puncta (Fig. S2A and S2B). Although a difference was found between the low and high autophagy cell lines, the level of ATG13 protein did not differ between 2D and 3D and thus did not reflect the presence of ATG13 puncta nor the autophagic flux. We concluded that ATG13 protein levels remain fairly constant independent of the aggregation of the proteins in puncta and the level of autophagic flux.
Our data suggest that in 3D, but not in 2D, cultures the presence of ATG13 puncta (but not ATG13 protein levels) could identify mesothelioma cells with either low or high autophagic flux at basal conditions, without the need for lysosomal inhibitors.
Because ATG13 puncta did not reflect the high autophagic flux in 2D cultures of the MCS-low autophagy group (; top left, 2D, MCS-low autophagy), we considered that ATG13 puncta formation might be defective in that 2D setting. We therefore repeated the analysis of ATG13 puncta in the 6 mesothelioma cell lines after stimulating autophagy with Earle's balanced salt solution (EBSS). Under these nutrient deprivation conditions, ATG13 puncta were detectable in all the cell lines grown in both 2D and 3D (Fig. S3). In addition, LC3 puncta analysis, performed in 2 cell lines representative of the MCS-low or MCS-high autophagy groups, confirmed that EBSS induced a high autophagic flux both in 2D and 3D (Fig. S4), matching the observation with ATG13 puncta. Thus, the absence of ATG13 puncta in 2D at basal conditions did not represent an inability to form ATG13 puncta but may indicate that, in 2D basal conditions, autophagy initiation does not involve ATG13.
We conclude that, in 3D, the presence of ATG13 puncta is useful to identify mesothelioma cells with either low or high autophagic flux, during both basal and stimulated autophagy. In 2D, on the other hand, ATG13 puncta reflect the presence of cells with high autophagic flux only after a strong stimulation of autophagy.
In ex vivo tumor fragment spheroids, autophagic flux was assessed by the percentage of cells containing LC3 puncta and reveals tumors with either low or high autophagy
Building on our measurements of autophagic flux in cell lines, we now aimed to measure autophagic flux in ex vivo tumor itself, using tumor fragment spheroids (TFS) generated from tumor resected from 25 chemonaive MPM patients. In TFS, where it was not possible to determine mesothelioma-cell specific LC3 accumulation by immunoblotting, we relied on immunofluorescence, in which mesothelioma cells were identified by KRT/cytokeratin staining. Because the LC3 puncta overlapped each other in the tissue sections and could not be individually counted, we counted the percentage of KRT/cytokeratin-positive cells containing LC3 puncta (LC3B-II-positive MPM cells x100/total MPM cells). TFS were grown in the presence or absence of NH4+ and the percentage of LC3-positive MPM cells was measured.
In TFS not exposed to NH4+, few cells with LC3 puncta were detected (; CTRL). In TFS exposed to NH4+, the percentage of LC3-positive MPM cells in the TFS increased to different degrees identifying 2 groups: approximately half the TFS had a small increase, defining a TFS-low autophagy group, and the other half had a large increase, defining a TFS-high autophagy group (; NH4+). On average, the percentage of LC3-positive cells increased by less than 2-fold (from 1.7% to 2.9% of MPM cells) in the TFS-low autophagy and by 8-fold (from 2.5% to 20.8% of MPM cells) in the TFS-high autophagy ().
Figure 4. In tumor fragment spheroids, LC3 immunofluorescence indicates low or high levels of autophagy. TFS were generated from tumor biopsies obtained from 25 chemonaive MPM patients and grown in the presence or absence of ammonium chloride (NH4+) for 12 h. TFS were then fixed, embedded in paraffin, stained for LC3B (green), KRT/cytokeratin to identify mesothelioma cells (red), and nuclei (blue), and imaged by confocal microscopy. (A) Bars represent the mean percentage of LC3-positive MPM cells measured in TFS grown in the presence (gray bars) or absence (white bars) of NH4+. Error bars, SEM (B) Representative images of TFS with either low (TFS #8) or high (TFS #2) autophagy levels are shown, with the percentage of mesothelioma cells with LC3 puncta (LC3-positive MPM cells) indicated in parentheses. Zoom-in view of the region in the dashed box shows representative cells with LC3 puncta (arrowhead). Scale bars: 10 µm.
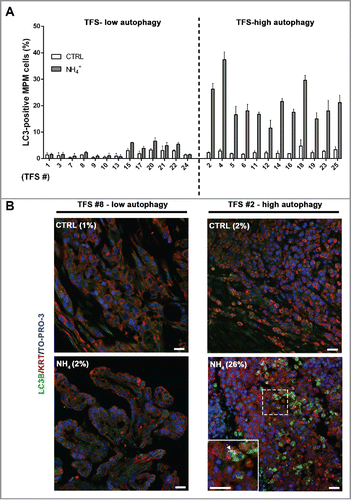
Table 1. In tumor fragment spheroids, LC3-positivity is shown at baseline and after ammonium chloride (NH4+) treatment. The percentages of LC3-positive MPM cells are shown for low (A) or high (B) autophagy TFS grown in the presence (NH4+) or absence (CTRL) of ammonium chloride. For each TFS, data are expressed as mean percentages. Parentheses, SEM. The difference in the percentage of LC3B-positive MPM cells following exposure to ammonium chloride (NH4+-CTRL) is also shown for each TFS.
We note that, in each TFS, even in the high autophagy group, there were mesothelioma cells that did not show LC3 puncta after exposure to NH4+. We concluded that 2 populations of mesothelioma cells, with either undetectable or detectable autophagic flux, existed in different percentages in each TFS.
Our data show that ex vivo mesothelioma can have either a low or high level of autophagy, as determined by the percentage of tumor cells that demonstrate autophagy within the TFS. These measurements represent the first time that autophagy has been measured in living mesothelioma tumor grown ex vivo.
In ex vivo tumor fragment spheroids, autophagic flux correlates with the autophagy initiation status (ATG13 puncta)
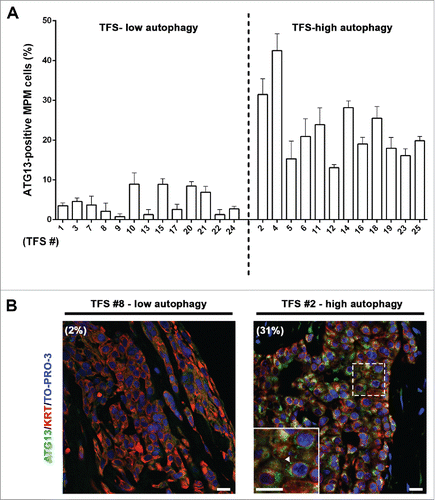
To determine whether ATG13 would be a useful marker of autophagic flux in ex vivo tumor, as in 3D MCS, we measured the percentage of MPM cells containing ATG13 puncta in TFS not exposed to NH4+. In the TFS previously identified as having low autophagy (), we observed a low percentage of mesothelioma cells with ATG13 puncta (ATG13-positive MPM cells) (; TFS-low autophagy) and, in the TFS previously identified as having high autophagy, we found a high percentage of ATG13-positive cells (; TFS-high autophagy).
Figure 5. In tumor fragment spheroids, ATG13 puncta analysis reflects the low or high levels of autophagy. The TFS shown in and not exposed to ammonium chloride (NH4+) were fixed, embedded in paraffin, stained for ATG13 (green), KRT/cytokeratin to identify mesothelioma cells (red) and nuclei (blue), and imaged by confocal microscopy. (A) Bars represent the mean percentage of ATG13-positive MPM cells for the TFS determined in to be low or high ATG. Error bars, SEM (B) Representative images of TFS with either low autophagy (TFS #8) or high autophagy (TFS #2) levels are shown, with the percentage of mesothelioma cells with ATG13 puncta (ATG13-positive MPM cells) indicated in parentheses. Zoom-in view of the region in the dashed box shows representative cells with ATG13 puncta (arrowhead). Scale bars: 10 µm.
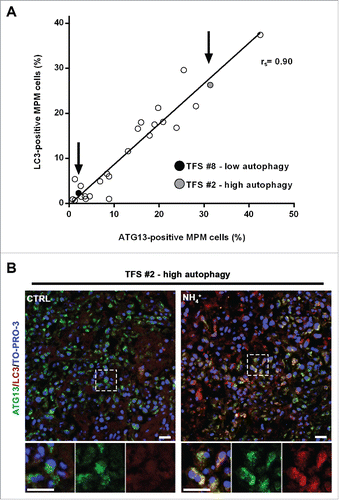
Notably, the percentages of ATG13-positive MPM cells (at baseline) correlated with those of LC3-positive MPM cells (after lysosomal inhibition) (). We considered whether the same cells were positive for both ATG13 and LC3. Double staining for ATG13 and LC3A/B was then performed in a TFS with high autophagy, grown in the presence or absence of NH4+. As shown in , we observed that, without NH4+, ATG13 staining was seen but no LC3. After NH4+, the LC3 staining increased and, except for a few cells that stained for only one marker, LC3 staining was seen in the cells that also showed ATG13 puncta. The colocalization indicated that, at a cellular level, autophagy initiation corresponded with autophagic flux.
Figure 6. In tumor fragment spheroids, autophagy initiation correlates with the autophagic flux. (A) TFS exposed to NH4+ were stained for LC3 and the same TFS not exposed to NH4+ were stained for ATG13; both were stained for KRT/cytokeratin to identify the mesothelioma cells. The correlation plot of the percentages of LC3-positive MPM cells (y axis, TFS grown in the presence of NH4+) relative to that of ATG13-positive MPM cells (x axis, TFS grown without NH4+) is shown. Arrows identify the position of the representative low autophagy TFS (#8, black circle) and high autophagy TFS (#2, gray circle), previously shown on . Spearman rank correlation (rs), 0.8997; P (2-tailed)< 0.0001. (B) TFS grown in the presence or absence of NH4+ for 12 h were stained for ATG13 (green), LC3A/B (red), and nuclei (blue) and imaged by confocal microscopy. ATG13 and LC3A/B double immunostaining images of a representative TFS with high autophagy levels (TFS #2) grown in the presence (NH4+) or absence of the lysosomal inhibitor (CTRL) are shown. Zoom-in views of the regions in the dashed boxes are shown for representative cells. Scale bars: 10 µm.
In ex vivo tumor fragment spheroids, autophagy initiation (ATG13 puncta) correlates with that in the original formalin-fixed tumors
To test whether the levels of autophagy initiation measured in the TFS matched those of the original tumors from which they were generated, we performed ATG13 immunostaining in sections of the tumors used to generate the TFS we studied. Our results show that the percentage of MPM cells with ATG13 puncta in the TFS reflected that of the original tumors ().
Figure 7. In tumor fragment spheroids, autophagy initiation correlates with that of the original tumors. Fixed samples of the original tumors used to generate the analyzed 25 TFS were stained for ATG13 (green), KRT/cytokeratin (red) and nuclei (blue) and imaged by confocal microscopy. (A) The correlation plot of the percentages of ATG13-positive MPM cells measured in formalin-fixed MPM clinical samples (y axis) relative to those measured in the respective TFS (x axis) is shown. Arrows identify the position of the representative low autophagy (MPM or TFS #8, black circle) and high autophagy (MPM or TFS #2, gray circle) tumor, previously shown in . Spearman rank correlation (rs), 0.9253; P (2-tailed)< 0.0001. (B) Representative images of MPM sections corresponding to TFS with either low autophagy (MPM #8) or high autophagy (MPM #2) levels are shown, with the percentage of mesothelioma cells with ATG13 puncta (ATG13-positive MPM cells) indicated in parentheses. Zoom-in view of the region in the dashed box shows representative cells with ATG13 puncta (arrowhead). Scale bars: 10 µm.
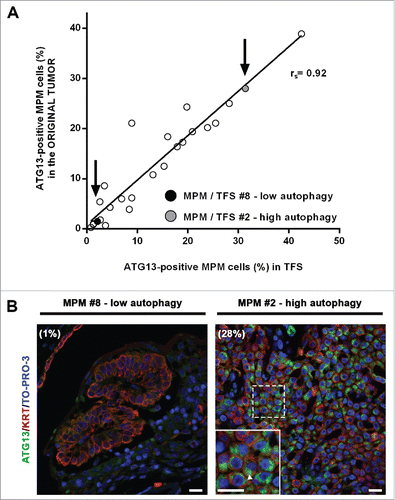
Thus, for each individual tumor, the autophagy initiation status of the ex vivo TFS, even after at least 2 wk in culture, closely resembles the autophagy initiation status of the original tumor, supporting the notion that the ex vivo TFS model is useful for studying autophagy in mesothelioma.
In patients with mesothelioma, ATG13, the marker of autophagy initiation, correlates with clinical outcome
To learn whether ATG13 puncta positivity could reveal useful information about tumors in patients with mesothelioma, we measured the percentage of cells with ATG13 puncta in tissue microarrays comprising clinical samples from a total of 109 MPM patients who had undergone surgical resection without prior chemotherapy. Overall, the median percentage of ATG13-positive MPM cells detected in our patient cohort was 8% (range 0% to 32%; inter-quartile range 2% to 19%). To assess the relationship of ATG13 positivity to patient outcome, we first compared Kaplan-Meier estimates of overall survival and time to recurrence following surgery among 4 groups comprising the ATG13 quartiles. An increasing proportion of tumor cells with punctate ATG13 staining was associated with incrementally improved survival functions. Next, we used Cox regression to determine the optimal cutpoint for a categorical parameter representing “high” and “low” levels of ATG13 positivity. We compared relative risk determined for death and recurrence at each of 18 candidate cutpoints defined by segmenting the inter-quartile range in 1% increments. Whereas the univariate hazard ratios associated with all candidate cutpoints within the interquartile range were similar for both overall survival (0.51 to 0.64) and time to recurrence (0.39 to 0.58), we selected the 6% cutpoint because it optimally minimized hazard ratios for both endpoints (univariate and with correction for tumor histology), and divided the cohort fairly evenly, with 58% of patients categorized high and 42% low ATG13 positivity ().
Figure 8. In formalin-fixed tissue microarray with tumor from 109 patients, ATG13 correlates with clinical outcome. (A) Cox regression analyses, univariate or with correction for the tumor histology, for death (OS) or recurrence (TTR) are shown. Hazard ratios (HR) with 95% confidence intervals are shown at 18 candidate ATG13% cutpoints. M, median percentage of ATG13-positive MPM cells. C, selected cutpoint (6%). (B) Kaplan-Meier curves are shown for overall survival (OS) and time to recurrence (TTR) at the 6% ATG13-positive MPM cells cutpoint selected in (A). (C) Correlation analysis of autophagy levels and known prognostic factors. ATG13 did not correlate with age, nodal status, gender or tumor volume, anemia, resectability, surgical procedure, adjuvant therapy, or TNM stage; high ATG13 positivity was more common in epithelioid tumors. (D) Multivariate analysis adjusted for the effect of epithelioid histology shows that ATG13 positivity remains significantly prognostic for TTR (P = 0.0017) and for OS (P = 0.0166), even after adjusting for the effect of histology. When conservatively corrected for the repeated measures required to establish the cutpoint, ATG13 positivity remains significantly prognostic for TTR (Bonferroni corrected P = 0.0306) but not for OS (corrected P = 0.2988).
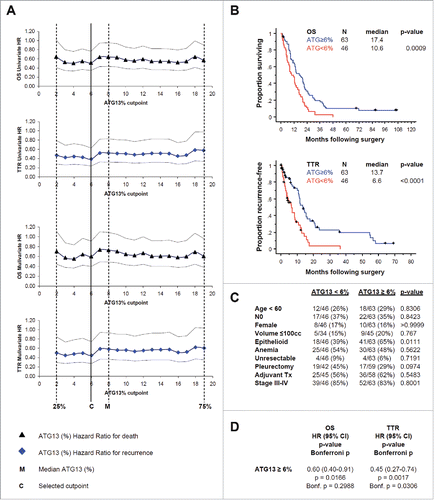
At the 6% cutpoint, median overall survival was significantly longer for patients with high ATG13 positivity (≥6% ATG13-positive tumor cells; 17.4 mo) than for those with low positivity (<6 % ATG13-positive tumor cells; 10.6 mo) (P = 0.0009; Bonferroni corrected P=0.0162). Time to recurrence was also significantly longer for patients with high ATG13 positivity (13.7 mo) than for low positivity (6.6 mo) (P < 0.0001; Bonferroni corrected P < 0.0018) ().
ATG13 positivity was more commonly low among non-epithelioid tumors (P = 0.01), but was not correlated with other known prognostic factors including age, lymph node status, gender, tumor volume, anemia, resectability, surgical procedure, adjuvant therapy, or TNM stage (). To address the possibility that histology was driving the outcome differences observed with ATG13, we performed a multivariate analysis adjusting for histology. In this analysis, after adjusting for histology, ATG13 positivity remained significantly prognostic for overall survival and time to recurrence (). When applying a conservative correction for the multiple comparisons required to establish the cutpoint, ATG13 positivity level remained significantly prognostic for time to recurrence but not for overall survival ().
We conclude that the autophagy initiation, as assessed by the percentage of cells with ATG13 puncta, correlated with clinical outcome of patients with mesothelioma and provided prognostic information independent of its association with epithelioid histology, indicating that higher autophagy initiation is associated with better outcome. However, we acknowledge that validation of the selected cutpoint and effect sizes will be required in additional patient cohorts, given the known pitfalls of dichotomizing continuous covariates.Citation36
Discussion
Understanding the role of autophagy in cancer has proven to be challenging in part because of the difficulties in measuring it.Citation2,8-11 In particular, new methods are needed to measure autophagy in formalin-fixed tumor samples because the evaluation of this dynamic process using static measurements can be misleading. According to recent guidelines, in order to confirm the level of autophagy, multiple markers of the autophagic process should be measured using different assays, but particularly with an assay of autophagic flux, which represents the overall autophagic degradation activity.Citation9,12 However, the measurement of autophagic flux, which requires inhibition of the process and detection of the accumulation of LC3, cannot be performed in fixed tumors.Citation2,8,9 In searching for a useful model, some investigators have turned to 3D models, which may exhibit the same autophagic status as that found in tumor,Citation13-15 perhaps because the 3D environment may acquire the nutrient and metabolic stress faced by the actual tumor. Here, we used 3D models of mesothelioma, especially ex vivo tumor cultures, to measure autophagic flux and then leveraged that information to find a static marker of autophagy that correlated with the autophagic flux. With this novel marker, we were able to assess the level of autophagy in patient tumors and to show for the first time that higher autophagy in mesothelioma correlates with better clinical outcome.
There has been an active effort to find a useful marker of autophagy in fixed tumor across many tumor types. In a search of the literature, we note more than 20 recent studies in which markers were sought in formalin-fixed tumor tissue and were used to correlate with patient outcome, including in breast cancer, colon cancer, melanoma, and ovarian cancer.Citation13,20-30,37-47 These markers (e.g. LC3, BECN1, and ULK1) were mostly studied by immunohistochemistry in formalin-fixed tumor without the ability to validate them by inhibiting the autophagic process to measure autophagic flux. In some cases, the high expression of a marker correlated with poor prognosis; in others, high expression correlated with good prognosis. Without the ability to measure the autophagic flux in living tumor tissue, these studies have generally interpreted high expression of a protein as indicating a high autophagic flux, although, as has been noted,Citation44 high expression could also mean an impaired autophagy, with accumulation of the upstream marker.
In this study, our novel contribution is the use of 3D models to measure autophagic flux in order to find a static marker that would represent that flux and could then be used for measurement of autophagy in formalin-fixed tissue. We first turned to the mesothelioma cell lines, in 2D and 3D, and measured autophagic flux. Interestingly, the flux for each cell line was different in 2D and in 3D, leaving us to wonder which was the more clinically relevant and useful model. When we tested for a static marker in 2D or 3D cell cultures, neither the protein levels of BECN1 nor of ATG13 (Fig. S2) nor the levels of LC3B-II at baseline () correlated with the autophagic flux. However, ATG13 puncta, which are a marker of ongoing autophagy initiation,Citation32,34,48 appeared to correlate with the measured autophagic flux, but only in our 3D multicellular spheroids, not in 2D. Because of this and our previous work,Citation35 we decided to expand our study of autophagy in 3D models by including ex vivo tumor. In the ex vivo tumor, we could actually measure autophagic flux and show that the flux correlated well with the percentage of mesothelioma cells with ATG13 puncta in the matching formalin-fixed tumor. Then, we tested this new static marker in a tissue microarray of formalin-fixed tumor of 109 patients and showed a strong and independent correlation of ATG13 puncta with clinical outcome, which encourages us that this experimental approach is worthwhile. This is the first time in any tumor, to our knowledge, that a marker was validated across several models, from the 3D in vitro to 3D ex vivo to paraffin-embedded formalin-fixed tumor. By the use of these complementary models, we found that ATG13 puncta reflect the autophagic flux and, most importantly, correlate with the outcome of patients with mesothelioma, especially with time to recurrence, a highly relevant clinical endpoint.Citation49 We cannot say whether this marker would be useful for other tumors; however, we propose that ATG13 could be tested along with other proteins involved in the early phases of autophagy. The use of ex vivo tumor, if available, could help in discovery and validation of putative markers.
In addition to an intertumoral heterogeneity, autophagy was also found to show intratumoral heterogeneity. Indeed, in other immunochemical studies of autophagy markers in tumor, heterogeneity of staining has been described.Citation20-22,25,26,28,37,40-46 Here we can confirm, at baseline and then after the use of lysosomal inhibitors, that heterogeneity of autophagy within the mesothelioma tumor is a consistent finding. In every tumor examined, the autophagy markers (LC3 or ATG13 puncta) were present in a minority of mesothelioma cells, while the majority appeared to show little to no expression. We interpret this to mean that, in the ATG13-positive cells, autophagy is activated and not impaired, because LC3 accumulates as expected after lysosomal inhibition. In the ATG13-negative cells, autophagy is not activated and further investigation is required to learn whether autophagy can be stimulated in these cells, as it was in the cell lines by EBSS. The cells do not seem to differ in phenotype although they may differ in other ways such as the degree of proliferation or metabolic stress or the level of intracellular signaling. These cells could possibly represent stem-like or tumor-initiating cells, which are generally thought to have elevated levels of autophagy,Citation50 and which are being studied in mesothelioma.Citation51,52 Genetic or epigenetic heterogeneity could be responsible and thus could account for the finding that the derived TFS maintain the same percentage of ATG13 positivity as in the original tumor. Although the reasons are still to be uncovered, the intriguing aspect is that the percentage of ATG13-positive mesothelioma cells gives us novel information about this tumor by identifying 2 groups of patients with mesothelioma with a significantly different clinical outcome.
For mesothelioma, this is the first study to show that autophagy correlates with outcome and to identify a marker, ATG13, which provides prognostic information independent of the major known prognostic factors such as age, node status, gender, tumor volume and histology. The prognostic information may derive from the autophagy itself or from an underlying difference in the tumor that is driving the autophagy. Although these findings will need to be confirmed in additional cohorts of patients, we suggest that ATG13 holds promise as a new and independent marker for mesothelioma. And, because one cannot directly measure the autophagic flux in the fixed tumor, we propose that confirmation of ATG13 puncta as a static marker of autophagic flux will require correlation with other static markers in fixed tumor and comparing those to the autophagic flux in the matching ex vivo tumor.
Interestingly, our findings indicate that a higher autophagy initiation status correlates with better clinical outcome. Based on the current views of autophagy as having a dual role,Citation1,53-57 both as a prosurvival and a tumor-suppressive process, we can speculate on possible reasons for this correlation. On the one hand, autophagy may be acting in a tumor-suppressive role, by playing a cytotoxic role during cancer therapy,Citation56,58,59 or by activating the immune system.Citation28 On the other hand, autophagy could be acting in a survival role, as suggested in studies of in vitro mesothelioma by our group.Citation35,60 In this survival role, autophagy could be activated by and reflect underlying stresses in the tumor. Such stresses, such as nutrient deficiency, hypoxia, or uncontrolled proliferation, could render the tumor more sensitive to therapy and help explain why this group of patients has a better outcome. Thus, autophagy could be either a mechanism or a marker of better outcome and it will take further studies employing these models to clarify its role in this tumor.
In conclusion, we have used 3D models of mesothelioma to identify a marker of autophagy that in turn has prognostic value in a group of patients with mesothelioma. Our hope is to use these models to explore the role of autophagy in this tumor.
Materials and methods
Reagents and antibodies
Unless otherwise specified, analytical grade chemicals were from Sigma-Aldrich Corp. The following primary antibodies were employed in immunofluorescence or immunoblotting studies: rabbit monoclonal anti-ATG13 (Cell Signaling Technology, 13468), mouse monoclonal anti-BECN1/Beclin 1 (BD Biosciences, 612113), mouse monoclonal anti-KRT/cytokeratin clones AE1/AE3 (Dako North America, M3515), rabbit monoclonal anti-LC3B (Cell Signaling Technology, 3868), mouse monoclonal anti-LC3A/B (MBL Medical & Biological Laboratories, M152–3), and mouse monoclonal anti-TUBA/α-tubulin (Sigma-Aldrich, T6074). The following secondary antibodies were employed in immunoblotting: horseradish peroxidase-conjugated goat anti-mouse IgG (Bio-Rad, 170–6516), horseradish peroxidase-conjugated goat anti-rabbit IgG (Bio-Rad, 170–6515). The following secondary antibodies or fluorescent dyes were employed in immunofluorescence: Alexa Fluor 546 goat anti-rabbit IgG (Life Technologies, A11010), biotinylated sheep anti-mouse IgG (GE Healthcare, RPN1001V ), NeutrAvidin Oregon Green 488 conjugate (Life Technologies, A6374), and TOPRO-3 iodide (Life Technologies, T3605).
Mesothelioma cell lines
Human mesothelioma cell lines M28, REN, SARC, VAMT, JMN and MSTO-211H were grown from pleural liquid or tumor and originally obtained from colleagues or ATCC.Citation35 They were all confirmed as mesothelial in origin by staining for mesothelioma markers (CALB2/calretinin, WT1) and negatively for other markers not seen in mesothelioma (TTF1). All cells were confirmed to be negative for mycoplasma every 2 mo by PCR analysis as previously described.Citation61
Monolayer cultures and lysosomal inhibition
Human mesothelioma cell lines were cultured under standard conditions (37°C, 5% CO2) in Dulbecco's modified Eagle's medium supplemented with 10% fetal bovine serum and 1% penicillin-streptomycin solution. For study in parallel with MCS (see below), 3.2×10⁵ cells were plated on 60-mm Petri dishes for 24 h. Then, for the next 24 h, the cells received fresh medium and, for the last 4 h or 8 h, where indicated, exposed to 10 mM NH4+ or 20 µM HCQ. NH4+ and HCQ are lysosomotropic compounds that act as weak bases increasing the lysosomal pH and, in turn, indirectly inhibiting the lysosomal proteases and the degradation of LC3-II in the autolysosomes. Note: Prolonged exposure to lysosomal alkalyzers, including NH4+, may result in the simultaneous inhibition of the last phase of autophagy and upregulation of autophagy.Citation9 Thus, to measure the levels of autophagy, MCS and TFS have been exposed to NH4+ for no longer than 8 h and 12 h, respectively; a minimum of 12 h incubation has been suggested for ex vivo studies of autophagy.Citation9
Spheroid generation and lysosomal inhibition
Multicellular spheroids. MCS were generated in non-adsorbent round-bottomed 96-well plates, as previously described.Citation62 Briefly, 96-well plates were coated with a 5 mg/ml solution of polyHEMA (Sigma-Aldrich, P3932) in 95% ethanol and dried at 37°C for 48 h. Plates were sterilized with ultraviolet light for 30 min before use. 104 cells were added to each well and plates are centrifuged at 800 g for 5 min to bring the cells into contact at the bottom of each well. The plates were then placed in a 37°C humidified incubator with 5% CO2 for 24 h to allow spheroids to form. For the next 24 h, MCS (n = 32) were transferred to each well of a polyHEMA-coated 12-well plate, given fresh media and, for the last 4 or 8 h, where indicated, exposed to 10 mM NH4+ or 20 µM HCQ.
Tumor fragment spheroids. TFS were generated as previously described,Citation16 from fresh tumor specimens resected from chemonaive MPM patients (n = 25) by extrapleural pneumonectomy or pleurectomy procedures performed at Brigham and Women's Hospital in Boston, MA, USA. First, pieces of approximately 0.5 mm3 were cut from 3 to 5 tumor sections of each patient, fixed in 10% formalin, embedded in paraffin and processed for immunofluorescence staining as described below. Then, for ex vivo spheroid cultures, tumor tissue was diced finely with scalpels to pieces smaller than 1 mm in diameter. These TFS were cultured in 100 mm Petri dishes coated with 0.8% Noble agar (Sigma-Aldrich, A5431) in Dulbecco's modified Eagle's medium supplemented with 5% fetal bovine serum and 1% penicillin-streptomycin solution for 2 or 3 wk. Then, for the study of autophagy, the TFS were studied for 24 h. At the start of the 24 h period, TFS (20 to 30) were transferred to each well of a polyHEMA-coated 24-well plate, exposed to fresh medium and, for the last 12 h, where indicated, exposed to 10 mM NH4+.
Immunoblotting
Monolayers or MCS were washed twice with cold phosphate-buffered saline (DPBS; HyClone, SH30028). Cells were harvested in RIPA buffer (1% Nonidet P-40 [Sigma-Aldrich, 74385], 0.5% sodium deoxycholate [Sigma-Aldrich, 30970], 1% SDS [Sigma-Aldrich, L3771]) supplemented with protease and phosphatase inhibitor cocktail (Thermo Scientific, 78442) and homogenized using an ultrasonic cell disruptor (Fisher Scientific). Protein concentration was assessed with DC Protein Assay (Bio-Rad, 500–0111) and equal amounts of protein (30 μg of total cell homogenates) were separated by SDS-PAGE and transferred onto a PVDF membrane (Bio-Rad, 162–0177). After blocking with 5% nonfat milk (Santa Cruz Biotechnology, sc-2324), the filter was probed with designated primary and secondary antibodies and developed with enhanced chemiluminescence substrate (Thermo Scientific, 34080). Bands were imaged and subjected to densitometry using the BioSpectrum imaging system apparatus (UVP LLC, Upland, CA, USA) equipped with the Vision-WorksLS software (UVP LLC). Representative images and data of at least 3 independent experiments are shown.
Immunofluorescence
For all immunofluorescence studies, primary or secondary antibodies and fluorescent dyes were diluted in antibody diluent solution (EMD Millipore, 21544). In each experiment, for LC3 and ATG13 staining, a negative control with the relevant secondary antibody alone was included. Washes (3x) were performed with TBS (Amresco, 0788)-0.1% Tween 20 (Fisher Scientific, BP337) after each antibody incubation. For blocking, slides were incubated with 1% BSA (HyClone, SH30574) in TBS-0.1% Tween 20 for 30 min. For antigen retrieval, slides were incubated in citrate buffer (Sigma-Aldrich, C999) and heated in a pressure cooker for 10 min. For nuclear staining, in the final staining step, all cells were incubated with TO-PRO-3 iodide (1:1000; Life Technologies, 910576) together with the secondary antibodies for 2 h. Coverslips or slides were mounted with ProLong Gold antifade (Life Technologies, P36930). Images were captured at 63x magnification with a Nikon C1 confocal microscope (Nikon Instruments Inc., Melville, NY, USA).
Monolayers. For ATG13 immunostaining, 4.5×10⁴ cells were plated on coverslips placed in a 12-well plate and cultured for a total of 48 h before harvesting. Cells were washed in PBS, fixed with 4% paraformaldehyde at 4°C, blocked and incubated overnight with rabbit anti-ATG13 antibody at 4° C (1:50). Cells were then incubated 2 h with Alexa Fluor 546 goat anti-rabbit IgG antibody (1:200). For LC3 immunostaining, in the shorter lysosomal inhibition experiments, cells were plated on coverslips as above for ATG13 and exposed to the indicated inhibitors for the last 4 h before harvesting; in the longer lysosomal inhibition experiments, cells were plated on 60 mm Petri dishes (as described in Monolayer cultures and lysosomal inhibition section), exposed to the indicated inhibitors for the last 8 h, and then trypsinized and cytospun onto glass slides (2×10⁴ cells/slide). Cells on coverslips or on slides were then washed in PBS, fixed with cold methanol, blocked and incubated overnight with rabbit anti-LC3 antibody at 4°C (1:50). Cells were then incubated 2 h with Alexa Fluor 546 goat anti-rabbit IgG antibody (1:200).
Multicellular spheroids. MCS were transferred to polyHEMA-coated 12-well plates. The cells were trypsinized and 2×10⁴ cells were cytospun onto glass slides. Cells were then washed in PBS, blocked and processed for ATG13 or LC3 immunostaining as for 2D cultures.
TFS and MPM tumor histology. TFS were collected, fixed in 10% formalin and embedded in 3% agarose. The agar pellets were embedded in paraffin. TFS and original MPM sections (5 μm) were deparaffinized with xylene and rehydrated using an ethanol gradient. In tumors, in which multiple different cell types are present, KRT/cytokeratin staining is used to identify the mesothelioma cells, as we have shown.Citation35 For ATG13 and KRT/cytokeratin dual immunostaining, following antigen retrieval, sections were blocked and incubated overnight with rabbit anti-ATG13 antibody at 4°C (1:50); for staining mesothelioma cells, sections were incubated with mouse anti-KRT/cytokeratin AE1/AE3 antibody (1:200) for 1 h and, after washes, with biotinylated sheep anti-mouse IgG (1:200) for 1 h. Sections were then incubated 2 h with Alexa Fluor 546 goat anti-rabbit IgG (1:200) and NeutrAvidin Oregon Green 488 conjugate (1:200). For LC3 and KRT/cytokeratin dual immunostaining, following antigen retrieval, sections were incubated 10 min in cold methanol for cell permeabilization, washed 2x in PBS, blocked and incubated overnight with rabbit anti-LC3B antibody at 4°C (1:50); for staining mesothelioma cells, sections were incubated 1 h with mouse anti-KRT/cytokeratin clones AE1/AE3 antibody (1:200) for 1 h and, after washes, with biotinylated sheep anti-mouse IgG (1:200) for 1 h. Sections were then incubated with Alexa Fluor 546 goat anti-rabbit IgG (1:200) and NeutrAvidin Oregon Green 488 conjugate (1:200) for 2 h. For ATG13 and LC3 dual immunostaining, following antigen retrieval, sections were blocked and incubated overnight with rabbit anti-ATG13 antibody at 4°C (1:50); for staining LC3, sections were incubated with mouse anti-LC3A/B antibody (1:50) for 3 h and, after washes, with biotinylated sheep anti-mouse IgG (1:200) for 2 h. Sections were then incubated with Alexa Fluor 546 goat anti-rabbit IgG (1:200) and NeutrAvidin Oregon Green 488 conjugate (1:200) for 2 h.
Immunofluorescence puncta analysis
A punctum was defined as a LC3- or ATG13-positive mainly circular cytoplasmic structure of approximately 1 µm in diameter; this is thought to correspond to an autophagic vesicle (autophagosome or autolysosome) or an early autophagy structure (omegasome or phagophore). In mesothelioma cell lines, LC3 puncta were counted in a total of 100 cells for each condition (25 cells in 4 different fields from different experiments); in contrast, ATG13 puncta were not counted because they were not clearly discrete in all conditions. In tumor sections (TFS, original tumor sections, and tissue microarrays), neither LC3 nor ATG13 puncta were counted because they were not clearly discrete and thus could not be counted individually. Instead, the percentage of all mesothelioma cells (KRT/cytokeratin-positive cells) that showed any LC3 or ATG13 puncta was counted as a measure of autophagy. On average, 150 KRT/cytokeratin-positive cells were analyzed for the presence of LC3 or ATG13 puncta from 3 different spheroids (TFS), tumor sections (original tumor), or tumor cores (tissue microarrays). Images were captured using a Nikon C1 confocal microscope (Nikon instruments Inc., Melville, NY, USA) at x63 magnification. Saved images were later counted in a blinded fashion by 2 investigators.
Patients with mesothelioma
Patients whose tumor samples were used in these studies were participants in a consented and Institutional Review Board-approved biorepository and clinical database (Dana Farber/Harvard Cancer Center protocol #98–063). They underwent surgical resection of MPM at Brigham and Women's Hospital in Boston, MA without preoperative chemotherapy. Tissue cores of tumor from 109 patients were obtained from archival clinical paraffin blocks and incorporated into tissue microarrays, sections of which were immunostained. Samples of fresh tumor tissue representing 25 patients were obtained from discarded portions of the resection specimen, deidentified and transferred in 4°C media by overnight courier for the preparation of ex vivo tumor fragment spheroids and formalin-fixed paraffin embedded blocks for immunostaining. A comprehensive database of patient demographic, staging, treatment and outcome data was queried to annotate the tissue microarray. Patient age, gender, lymph node status, tumor histology, computed tomography-derived tumor volume (where available), preoperative anemia (World Health Organization criteria: hemoglobin <12 g/dL for women, <13 g/dL for men), resectability, surgical procedure (extrapleural pneumonectomy versus pleurectomy and decortication), postoperative chemotherapy and/or radiation therapy prior to recurrence, pathological TNM stage, recurrence and vital status, recurrence-free interval and overall survival duration were obtained.
Tissue microarrays
Tissue microarrays were created by the pathology core facilities of the Dana Farber/Harvard Cancer Center, with coded links to patient identity under protocol 98–063 (extrapleural pneumonectomy, n = 65; pleurectomy and decortication, n = 36; palliative tumor debulking, n = 6; open biopsy, n = 2). In addition to anonymous control cores, microarray blocks contained, per included patient, 3 cores of tumor and, if available, 3 cores of normal tissue obtained from selected areas of archival clinical blocks. Five-micron sections were adhered to charged slides and dipped in paraffin for preservation until ATG13 staining.
Statistical analysis
Data are expressed as mean ± standard deviation (SD) or standard error of the mean (SEM), as appropriate. Differences between cells in 2D and 3D and between groups with low autophagy and high autophagy were analyzed by Student t test. A P value < 0.05 was considered significant. In correlation plots, correlation analysis was performed to evaluate the Spearman rank correlation (rs). A P (2-tailed) value < 0.0001 was considered significant. GraphPad Prism was employed for statistical analysis (GraphPad Software Inc., La Jolla, CA, USA). A putative optimal cutpoint to establish a binary categorical covariate representing ATG13 positivity was determined based on minimizing the hazard ratio for recurrence and death within the middle 2 quartiles using Cox regression. The Fisher exact test was used to evaluate the association of categorical levels of ATG13 positivity with established prognostic factors. Kaplan Meier estimation and log rank comparison of survival functions, and Cox proportional hazards regression, with Bonferroni correction for multiple testing required to establish the cutpoint, were used to evaluate the association of ATG13 positivity level with time to tumor recurrence and all-causes of death following surgery, independently and with adjustment for tumor histology. StatView version 4.5 software (Abacus Concepts) was used for outcome analyses.
Abbreviations
| BECN1 | = | Beclin 1, autophagy related |
| 2D | = | 2-dimensional |
| 3D | = | 3-dimensional |
| EBSS | = | Earle's balanced salt solution |
| HCQ | = | hydroxychloroquine |
| MAP1LC3/LC3 | = | microtubule associated protein 1 light chain 3 |
| MCS | = | multicellular spheroids |
| MPM | = | malignant pleural mesothelioma |
| NH4+ | = | ammonium chloride |
| OS | = | overall survival |
| TFS | = | tumor fragment spheroids |
| TTR | = | time to recurrence |
Disclosure of potential conflicts of interest
No potential conflicts of interest were disclosed.
Supplemental_Figure_Legends.docx
Download MS Word (12.8 KB)2015AUTO0585R1-s02.pptx
Download MS Power Point (59 MB)Acknowledgments
The authors thank Julianne Barlow and Sarah C. Rogers (Division of Thoracic Surgery, Brigham and Women's Hospital, Boston, MA, 02115, USA) for contributing mesothelioma specimens.
Funding
This work was made possible by generous support from the Simmons Mesothelioma Foundation. CF was supported by a Simmons Fellowship in Mesothelioma Research. Additional funding was also provided by a Mesothelioma Applied Research Foundation (MARF) grant to DB. The funders had no role in study design, data collection and analysis, decision to publish, or preparation of the manuscript.
Related Research Data
References
- Dalby KN, Tekedereli I, Lopez-Berestein G, Ozpolat B. Targeting the prodeath and prosurvival functions of autophagy as novel therapeutic strategies in cancer. Autophagy 2010; 6:322-9; PMID:20224296; http://dx.doi.org/10.4161/auto.6.3.11625
- Janku F, McConkey DJ, Hong DS, Kurzrock R. Autophagy as a target for anticancer therapy. Nat Rev Clin Oncol 2011; 8:528-39; PMID:21587219; http://dx.doi.org/10.1038/nrclinonc.2011.71
- Rubinsztein DC, Codogno P, Levine B. Autophagy modulation as a potential therapeutic target for diverse diseases. Nat Rev Drug Discov 2012; 11:709-30; PMID:22935804; http://dx.doi.org/10.1038/nrd3802
- Sui X, Chen R, Wang Z, Huang Z, Kong N, Zhang M, Han W, Lou F, Yang J, Zhang Q, et al. Autophagy and chemotherapy resistance: a promising therapeutic target for cancer treatment. Cell Death Dis 2013; 4:e838; PMID:24113172; http://dx.doi.org/10.1038/cddis.2013.350
- Choi AM, Ryter SW, Levine B. Autophagy in human health and disease. N Engl J Med 2013; 368:1845-6; PMID:23656658; http://dx.doi.org/10.1056/NEJMra1205406
- Rebecca VW, Amaravadi RK. Emerging strategies to effectively target autophagy in cancer. Oncogene 2016; 35:1–11; PMID:25893285; http://dx.doi.org/10.1038/onc.2015.99
- Nagelkerke A, Bussink J, Geurts-Moespot A, Sweep FC, Span PN. Therapeutic targeting of autophagy in cancer. Part II: pharmacological modulation of treatment-induced autophagy. Semin Cancer Biol 2015; 31:99-105; PMID:24933034; http://dx.doi.org/10.1016/j.semcancer.2014.06.001
- Rosenfeldt MT, Nixon C, Liu E, Mah LY, Ryan KM. Analysis of macroautophagy by immunohistochemistry. Autophagy 2012; 8:963-9; PMID:22562096; http://dx.doi.org/10.4161/auto.20186
- Klionsky DJ, Abdelmohsen K, Abe A, Abedin MJ, Abeliovich H, Acevedo Arozena A, Adachi H, Adams CM, Adams PD, Adeli K, et al. Guidelines for the use and interpretation of assays for monitoring autophagy (3rd edition). Autophagy 2016; 12:1-222; PMID:26799652; http://dx.doi.org/10.1080/15548627.2015.1100356
- Mizushima N, Yoshimori T, Levine B. Methods in mammalian autophagy research. Cell 2010; 140:313-26; PMID:20144757; http://dx.doi.org/10.1016/j.cell.2010.01.028
- Barth S, Glick D, Macleod KF. Autophagy: assays and artifacts. J Pathol 2010; 221:117-24; PMID:20225337; http://dx.doi.org/10.1002/path.2694
- Zhang XJ, Chen S, Huang KX, Le WD. Why should autophagic flux be assessed? Acta Pharmacol Sin 2013; 34:595-9; PMID:23474710; http://dx.doi.org/10.1038/aps.2012.184
- Ma XH, Piao S, Wang D, McAfee QW, Nathanson KL, Lum JJ, Li LZ, Amaravadi RK. Measurements of tumor cell autophagy predict invasiveness, resistance to chemotherapy, and survival in melanoma. Clin Cancer Res 2011; 17:3478-89; PMID:21325076; http://dx.doi.org/10.1158/1078-0432.CCR-10-2372
- do Amaral JB, Rezende-Teixeira P, Freitas VM, Machado-Santelli GM. MCF-7 cells as a three-dimensional model for the study of human breast cancer. Tissue Eng Part C Methods 2011; 17:1097-107; PMID:21882900; http://dx.doi.org/10.1089/ten.tec.2011.0260
- Gomes LR, Vessoni AT, Menck CF. Three-dimensional microenvironment confers enhanced sensitivity to doxorubicin by reducing p53-dependent induction of autophagy. Oncogene 2015; 34:5329–40; PMID: 25619836; http://dx.doi.org/10.1038/onc.2014.461
- Kim KU, Wilson SM, Abayasiriwardana KS, Collins R, Fjellbirkeland L, Xu Z, Jablons DM, Nishimura SL, Broaddus VC. A novel in vitro model of human mesothelioma for studying tumor biology and apoptotic resistance. Am J Respir Cell Mol Biol 2005; 33:541-8; PMID:16123394; http://dx.doi.org/10.1165/rcmb.2004-0355OC
- Wilson SM, Barbone D, Yang TM, Jablons DM, Bueno R, Sugarbaker DJ, Nishimura SL, Gordon GJ, Broaddus VC. mTOR mediates survival signals in malignant mesothelioma grown as tumor fragment spheroids. Am J Respir Cell Mol Biol 2008; 39:576-83; PMID:18511708; http://dx.doi.org/10.1165/rcmb.2007-0460OC
- Bidlingmaier S, He J, Wang Y, An F, Feng J, Barbone D, Gao D, Franc B, Broaddus VC, Liu B. Identification of MCAM/CD146 as the target antigen of a human monoclonal antibody that recognizes both epithelioid and sarcomatoid types of mesothelioma. Cancer Res 2009; 69:1570-7; PMID:19221091; http://dx.doi.org/10.1158/0008-5472.CAN-08-1363
- Barbone D, Cheung P, Battula S, Busacca S, Gray SG, Longley DB, Bueno R, Sugarbaker DJ, Fennell DA, Broaddus VC. Vorinostat eliminates multicellular resistance of mesothelioma 3D spheroids via restoration of Noxa expression. PLoS One 2012; 7:e52753; PMID:23300762; http://dx.doi.org/10.1371/journal.pone.0052753
- Lee YJ, Hah YJ, Kang YN, Kang KJ, Hwang JS, Chung WJ, Cho KB, Park KS, Kim ES, Seo HY, et al. The autophagy-related marker LC3 can predict prognosis in human hepatocellular carcinoma. PLoS One 2013; 8:e81540; PMID:24282606; http://dx.doi.org/10.1371/journal.pone.0081540
- Zhou W, Yue C, Deng J, Hu R, Xu J, Feng L, Lan Q, Zhang W, Ji D, Wu J, et al. Autophagic protein Beclin 1 serves as an independent positive prognostic biomarker for non-small cell lung cancer. PLoS One 2013; 8:e80338; PMID:24260370; http://dx.doi.org/10.1371/journal.pone.0080338
- Cai M, Hu Z, Liu J, Gao J, Liu C, Liu D, Tan M, Zhang D, Lin B. Beclin 1 expression in ovarian tissues and its effects on ovarian cancer prognosis. Int J Mol Sci 2014; 15:5292-303; PMID:24675697; http://dx.doi.org/10.3390/ijms15045292
- Choi JH, Cho YS, Ko YH, Hong SU, Park JH, Lee MA. Absence of autophagy-related proteins expression is associated with poor prognosis in patients with colorectal adenocarcinoma. Gastroenterol Res Pract 2014; 2014:179586; PMID:24723943; http://dx.doi.org/10.1155/2014/179586
- Qiu DM, Wang GL, Chen L, Xu YY, He S, Cao XL, Qin J, Zhou JM, Zhang YX, E Q. The expression of beclin-1, an autophagic gene, in hepatocellular carcinoma associated with clinical pathological and prognostic significance. BMC Cancer 2014; 14:327; PMID:24885292; http://dx.doi.org/10.1186/1471-2407-14-327
- Winardi D, Tsai HP, Chai CY, Chung CL, Loh JK, Chen YH, Hsieh CL. Correlation of altered expression of the autophagy marker LC3B with poor prognosis in astrocytoma. Biomed Res Int 2014; 2014:723176; PMID:24900981
- Zhao Y, Chen S, Gou WF, Xiao LJ, Takano Y, Zheng HC. Aberrant Beclin 1 expression is closely linked to carcinogenesis, differentiation, progression, and prognosis of ovarian epithelial carcinoma. Tumour Biol 2014; 35:1955-64; PMID:24132590; http://dx.doi.org/10.1007/s13277-013-1261-6
- Yang M, Zhao H, Guo L, Zhang Q, Zhao L, Bai S, Zhang M, Xu S, Wang F, Wang X, et al. Autophagy-based survival prognosis in human colorectal carcinoma. Oncotarget 2015; 6:7084-103; PMID:25762626; http://dx.doi.org/10.18632/oncotarget.3054
- Sakakura K, Takahashi H, Kaira K, Toyoda M, Oyama T, Chikamatsu K. Immunological significance of the accumulation of autophagy components in oral squamous cell carcinoma. Cancer Sci 2015; 106:1-8; PMID:25338734; http://dx.doi.org/10.1111/cas.12559
- Tang H, Sebti S, Titone R, Zhou Y, Isidoro C, Ross TS, Hibshoosh H, Xiao G, Packer M, Xie Y, et al. Decreased mRNA Expression in Human Breast Cancer is Associated with Estrogen Receptor-Negative Subtypes and Poor Prognosis. EBioMedicine 2015; 2:255-63; http://dx.doi.org/10.1016/j.ebiom.2015.01.008
- Yang Z, Ghoorun RA, Fan X, Wu P, Bai Y, Li J, Chen H, Wang L, Wang J. High expression of Beclin-1 predicts favorable prognosis for patients with colorectal cancer. Clin Res Hepatol Gastroenterol 2015; 39:98-106; PMID:25130795; http://dx.doi.org/10.1016/j.clinre.2014.06.014
- Alers S, Loffler AS, Paasch F, Dieterle AM, Keppeler H, Lauber K, Campbell DG, Fehrenbacher B, Schaller M, Wesselborg S, et al. Atg13 and FIP200 act independently of Ulk1 and Ulk2 in autophagy induction. Autophagy 2011; 7:1423-33; PMID:22024743; http://dx.doi.org/10.4161/auto.7.12.18027
- Alers S, Wesselborg S, Stork B. ATG13: just a companion, or an executor of the autophagic program? Autophagy 2014; 10:944-56; PMID:24879146; http://dx.doi.org/10.4161/auto.28987
- Kaizuka T, Mizushima N. Atg13 is essential for autophagy and cardiac development in mice. Mol Cell Biol 2015; 36(4):585-95; PMID:26644405
- Karanasios E, Stapleton E, Manifava M, Kaizuka T, Mizushima N, Walker SA, Ktistakis NT. Dynamic association of the ULK1 complex with omegasomes during autophagy induction. J Cell Sci 2013; 126:5224-38; PMID:24013547; http://dx.doi.org/10.1242/jcs.132415
- Barbone D, Follo C, Echeverry N, Gerbaudo VH, Klabatsa A, Bueno R, Felley-Bosco E, Broaddus VC. Autophagy Correlates with the Therapeutic Responsiveness of Malignant Pleural Mesothelioma in 3D Models. PLoS One 2015; 10:e0134825; PMID:26284517; http://dx.doi.org/10.1371/journal.pone.0134825
- Altman DG, Lausen B, Sauerbrei W, Schumacher M. Dangers of using “optimal” cutpoints in the evaluation of prognostic factors. J Natl Cancer Inst 1994; 86:829-35; PMID:8182763; http://dx.doi.org/10.1093/jnci/86.11.829
- Nicotra G, Mercalli F, Peracchio C, Castino R, Follo C, Valente G, Isidoro C. Autophagy-active beclin-1 correlates with favourable clinical outcome in non-Hodgkin lymphomas. Mod Pathol 2010; 23:937-50; PMID:20473282; http://dx.doi.org/10.1038/modpathol.2010.80
- Lazova R, Camp RL, Klump V, Siddiqui SF, Amaravadi RK, Pawelek JM. Punctate LC3B expression is a common feature of solid tumors and associated with proliferation, metastasis, and poor outcome. Clin Cancer Res 2012; 18:370-9; PMID:22080440; http://dx.doi.org/10.1158/1078-0432.CCR-11-1282
- Chen S, Jiang YZ, Huang L, Zhou RJ, Yu KD, Liu Y, Shao ZM. The residual tumor autophagy marker LC3B serves as a prognostic marker in local advanced breast cancer after neoadjuvant chemotherapy. Clin Cancer Res 2013; 19:6853-62; PMID:24141623; http://dx.doi.org/10.1158/1078-0432.CCR-13-1617
- Sakurai T, Okumura H, Matsumoto M, Uchikado Y, Setoyama T, Omoto I, Owaki T, Maemura K, Ishigami S, Natsugoe S. The expression of LC-3 is related to tumor suppression through angiogenesis in esophageal cancer. Med Oncol 2013; 30:701; PMID:24122254; http://dx.doi.org/10.1007/s12032-013-0701-x
- Tang JY, Hsi E, Huang YC, Hsu NC, Chen YK, Chu PY, Chai CY. ATG9A overexpression is associated with disease recurrence and poor survival in patients with oral squamous cell carcinoma. Virchows Arch 2013; 463:737-42; PMID:24085552; http://dx.doi.org/10.1007/s00428-013-1482-5
- Tang JY, Hsi E, Huang YC, Hsu NC, Chu PY, Chai CY. High LC3 expression correlates with poor survival in patients with oral squamous cell carcinoma. Hum Pathol 2013; 44:2558-62; PMID:24055091; http://dx.doi.org/10.1016/j.humpath.2013.06.017
- Lefort S, Joffre C, Kieffer Y, Givel AM, Bourachot B, Zago G, Bieche I, Dubois T, Meseure D, Vincent-Salomon A, et al. Inhibition of autophagy as a new means of improving chemotherapy efficiency in high-LC3B triple-negative breast cancers. Autophagy 2014; 10:2122-42; PMID:25427136; http://dx.doi.org/10.4161/15548627.2014.981788
- Liu JL, Chen FF, Lung J, Lo CH, Lee FH, Lu YC, Hung CH. Prognostic significance of p62/SQSTM1 subcellular localization and LC3B in oral squamous cell carcinoma. Br J Cancer 2014; 111:944-54; PMID:24983366; http://dx.doi.org/10.1038/bjc.2014.355
- Wu DH, Jia CC, Chen J, Lin ZX, Ruan DY, Li X, Lin Q, Min D, Ma XK, Wan XB, et al. Autophagic LC3B overexpression correlates with malignant progression and predicts a poor prognosis in hepatocellular carcinoma. Tumour Biol 2014; 35:12225-33; PMID:25256671; http://dx.doi.org/10.1007/s13277-014-2531-7
- Yun M, Bai HY, Zhang JX, Rong J, Weng HW, Zheng ZS, Xu Y, Tong ZT, Huang XX, Liao YJ, et al. ULK1: a promising biomarker in predicting poor prognosis and therapeutic response in human nasopharygeal carcinoma. PLoS One 2015; 10:e0117375; PMID:25714809; http://dx.doi.org/10.1371/journal.pone.0117375
- Gu Y, Li P, Peng F, Zhang M, Zhang Y, Liang H, Zhao W, Qi L, Wang H, Wang C, et al. Autophagy-related prognostic signature for breast cancer. Mol Carcinog 2016; 55:292–9; PMID: 25620657; http://dx.doi.org/10.1002/mc.22278
- Jao CC, Ragusa MJ, Stanley RE, Hurley JH. A HORMA domain in Atg13 mediates PI 3-kinase recruitment in autophagy. Proc Natl Acad Sci U S A 2013; 110:5486-91; PMID:23509291; http://dx.doi.org/10.1073/pnas.1220306110
- Cuzick J. Controversies in design and interpretation of adjuvant clinical trials. Cancer Invest 2010; 28 Suppl 1:28-34; PMID:20653405; http://dx.doi.org/10.3109/07357907.2010.501633
- Hamai A, Codogno P, Mehrpour M. Cancer stem cells and autophagy: Facts and Perspectives. J Cancer Stem Cell Res 2014; 2:e1005; http://dx.doi.org/10.14343/JCSCR.2014.2e1005
- Cortes-Dericks L, Froment L, Boesch R, Schmid RA, Karoubi G. Cisplatin-resistant cells in malignant pleural mesothelioma cell lines show ALDH(high)CD44(+) phenotype and sphere-forming capacity. BMC Cancer 2014; 14:304; PMID:24884875; http://dx.doi.org/10.1186/1471-2407-14-304
- Pasdar EA, Smits M, Stapelberg M, Bajzikova M, Stantic M, Goodwin J, Yan B, Stursa J, Kovarova J, Sachaphibulkij K, et al. Characterisation of mesothelioma-initiating cells and their susceptibility to anti-cancer agents. PLoS One 2015; 10:e0119549; PMID:25932953; http://dx.doi.org/10.1371/journal.pone.0119549
- Eskelinen EL. The dual role of autophagy in cancer. Curr Opin Pharmacol 2011; 11:294-300; PMID:21498118; http://dx.doi.org/10.1016/j.coph.2011.03.009
- Liu B, Wen X, Cheng Y. Survival or death: disequilibrating the oncogenic and tumor suppressive autophagy in cancer. Cell Death Dis 2013; 4:e892; PMID:24176850; http://dx.doi.org/10.1038/cddis.2013.422
- Galluzzi L, Pietrocola F, Bravo-San Pedro JM, Amaravadi RK, Baehrecke EH, Cecconi F, Codogno P, Debnath J, Gewirtz DA, Karantza V, et al. Autophagy in malignant transformation and cancer progression. EMBO J 2015; 34:856-80; PMID:25712477; http://dx.doi.org/10.15252/embj.201490784
- Denton D, Xu T, Kumar S. Autophagy as a pro-death pathway. Immunol Cell Biol 2015; 93:35-42; PMID:25331550; http://dx.doi.org/10.1038/icb.2014.85
- White E. The role for autophagy in cancer. J Clin Invest 2015; 125:42-6; PMID:25654549; http://dx.doi.org/10.1172/JCI73941
- Sharma K, Le N, Alotaibi M, Gewirtz DA. Cytotoxic autophagy in cancer therapy. Int J Mol Sci 2014; 15:10034-51; PMID:24905404; http://dx.doi.org/10.3390/ijms150610034
- Liu Y, Levine B. Autosis and autophagic cell death: the dark side of autophagy. Cell Death Differ 2015; 22:367-76; PMID:25257169; http://dx.doi.org/10.1038/cdd.2014.143
- Echeverry N, Ziltener G, Barbone D, Weder W, Stahel RA, Broaddus VC, Felley-Bosco E. Inhibition of autophagy sensitizes malignant pleural mesothelioma cells to dual PI3K/mTOR inhibitors. Cell Death Dis 2015; 6:e1757; PMID:25950487; http://dx.doi.org/10.1038/cddis.2015.124
- Harasawa R, Mizusawa H, Nozawa K, Nakagawa T, Asada K, Kato I. Detection and tentative identification of dominant mycoplasma species in cell cultures by restriction analysis of the 16S-23S rRNA intergenic spacer regions. Res Microbiol 1993; 144:489-93; PMID:7910696; http://dx.doi.org/10.1016/0923-2508(93)90057-9
- Barbone D, Yang TM, Morgan JR, Gaudino G, Broaddus VC. Mammalian target of rapamycin contributes to the acquired apoptotic resistance of human mesothelioma multicellular spheroids. J Biol Chem 2008; 283:13021-30; PMID:18339627; http://dx.doi.org/10.1074/jbc.M709698200