
ABSTRACT
Autophagy, which is critical for the proper turnover of organelles such as endoplasmic reticulum and mitochondria, affects diverse aspects of metabolism, and its dysregulation has been incriminated in various metabolic disorders. However, the role of autophagy of myeloid cells in adipose tissue inflammation and type 2 diabetes has not been addressed. We produced mice with myeloid cell-specific deletion of Atg7 (autophagy-related 7), an essential autophagy gene (Atg7 conditional knockout [cKO] mice). While Atg7 cKO mice were metabolically indistinguishable from control mice, they developed diabetes when bred to ob/w mice (Atg7 cKO-ob/ob mice), accompanied by increases in the crown-like structure, inflammatory cytokine expression and inflammasome activation in adipose tissue. Mφs (macrophages) from Atg7 cKO mice showed significantly higher interleukin 1 β release and inflammasome activation in response to a palmitic acid plus lipopolysaccharide combination. Moreover, a decrease in the NAD+:NADH ratio and increase in intracellular ROS content after treatment with palmitic acid in combination with lipopolysaccharide were more pronounced in Mφs from Atg7 cKO mice, suggesting that mitochondrial dysfunction in autophagy-deficient Mφs leads to an increase in lipid-induced inflammasome and metabolic deterioration in Atg7 cKO-ob/ob mice. Atg7 cKO mice were more susceptible to experimental colitis, accompanied by increased colonic cytokine expression, T helper 1 skewing and systemic bacterial invasion. These results suggest that autophagy of Mφs is important for the control of inflammasome activation in response to metabolic or extrinsic stress, and autophagy deficiency in Mφs may contribute to the progression of metabolic syndrome associated with lipid injury and colitis.
Introduction
Macroautophagy (referred to as autophagy hereafter) is a catabolic cellular process leading to the degradation of the cell's own components inside autolysosomes which are formed by fusion of double-membrane autophagosomes enclosing cellular content to lysosomes. Autophagy plays a critical role in the metabolic adaptation in nutrient deficiency and also in the turnover of dysfunctional or damaged proteins and organelles.Citation1 Since ER (endoplasmic reticulum) and mitochondria that critically affect β-cell function, insulin release and insulin sensitivity depend on autophagy for proper function,Citation2-4 autophagy of several metabolic organs or systemic autophagy affects nutrient metabolism.Citation5,6 Furthermore, disturbance of local or systemic autophagy appears to plays a role in dysregulated metabolism and in the development of metabolic syndrome or T2D (type 2 diabetes).
Insulin resistance is a prerequisite for the development of T2D and is caused by several factors such as lipid, ROS (reactive oxygen species), and ER stress.Citation7 Besides such well-recognized factors, low-grade inflammation has recently been implicated as an important contributing factor to insulin resistance.Citation7 There have been numerous reports showing the role of diverse innate immune receptors in inflammation associated with metabolic syndrome; however, recent papers have presented convincing data suggesting a crucial role of NLRP3 (NLR family, pyrin domain containing 3) inflammasome in this process.Citation8-10 The involvement of inflammasome activation in insulin resistance also suggests a potential role of autophagy in the development of insulin resistance, since autophagy is a well-known modulator of inflammasome activation. Thus, autophagy regulates inflammasome activation by participating in the quality control of dysfunctional mitochondria that can augment inflammasome activation and also by removing the inflammasome complex.Citation11,12
As these results suggest that autophagy deficiency is a proinflammatory condition particularly in relation to inflammasome activation, deficient autophagy can be a factor in the development of T2D associated with low-grade inflammation and inflammasome activation. Although the role of autophagy of diverse tissues in body metabolism has been intensively investigated,Citation13-21 the importance of autophagy of myeloid cells such as Mφs (macrophages) in the regulation of systemic insulin sensitivity and in the development of T2D has not been clearly elucidated. Besides metabolic syndrome, IBD (inflammatory bowel disease) is a prototypic disease associated with autophagy deficiency inducing aggravated tissue inflammation.Citation22 Furthermore, the incidence of IBD is increased by a western diet underscoring the importance of both genetic and environmental factors in the development of IBD.Citation23 To investigate the role of myeloid cell autophagy in tissue inflammation associated with metabolic syndrome, we generated mice with myeloid cell-specific autophagy deficiency and studied the development of diabetes and metabolic syndrome before and after imposing metabolic stress. We also examined the relationship between myeloid autophagy and the development of experimental colitis using mice with myeloid cell-specific autophagy deficiency.
Results
Metabolic profile of myeloid cell-specific autophagy-deficient mice
We bred Atg7 cWT (conditional wild-type; Atg7F/F) mice with Lys-Cre mice where Cre recombinase is under control of the Lyz2/LysM (lysozyme 2) promoter to generate mice with myeloid cell-specific deletion of Atg7 (Atg7F/F; Lyz2-Cre+ mice, described as Atg7 conditional knockout (Atg7 cKO) henceforth in the manuscript) (Table S1). PCR analysis validated deletion of floxed segment in genomic DNA from peritoneal Mφs of Atg7 cKO mice (). Myeloid cell-specific autophagy deficiency was confirmed by negligible expression of ATG7 protein and accumulation of SQSTM1 (sequestosome 1)/p62, a well-known receptor and substrate of autophagy in peritoneal Mφs from Atg7 cKO mice (). Atg7 mRNA expression was also markedly lower in peritoneal Mφs from Atg7 cKO mice (). Conversion of MAP1LC3A/B (microtubule-associated protein 1 light chain 3, α/β)-I to MAP1LC3A/B-II was defective in Mφs from Atg7 cKO mice that were cultured in serum-free condition to induce autophagy ().
Figure 1. Metabolic profile of male Atg7 cKO mice. (A) PCR using DNA from peritoneal Mφs and primers specific for Atg7. (B) Peritoneal Mφs were cultured in serum-free conditions for 6 h to induce autophagy, and cell extracts were subjected to western blot analysis. (C) Quantitative RT-PCR was done using mRNA from Mφs and specific primers. (D) Nonfasting blood glucose level was determined in male Atg7 cKO, Atg7 cKO-ob/ob and respective control mice (n = 10 to 15). (E) IPGTT was conducted in overnight-fasted 16-wk-old male mice as described in Materials and Methods, and AUC calculated (n = 5 to 8). (F) ITT was conducted in fasted 16-wk-old male mice as described in the Materials and Methods, and AUC calculated (n = 5 to 10). *, P < 0.05; **, P < 0.01; ***, P < 0.001.
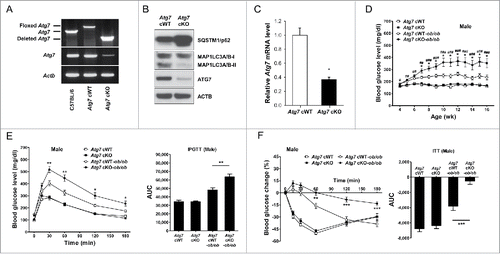
Apparently, Atg7 cKO mice were indistinguishable from Atg7 cWT mice. Metabolically, both male and female Atg7 cKO mice were not different from Atg7 cWT mice, as evidenced by normal nonfasting blood glucose levels, body weight, IPGTT (intraperitoneal glucose tolerance test) and ITT (insulin tolerance test) results (P > 0.1 for all comparisons) (, Fig. S1, S2 A to C). Since autophagy deficiency is a proinflammatory condition associated with an increased susceptibility to inflammasome activationCitation12 and inflammasome activation owing to the metabolic stress of lipid injury is implicated in the low-grade tissue inflammation inducing insulin resistance,Citation10 we imposed metabolic stress to Atg7 cKO mice by breeding to ob/w (heterozygous Lep knockout) mice to derive Atg7 cKO-ob/ob mice (Table S1). While male Atg7 cWT-ob/ob mice showed only hyperglycemia, blood glucose levels of male Atg7 cKO-ob/ob mice were significantly higher than those of male Atg7 cWT-ob/ob mice and reached diabetic range (P < 0.05 to 0.001) (). Body weight of male Atg7 cKO-ob/ob mice was not different from that of male Atg7 cWT-ob/ob mice (P > 0.1) (Fig. S1). IPGTT showed further impaired glucose intolerance of male Atg7 cKO-ob/ob mice accompanied by an increased AUC (area under the curve) compared to male Atg7 cWT-ob/ob mice (P < 0.05 to 0.01) (). ITT also showed further decreased insulin sensitivity of male Atg7 cKO-ob/ob mice accompanied by a decreased AUC compared to male Atg7 cWT-ob/ob mice (P < 0.01 to 0.001) (), suggesting that aggravated insulin resistance leads to the diabetes of male Atg7 cKO-ob/ob mice. Blood glucose profile and body weight of female Atg7 cKO-ob/ob mice were not significantly different from those of female Atg7 cWT-ob/ob mice (P > 0.1) (Fig. S1, S2A). However, IPGTT and ITT showed tendency toward metabolic deterioration in female Atg7 cKO-ob/ob mice compared to female Atg7 cWT-ob/ob mice, while statistical significance was not reached (P > 0.05) (Fig. S2B, C). Since metabolic deterioration was more prominent in male Atg7 cKO-ob/ob mice compared to female Atg7 cKO-ob/ob mice, the subsequent experiments were conducted employing male Atg7 cKO-ob/ob mice.
The insulinogenic index, representing β-cell response to changing glucose level, did not differ between Atg7 cKO-ob/ob and Atg7 cWT-ob/ob mice (Fig. S3A). β-cell mass was also not different between Atg7 cKO-ob/ob and Atg7 cWT-ob/ob mice (Fig. S3B), suggesting that aggravated β-cell failure might not play a dominant role in the development of diabetes in Atg7 cKO-ob/ob mice. The metabolic profile of Atg7 cKO-ob/w and Atg7 cWT-ob/w mice was not different from that of Atg7 cKO and Atg7 cWT mice, respectively (Fig. S4). Hence, Atg7 cKO-ob/w and Atg7 cWT-ob/w mice were employed instead of Atg7 cKO and Atg7 cWT mice, respectively, in most of the following experiments.
Enhanced inflammasome activation in autophagy-deficient Mφs
We next studied the possible mechanism of overt diabetes and increased insulin resistance in Atg7 cKO-ob/ob mice by investigating the inflammasome activation in response to lipid injury, since inflammasome activation due to lipid injury has been implicated in obesity-induced diabetesCitation9,10 and autophagy deficiency can enhance inflammasome activation.Citation11,12 Primary peritoneal Mφs from control Atg7 cWT mice were cultured with PA (palmitic acid) in combination with LPS (lipopolysaccharide), a condition that is capable of activating the inflammasome.Citation10 While LPS alone induced only a minimal amount of IL1B (interleukin 1 β) release and PA alone had virtually no effect on IL1B release from peritoneal Mφs of Atg7 cWT mice, significant IL1B release was observed when treated with PA in combination with LPS (). IL1B release in response to PA in combination with LPS was significantly higher when Mφs from Atg7 cKO mice were employed (P < 0.05 to 0.01) (), suggesting increased inflammasome activation in autophagy-deficient Mφs. Indeed, western blot analysis demonstrated increased maturation of IL1B and increased activation of CASP1 (caspase 1) in autophagy-deficient Mφs treated with PA and LPS combination compared to autophagy-competent Mφs (). These results show that autophagy deficiency promotes inflammasome activation in response to lipid injury which can aggravate insulin resistance associated with obesity.
Figure 2. Inflammasome activation in Mφs from 12-wk-old mice by varying doses of PA in combination with 500 ng/ml LPS. (A) Primary peritoneal Mφs were incubated with PA of the indicated concentrations and LPS. After 24 h of culture, IL1B concentration in the supernatant was determined by ELISA. (B) After incubation of primary peritoneal Mφs with PA of the indicated doses and LPS for 24 h, cell extracts were subjected to western blot analysis using anti-IL1B and -CASP1 Abs. (C) After the same incubation of Mφs as in (B), NAD+:NADH ratio was determined using a commercial kit. (D) After the same incubation of Mφs as in (B), cells were incubated with MitoSOX Red for flow cytometry (dark green, unstained; green, Atg7 cWT Mφs treated with 400 μM PA; blue, Atg7 cWT Mφs treated with LPS; orange, Atg7 cWT Mφs treated with 400 μM PA + LPS; red, Atg7 cKO Mφs treated with 400 μM PA + LPS). *, P < 0.05; **, P < 0.01; ***, P < 0.001.
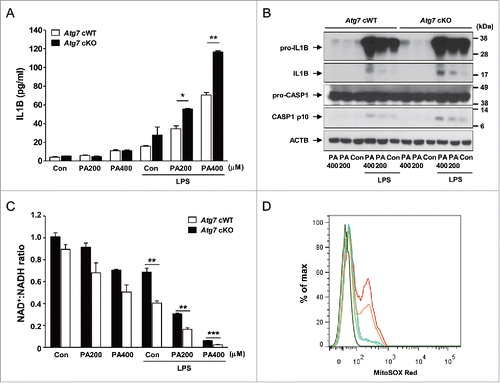
We further investigated the mechanism of increased inflammasome activation in autophagy-deficient Mφs by studying the mitochondrial events that have been incriminated as crucial steps in inflammasome activation.Citation24 Furthermore, mitochondrial function and events during inflammasome activation are likely to be affected by autophagy deficiency since mitochondria are important target organelles of autophagy in a process called mitophagy.Citation1 While PA alone or LPS alone reduced the ratio of oxidized to reduced nicotinamide adenine dinucleotide (NAD+:NADH) to a small degree, treatment with PA in combination with LPS had profound effects on the NAD+:NADH ratio, suggesting obvious mitochondrial dysfunction after combined treatment with PA and LPS (). Such decreases of NAD+:NADH ratio by PA in combination with LPS were further aggravated when autophagy-deficient Mφs were employed (P < 0.01 to 0.001) (), supporting that autophagy deficiency is a proinflammatory condition facilitating inflammasome activation by lipid injury. We also studied mitochondrial ROS content that can be increased by mitochondrial dysfunctionCitation25 and plays an important role in inflammasome activation by diverse effectors.Citation26 While LPS alone has minimal effects on the mitochondrial ROS content determined by MitoSOX Red staining,Citation25 mitochondrial ROS content was notably increased by PA in combination with LPS in autophagy-competent Mφs (). Mitochondrial ROS content was further increased by PA in combination with LPS when autophagy-deficient Mφs were employed (), supporting that mitochondrial dysfunction associated with autophagy deficiency can lead to increased mitochondrial ROS and enhanced inflammasome activation by lipid injury.
Enhanced adipose tissue inflammation of Atg7 cKO-ob/ob mice
We next studied whether low-grade adipose tissue inflammation and inflammasome activation in vivo is altered in Atg7 cKO-ob/ob mice that have deteriorated metabolic profile. Consistent with our hypothesis that myeloid cell-specific autophagy deficiency is a proinflammatory condition associated with lipid injury, the numbers of CLS (crown-like structure) representing Mφ aggregate around dead adipocytes and metainflammation associated with obesity,Citation27 were significantly higher in adipose tissue of Atg7 cKO-ob/ob mice compared to Atg7 cWT-ob/ob mice (P < 0.01) (). Consistently, the expression of inflammatory markers such as Tnf (tumor necrosis factor), Il6 (interleukin 6), pro-Il1b and Adgre1 (adhesion G protein-coupled receptor E1) was significantly higher in the SVF (stromal vascular fraction) of white adipose tissue from Atg7 cKO-ob/ob mice compared to Atg7 cWT-ob/ob mice (P < 0.05 to 0.001) (), indicating increased low-grade tissue inflammation as a cause of increased insulin resistance in Atg7 cKO-ob/ob mice.
Figure 3. Inflammasome activation in vivo. (A) The number of CLS in white adipose tissue of 20-wk-old mice was counted as described in Materials and Methods (n = 4 each) (right). Representative H&E stained sections of white adipose tissue are shown (left, scale bar: 100 μm). (B) Total mRNA was extracted from the SVF of white adipose tissue from 20-wk-old mice, and quantitative RT-PCR was done using primers specific for Tnf, Il6, pro-Il1b and Adgre1 (n = 3 each). (C) Tissue lysate of the SVF was subjected to western blot analysis using anti-IL1B and -CASP1 Abs. (D) Serum IL1B level was determined using a commercial ELISA kit (n = 3 to 15). *, P < 0.05; **, P < 0.01; ***, P < 0.001.
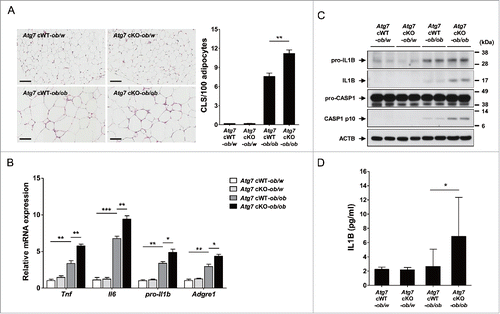
We next studied whether the increased adipose tissue inflammation in Atg7 cKO-ob/ob mice is associated with inflammasome activation. Indeed, western blot analysis showed that maturation of IL1B from pro-IL1B and activation of CASP1 were more pronounced in the SVF of Atg7 cKO-ob/ob mice compared to Atg7 cWT-ob/ob mice (), supporting the role of enhanced inflammasome activation associated with Mφs autophagy deficiency as a cause of increased adipose tissue inflammation in vivo. Probably because of increased inflammasome activation in vivo, serum IL1B level was significantly higher in Atg7 cKO-ob/ob mice compared to Atg7 cWT-ob/ob mice (P < 0.05) ().
We also studied islet inflammation that could be affected by inflammasome activation associated with obesity.Citation28 Islet infiltration of ADGRE1+ Mφs in autophagy-competent Atg7 cWT-ob/ob mice which was significantly higher compared to lean mice, was further augmented in Atg7 cKO-ob/ob mice (P < 0.05) (Fig. S5), suggesting that inflammation in myeloid cell-specific autophagy deficiency occurs in both insulin target tissues and islets producing insulin. More pronounced islet inflammation in Atg7 cKO-ob/ob mice compared to Atg7 cWT-ob/ob mice might account for the absence of compensatory increase of β-cell function despite increased insulin resistance in Atg7 cKO-ob/ob mice compared to Atg7 cWT-ob/ob mice (see Fig. S3A), while β-cell dysfunction is not a dominant factor in the development of diabetes in Atg7 cKO-ob/ob mice.
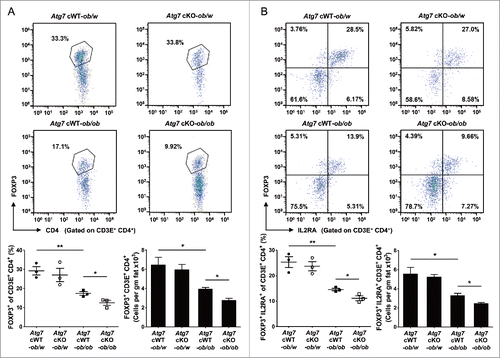
Regulatory T (Treg) cells in Atg7 cKO mice
We next studied Treg cells that can modulate low-grade inflammation associated with insulin resistanceCitation29 and can be affected by cytokines such as IL1B.Citation30,31 When we measured the Treg cell fraction in the SVF of white adipose tissue from Atg7 cWT-ob/ob mice, the percentage of FOXP3 (forkhead box P3)+ CD4+ Treg cells among CD3E+ T cells was significantly suppressed compared to Atg7 cWT-ob/w mice (P < 0.01) (), supporting reduced Treg cell activity as a factor in the augmented adipose tissue metainflammation.Citation29 In the SVF of Atg7 cKO-ob/ob mice, the percentage of FOXP3+ CD4+ Treg cells among CD3E+ T cells was further suppressed compared to Atg7 cWT-ob/ob mice (P < 0.05) (), suggesting that suppressed Treg cell activity contributes to the further augmented adipose tissue inflammation and insulin resistance in Atg7 cKO-ob/ob mice. When we examined IL2RA (interleukin 2 receptor, α chain) expression that reflects the suppressive function of Treg cells,Citation32 the percentage of FOXP3+ IL2RA+ Treg cells among CD3E+ T cells was again further suppressed in the SVF of white adipose tissue from Atg7 cKO-ob/ob mice compared to Atg7 cWT-ob/ob mice (P < 0.05), which was already lower than that from lean Atg7 cWT-ob/w mice (P < 0.01) (). The numbers of FOXP3+ CD4+ CD3E+ Treg cells and FOXP3+ IL2RA+ CD3E+ Treg cells in the SVF of white adipose tissue from Atg7 cKO-ob/ob mice were also significantly lower than those from Atg7 cWT-ob/ob mice (P < 0.05 for both comparisons), which were already lower than those from lean Atg7 cWT-ob/w mice (P < 0.05 for both comparisons) (). In contrast, Treg cell activity was not different between them (P > 0.1) (Fig. S6), suggesting that changes in the number and proportion rather than activity of individual FOXP3+ IL2RA+ CD4+ Treg cell contribute to the disparate degree of adipose tissue metainflammation between groups.
Figure 4. Treg cells in white adipose tissue. (A) Cells in the SVF of white adipose tissue from 20-wk-old mice were incubated with a mixture of anti-CD3E, -CD4, and -IL2RA Abs, and then with -FOXP3 Ab as described in Materials and Methods. FOXP3 and CD4 expression was examined by flow cytometry gated on CD3E+ CD4+ cells. The proportions of FOXP3+ cells among CD3E+ CD4+ cells (lower left) and the numbers of FOXP3+ CD3E+ CD4+ cells/gm adipose tissue (lower right) (n = 3 each). Representative FACS scattergrams are shown (upper). (B) Cells were incubated with Abs as in (A), and FOXP3 and IL2RA expression was examined by flow cytometry gated on CD3E+ CD4+ cells. The proportions of FOXP3+ IL2RA+ cells among CD3E+ CD4+ cells (lower left) and the numbers of FOXP3+ IL2RA+ CD3E+ CD4+ cells/gm adipose tissue (lower right) (n = 3 each). Representative FACS scattergrams are shown (upper). *, P < 0.05; **, P < 0.01.
Colitis in Atg7 cKO mice
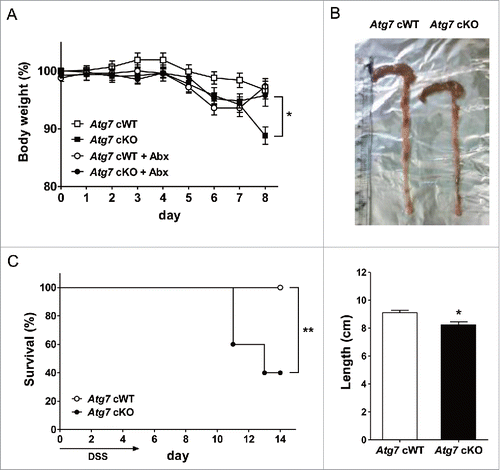
Since Mφs are important players in mucosal immunity of gutCitation33 and autophagy is an important factor in the development of IBD,Citation22 we also studied whether susceptibility to experimental colitis is altered in Atg7 cKO mice. Weight loss after treatment with 2.5% DSS (dextran sodium sulfate) was more severe in Atg7 cKO mice compared to Atg7 cWT mice (P < 0.05) (). Colon length measured 7 d after DSS administration was also significantly shorter in Atg7 cKO mice compared to Atg7 cWT mice (P < 0.05), suggesting more pronounced colitis in Atg7 cKO mice (). The difference in body weight after 2.5% DSS treatment between Atg7 cKO and Atg7 cWT mice disappeared when antibiotics were administered since 2 d before 2.5 % DSS treatment, indicating the role of intestinal microbiota as incriminating agents causing aggravated colitis in Atg7 cKO mice after DSS administration (). Probably because of aggravated colitis, survival was significantly decreased in Atg7 cKO mice compared to Atg7 cWT mice after administration of 4% DSS that has been employed to study the mortality of mice due to colitisCitation34 (P < 0.01) ().
Figure 5. DSS-induced colitis in Atg7 cKO mice. (A) Body weight was monitored during and after oral administration of 2.5% DSS for 5 d (n = 7 each). The antibiotic mixture (Abx) was administered since 2 d before DSS as described in Materials and Methods, and body weight monitored (n = 7 each). (B) Gross morphology (upper) and length (lower) of the colons on day 7 of DSS administration (n = 5 to 6). (C) Survival after administration of 4% DSS was monitored as described in Materials and Methods (n = 10 each). *, P < 0.05; **, P < 0.01.
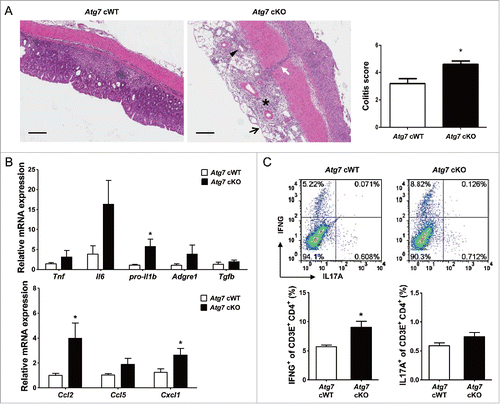
Colitis scoring of H&E sections showed more severe colitis in Atg7 cKO mice compared to Atg7 cWT mice (P < 0.05) (), consistent with the more severe weight loss and decreased survival of Atg7 cKO mice. When we examined the expression of cytokinesCitation35-38 and chemokinesCitation39-41 that can be effector molecules in aggravated colitis using colonic mRNA prepared from paraffin-embedded colonic sections, mRNA expression of pro-Il1b, Ccl2 (chemokine (C-C motif) ligand 2) and Cxcl1 (chemokine (C-X-C motif) ligand 1) was significantly elevated in colon tissue of Atg7 cKO mice treated with 2.5% DSS compared to Atg7 cWT mice treated in the same way (P < 0.05), while the expression of other cytokines such as Il6 or Tnf and that of chemokines such as Ccl5 (chemokine (C-C motif) ligand 5) was marginally elevated (P > 0.05). The expression of Tgfb (transforming growth factor, β) in the colonic tissues was not different between Atg7 cKO and Atg7 cWT mice (P > 0.1) (). We also studied Th (T helper) cells skewing that can affect the development of colitis.Citation38,42,43 We observed significantly increased proportion of IFNG (interferon gamma)+ Th1 cells in the colonic lamina propria of Atg7 cKO mice compared to Atg7 cWT mice (P < 0.05). In contrast, the proportion of IL17A (interleukin 17A)+ Th17 cells was not significantly different between the 2 mouse groups (P > 0.1) (), which could be attributable to the absence of a significant increase of Tgfb expression in colonic tissue of Atg7 cKO mice, a critical component of the Th17 response.Citation44 Infiltration of ADGRE1+ ITGAM (integrin α M)/CD11b+ myeloid cells was more pronounced in the lamina propria of Atg7 cKO mice compared to Atg7 cWT mice as evidenced by significantly increased percentage of ADGRE1+ ITGAM+ myeloid cells in the lamina propria of Atg7 cKO mice compared to Atg7 cWT mice (P < 0.05) (Fig. S7A); however, the proportion of Treg cells was not significantly different between the 2 mouse groups (P > 0.1) (Fig. S7B).
Figure 6. Inflammation and Th1 skewing in the colon of Atg7 cKO mice. (A) Colitis score was calculated on d 7 of DSS treatment as described in Materials and Methods (n = 5 each) (right). Representative H&E sections are shown (left, scale bar: 200 μm) (asterisk, inflammation; arrow, ulceration; arrow head, regeneration; white arrow, transmural lesion). (B) Relative expression of cytokines and chemokines in the colonic tissues on d 7 of DSS treatment assessed by quantitative RT-PCR analysis of mRNA prepared using a formalin-fixed paraffin-embedded extraction kit (n = 8 to 10). (C) Th skewing in the colonic lamina propria on day 7 of DSS treatment was evaluated by flow cytometry. The proportions of IFNG+ cells and IL17A+ cells among CD3E+ CD4+ T cells (lower) (n = 4 each). Representative scattergrams are shown (upper). *, P < 0.05.
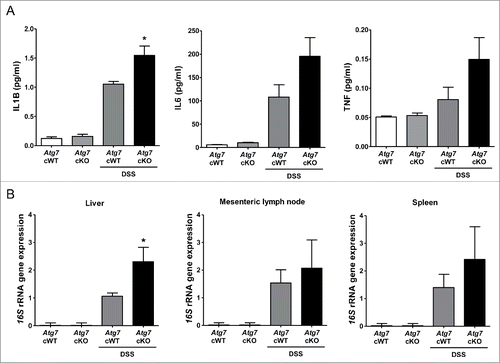
We next studied whether aggravated colitis in Atg7 cKO mice after DSS treatment leads to systemic infection or inflammation across the colonic tissue. Serum levels of IL1B after DSS treatment were significantly increased in Atg7 cKO mice compared to Atg7 cWT mice, suggesting augmented systemic inflammation probably due to the impaired gut barrier function after DSS treatment of Atg7 cKO mice (P < 0.05) (). Serum levels of IL6 and TNF after DSS treatment appeared to be increased in Atg7 cKO mice compared to Atg7 cWT mice, while statistical significance was not reached (P > 0.05) (). Since evidence of systemic inflammation suggested the possibility of systemic infection, we studied the presence of bacterial 16S rRNA genes in the liver and systemic lymphoid organ. The content of bacterial 16S rRNA genes was significantly increased in the liver of Atg7 cKO mice compared to Atg7 cWT mice (P < 0.05) (), suggesting increased bacterial invasion into the liver parenchymal tissue of Atg7 cKO mice. The content of bacterial 16S rRNA genes also appeared to be increased in the mesenteric lymph nodes and spleen of Atg7 cKO mice compared to Atg7 cWT mice, while the statistical significance was not reached (P > 0.05) ().
Figure 7. Systemic inflammation and bacterial invasion after DSS treatment. (A) Serum levels of cytokines after DSS treatment were determined by ELISA (n = 6 each). (B) Relative expression of bacterial 16S rRNA genes in the liver, mesenteric lymph node and spleen determined by quantitative PCR as described in Materials and Methods (n = 9 each). *, P < 0.05.
Discussion
We observed that myeloid cell-specific autophagy is an important element in the modulation of adipose tissue inflammation and insulin resistance associated with lipid injury. While the susceptibility of mice with myeloid cell-specific disruption of essential autophagy genes to infectious agents has been widely studied,Citation45,46 metabolic abnormalities associated with myeloid cell-specific autophagy deficiency have not been clearly shown. A recent paper reports that myeloid cell-specific Atg5 deletion leads to increased tissue inflammation and injury specifically in the liver after high-fat diet feeding in combination with LPS administration.Citation47 However, the role of myeloid cell autophagy in metainflammation of tissues other than liver or in the development of T2D has not been demonstrated. The glucose profile of Atg5 cKO mice fed high-fat diet is not higher than that of Atg5 cWT mice fed high-fat diet.Citation47 The dissimilar glucose profile between Atg5 cKO mice fed high-fat diet and Atg7 cKO-ob/ob mice appears to be due to the difference between high-fat diet and obesity due to Lep knockout in ob/ob mice. Obesity due to LEP deficiency can impose more severe metabolic stress compared to high-fat diet. LEP deficiency may cause additional metabolic or immunological abnormalities that are not seen in mice fed high-fat diet.Citation48 Here, we clearly show that myeloid cell-specific autophagy deficiency led to the development of T2D in obese mice that otherwise did not develop overt T2D. Myeloid cells that play dominant roles in the development of obesity-induced diabetes appear to be Mφs as was shown in the current in vitro investigation. However, the role of other myeloid cells such as dendritic cells or granulocytes that are target cells of Cre-mediated gene deletion in Atg7 cKO miceCitation49 cannot be totally eliminated, as both granulocytes and dendritic cells participate in the insulin resistance associated with obesity.Citation50,51
The development of T2D in Atg7 cKO-ob/ob mice but not in lean Atg7 cKO mice suggests that autophagy-deficient myeloid cells do not display significant inflammatory phenotypes in the basal state, but show proinflammatory features in the presence of activators of inflammation or metabolic stress. Thus, autophagy-deficient Mφs appear to be susceptible to inflammasome activators such as lipids, which is the reason Atg7 cKO mice show increased inflammatory features and overt T2D when they become obese. Previous papers show that lipids such as fatty acids or cholesterol are efficient activators of the inflammasome complex.Citation6,10,52 While the detailed molecular mechanism of lipid-induced inflammasome activation remains to be investigated, mitochondrial dysfunction induced by fatty acids in combination with LPS likely plays an important role in inflammasome activation, which was exemplified by the markedly decreased NAD+:NADH ratio and increased mitochondrial ROS content, consistent with previous papers.Citation12,24 An in vivo source of TLR (toll-like receptor) ligands which are essential for efficient stimulation of inflammasome in addition to lipid, could be a low-level endotoxin owing to altered intestinal barrier functionCitation53,54 or AHSG (α-2-HS-glycoprotein) that can activate TLR in complex with lipids.Citation55 All these results suggest that inflammasome activation due to lipid or obesity could be a crucial event in obesity-induced insulin resistance by enhancing the release of IL1B as an effector molecule of insulin resistance, which can be exacerbated by autophagy deficiency of myeloid cells. However, as deficiency of IL18, another product of inflammasome or NLPR3 activation, has been reported to induce obesity and insulin resistance,Citation56 general role of inflammasome or NLRP activation in the pathogenesis of metabolic syndrome and T2D still remains to be clarified.
The main mechanism of T2D in Atg7 cKO-ob/ob mice appears to be aggravated insulin resistance due to increased inflammasome activation and increased IL1B production associated with autophagy deficiency. Furthermore, a suppressed Treg cell fraction in the SVF of white adipose tissue from Atg7 cKO-ob/ob mice compared to Atg7 cWT-ob/ob mice might also contribute to augmented tissue inflammation and insulin resistance in insulin target tissues such as adipose tissue.Citation29 The mechanism of a further decrease in Treg cells in white adipose tissue of Atg7 cKO-ob/ob mice is not clear, and may involve degradation of mature IL33 by increased production of active CASP1.Citation57 A recent paper reported decreased glucose utilization by expansion of adipose tissue Treg cells in age-associated insulin resistance; however, such findings may not be relevant in obesity-associated insulin resistance.Citation58
Previous papers have reported that IL1B blockade improves glucose homeostasis by reducing insulin resistance and enhancing β-cell function.Citation59,60 In contrast, the role of deteriorated β-cell function in the development of diabetes in Atg7 cKO-ob/ob mice was not evident. Since the oligomer of amyloidogenic human-type IAPP (islet amyloid polypeptide) but not nonamyloidogenic murine IAPP can induce inflammasome activation,Citation61 the role of inflammasome activation with or without autophagy deficiency may be more prominent in human T2D rather than murine T2D.Citation61,62 While impairment of β-cell function may not be the primary cause of diabetes in Atg7 cKO-ob/ob mice, the insulinogenic index was not further increased in Atg7 cKO-ob/ob mice compared to Atg7 cWT-ob/ob mice despite aggravated insulin resistance, suggesting that β-cell response to increased insulin resistance was not adequate in Atg7 cKO-ob/ob mice. More pronounced islet inflammation in Atg7 cKO-ob/ob mice compared to Atg7 cWT-ob/ob mice might be responsible for such an insufficient response to insulin resistance.
Previous papers report exacerbation of experimental colitis in mice with systemic autophagy insufficiency or after transplantation of autophagy-deficient hematopoietic cells.Citation36,63,64 Here, we directly demonstrated aggravated experimental colitis in myeloid cell-specific autophagy-knockout mice, leading to increased mortality. In addition, we observed apparently increased colonic tissue expression of pro-Il1b and Il6 that are important players in colitis of DSS-treated Atg7 cKO mice compared to Atg7 cWT mice,Citation36-38 while the induction of Il6 was marginal. The expression of chemokines such as Ccl2 and Cxcl1 was also upregulated in the colon of DSS-treated Atg7 cKO mice, which is consistent with their role in chemotaxis and colitis.Citation39,41 Aggravated inflammation in DSS-treated Atg7 cKO mice compared to Atg7 cWT mice might be related to the recently reported colitogenic role of IL18 that can be produced through the inflammasome in DSS-induced colitis.Citation65 We also observed skewing toward Th1 in colonic lamina propria of DSS-treated Atg7 cKO mice compared to Atg7 cWT mice. Th17 skewing was not observed in colonic lamina propria of DSS-treated Atg7 cKO mice despite the increased expression of pro-Il1b and Il6 that are important components in Th17 differentiation,Citation44,66 which could be due to the absence of Tgfb induction in colonic lamina propria of DSS-treated Atg7 cKO mice. Tgfb has been reported as an indispensable factor in Th17 skewing.Citation44,66 While Th17 cells are important in diverse IBD models,Citation67,68 recent papers show a critical role for Th1 cells rather than Th17 cells as effectors in DSS-induced colitis.Citation69,70 In addition to the upregulated expression of cytokines in the colonic tissue, serum levels of IL1B were also elevated in DSS-treated Atg7 cKO mice compared to Atg7 cWT mice, suggesting systemic inflammation probably due to the impaired gut barrier function after DSS treatment particularly in Atg7 cKO mice. Serum levels of IL6 and TNF appeared increased in DSS-treated Atg7 cKO mice, while statistical significance was marginal. Since evidence of systemic inflammation suggested the possibility of systemic microbial invasion, we studied the presence of bacterial 16S rRNA genes in the liver and lymphoid organ. The content of bacterial 16S rRNA genes was significantly increased in the liver of DSS-treated Atg7 cKO mice compared to Atg7 cWT mice, suggesting bacterial invasion of the liver parenchymal tissue probably through the portal vein. These results indicate that autophagy deficiency in myeloid cells of the intestine predispose the host to the systemic infection and sepsis when the intestinal barrier is disrupted.
Altogether, these results suggest that autophagy deficiency in myeloid cells is a factor not only in the progression from obesity to diabetes and but also in colitis. The western diet that has been incriminated as a cause of pandemics of metabolic syndrome is also a risk factor for IBD.Citation23 Since lipid is a target of autophagy and in turn affects autophagy,Citation1,5 lipid excess in conjunction with autophagy dysfunction due to aging or genetic predisposition could be a common cause of metabolic syndrome and colitis, and autophagy modulators may have a therapeutic potential against these diseases.
Materials and methods
Mice
To generate Atg7 cKO mice with myeloid cell-specific deletion of Atg7, an essential autophagy gene, Atg7 cWT mice (kindly provided by Dr. Komatsu at Niigata University, Japan) of the C57BL/6 background were crossed with Lys-Cre mice with myeloid cell-specific Cre recombinase expression owing to targeted insertion of the Cre cDNA into the lysozyme M locus (Jackson Laboratory).Citation49 Cre-mediated deletion of Atg7 was confirmed by PCR using genomic DNA from peritoneal Mφs and primers flanking the floxed region as previously reported.Citation14 Atg7 cKO-ob/ob mice were generated by crossing Atg7 cKO mice to ob/w (heterozygous Lep knockout) mice twice. Blood glucose levels were determined using a One Touch glucometer (Lifescan Inc., Chesterbrook, PA, USA). We defined ‘diabetes’ as a single measurement of nonfasting blood glucose level above 17.6 mM or 3 consecutive measurement of nonfasting blood glucose level above 12.8 mM. IPGTT and ITT were performed by injecting 1 g/kg glucose (Amresco, 0188) to overnight fasted mice and injecting 0.75 U/kg of regular insulin (Lilly, HI0210) to mice fasted for 6 h, respectively.Citation14,71 To calculate the relative β-cell mass, point counting morphometry was performed after insulin immunohistochemistry of more than 3 parallel sections of different cut levels containing more than 30 pancreatic islets.Citation14 The insulinogenic index was calculated as (Δinsulin15 min /Δglucose15 min).Citation14
Experimental colitis was induced by the administration of 2.5 to 4.0% (w/v) DSS (MP Biologicals, 02160110) dissolved in sterile distilled water for 5 d. On day 3, the DSS solution was replaced with a fresh solution. On d 7, mice were sacrificed for colitis assessment. To study the role of intestinal microbiota in colitis, antibiotic mixture consisting of vancomycin (10 mg/kg; Sigma, V2002), neomycin (30 mg/kg; Sigma, N6386), carbenicillin (50 mg/kg; Sigma, C1389), and metronidazole (50 mg/kg; Sigma, M3761) was administered orally every day since 2 d before DSS administration for a total of 9 d.
All animal experiments were conducted in accordance with the Public Health Service Policy in Humane Care and Use of Laboratory Animals. Mouse experiments were approved by the IACUC of Samsung Medical Center Animal Facility, an AAALAC-accredited unit.
Mφ isolation
Primary peritoneal Mφs were isolated from 2- to 3-mo-old mice 3 d after intraperitoneal injection of 3.85% thioglycollate (Becton Dickinson, 4311260), and were then plated on culture plates for incubation at 37°C overnight.Citation72 After removal of nonadherent cells by repeated washing, adherent cells were cultured in RPMI 1640 (Lonza, 12-702F) supplemented with 10% fetal bovine serum (FBS; Gibco, 16000-044), 2 mM L-glutamine (Lonza, 17-605E) and 100 IU/ml penicillin-streptomycin (Lonza, 17-745E) for further experiments.
ELISA
Serum insulin levels before and 15 min after 1g/kg glucose challenge were determined using an ELISA kit (Shibayagi Co., AKRIN-011T) to calculate the insulinogenic index, as above. IL1B levels in the culture supernatant were measured using an ELISA kit from R&D Systems. Serum IL1B, IL6 and TNF levels were determined using ELISA kits (R&D Systems, DY401, DY406, and DY410, respectively).
Western blotting
Western blot analysis was performed as previously described using anti-ATG7 (Cell Signaling Technology, 2631), -MAP1LC3A/B (Novus Biologicals, NB 100-2331), -SQSTM1 (Progen Biotechnik, GP62-C), -IL1B (Santa Cruz Biotechnology, SC-7884), -CASP1 p10 (Santa Cruz Biotechnology, SC-514) and -ACTB (actin, β; Santa Cruz Biotechnology, SC-47778) Abs (antibodies).
RT-PCR
RNA was prepared from cells or tissues using TRIzol Reagent (Ambion, 15596018). RNA from paraffin-embedded tissue blocks was prepared using a formalin-fixed paraffin-embedded kit (Qiagen, 56404). cDNA was synthesized using M-MLV reverse transcriptase (Promega, M17013) and oligo(dT)12–18 primer. The expression of Atg7, Tnf, Il6, pro-Il1b, Adgre1, Tgfb, Ccl2, Ccl5, Cxcl1 and Actb was assessed by quantitative PCR using specific primer sets. Quantitative RT-PCR based on SYBR Premix EX Taq™ (Takara, RR420A) was carried out using the QuantStudio3 (Applied Biosystems, Waltham, MA, USA).
ROS content and NAD+: NADH ratio
Mitochondria-specific ROS was determined by flow cytometry using a FACSCalibur flow cytometer (BD Biosciences, San Jose, CA, USA) after staining with 5 μM MitoSOX™ Red (Invitrogen, M36008) for 10 min at 37°C.Citation25 NAD+:NADH ratio was determined using a commercial kit (BioVision, K337-100) according to the manufacturer's recommendation.
Stromal vascular fraction (SVF)
For isolation of the SVF, epididymal adipose tissue representing visceral adipose tissue was cut into small pieces of approximately 2 mm. After incubation in a 2 mg/ml type 2 collagenase solution (Worthington Biochemical, LS004174) at 37°C in a water bath for 45 min, digested tissue was centrifuged at 1,000 g for 8 min. After filtering through a 70 μm mesh and RBC lysis, SVF was suspended in a DPBS (Dulbecco Phosphate Buffered Saline; Welgene, LB 001–02) supplemented with 2% BSA (Roche, 10 775 835 001), 2 mM EDTA (Cellgro, 46-034-CI) for further experiments.
Treg cells and FACS
Treg cell fraction of the SVF of adipose tissue was determined as published.Citation54 In brief, after filtering and RBC lysis of the resuspended SVF pellet as above, cells in the SVF were resuspended in FACS buffer (2 mM EDTA, 2% FBS in DPBS). After Fc blocking, cells were incubated with a mixture of anti-CD3E, -CD4 and -IL2RA Abs (eBioscience, 12-0031-82, 12-0042082, and 12-0251-82, respectively) in FACS buffer at 4°C for 30 min. After permeabilization, cells were incubated with anti-mouse/rat FOXP3 (FJK-16s) Ab (eBioscience, 12-5773-82) at 4°C for 30 min, and then triple-color flow cytometry was performed using a FACSVerse flow cytometer (BD Biosciences, San Jose, CA, USA). Data were analyzed with FlowJo software (Tree Star, Inc., Ashland, OR, USA). Suppressive activity of Treg cells was determined as described with modifications.Citation73 After RBC lysis of SVF cells, CD4+ IL2RA+ Treg cells were obtained using a MACS Regulatory T cell isolation kit (Miltenyl Biotech, 130-091-041) according to the manufacturer's recommendation. In brief, CD4+ T cells were purified by negative-selection method depleting non-CD4+ T cells. CD4+ T cells were labeled with PE-conjugated anti-IL2RA Ab and, next with anti-PE microbeads (Miltenyl Biotech, 130-091-041) for positive selection of CD4+ IL2RA+ cells using a magnetic column. Non-CD4+ T cells and CD4+ IL2RA− cells were obtained from the spleen of C57BL/6 mice using the same methods to be used as APCs (antigen-presenting cells) and Teff (T effector) cells, respectively. Graded numbers of CD4+ IL2RA+ Treg cells were cocultured with 5 × 10⁴ CD4+ IL2RA− T cells labeled with 5 μM CFSE (carboxyfluorescein succinimidyl ester; eBioscience, 65–0850) for 5 min and 1 × 10⁵ APCs irradiated 30 Gy (X-RAD 320, North Branford, CT, USA) in the presence of 1 μg/ml soluble anti-CD3E Ab (BD Pharmingen, 553057) for a total of 3 d. Cells were analyzed for CFSE dilution by flow cytometry.
To evaluate T helper skewing in colitis, large intestines were opened longitudinally and washed in ice-cold DPBS. After washing with DPBS, tissues were transferred to flask containing 10% FBS, 10mM EDTA in DPBS. After vigorous shaking, tissues were passed through a strainer. Tissues were then minced in 10 ml RPMI 1640 containing 0.5 mg collagenase D (Roche, 11 088 866 001) and DNase I (Roche, 11 284 932 001). After stirring for 20 min at 37°C, the supernatant fraction was collected for a total of 3 times. After centrifugation at 520 g for 5 min, the cell pellet was washed and resuspended in RPMI containing 2% FBS. Colonic lamina propria mononuclear cells were purified on a 40%/75% Percoll (GE Healthcare Life Sciences, 17-0891-01) gradient by centrifugation at 25°C, 930 g for 20 min. Cells were resuspended in FACS buffer. After Fc blocking with anti-mouse FCGR3/CD16 and FCGR2B/CD32 (eBioscience, 14-0161-85), cells were incubated with a mixture of anti-CD3E and -CD4 in FACS buffer at 4°C for 30 min. Cells were stimulated with phorbol 12-myristate 13-acetate (Sigma, P8139), ionomycin (Sigma, I9657) and GolgiStop (BD Biosciences, 554724) for 5 h. After washing, cells were incubated with anti-IL17A (eBioscience, 11-7177-81) and -IFNG Ab (eBioscience, 12-7311-82) at 4°C for 30 min. Samples were acquired on a FACSCalibur flow cytometer (BD Biosciences, San Jose, CA, USA) equipped with CellQuest software (BD Biosciences). Data were analyzed with FlowJo software (Tree Star, Inc.).
Histology
In adipose tissue, Mφ aggregates containing up to 15 Mφs surrounding each adipocyte were considered as CLSs, and the number of CLSs per 100 adipocytes was counted as described.Citation74 To evaluate colitis, the colons were washed, fixed in 10% buffered formaldehyde, and embedded in paraffin for H&E staining. The degree of inflammation (score 0 to 3) was evaluated by a pathologist in a blinded fashion (occasional inflammatory cells in the lamina propria = 0; increased number of inflammatory cells in the lamina propria = 1; confluence of inflammatory cells extending into the submucosa = 2; and transmural extension of the infiltrate = 3). The degree of tissue damage was evaluated in the same manner (no mucosal damage = 0; lymphoepithelial lesion = 1; surface mucosal erosion or focal ulceration= 2; and extensive mucosal damage and extension into deeper structure= 3). Summation of inflammation and tissue damage scores were designated as the colitis score (0 to 6).Citation34
DNA extraction and quantification of bacteria by quantitative PCR
The liver, spleen and mesenteric lymph nodes were obtained from mice 7 d after DSS treatment, and immediately frozen and stored at −80°C. Genomic DNA was extracted from 0.5 g of each sample using a DNA extraction method.Citation75 Proteinase K (GeneAll Biotechnology, 392–001) was added in the cell lysis step. Total bacterial DNA was quantified by quantitative PCR using the following 16S rRNA universal primers: 16SDPO-forward 5′-AGAGTTTGATCMTGGCTCA-I-I-I-I-I-AACGCT-3′; 16SDPO-reverse 5′-CGCGGCTGCTGGCA-I-I-I-A-I-TTRGC-3′ or EUBAC-forward, 5′-TCCTACGGGAGGCAGCAGT-3′; EUBAC-reverse, 5′-GGACTACCAGGGTATCTAATCCTGTT-3′ as previously reported.Citation76,77 Quantitative PCR for total bacteria were carried out using a SYBR Premix EX Taq™ and ABI PRISM 7300 quantitative PCR System (Applied Biosystems, Waltham, MA, USA).
Statistical analysis
All values were expressed as means ± SD. A two-tailed Student t test was employed to compare the values between groups. Survival of mice after colitis induction was plotted according to the Kaplan-Meier method and compared using the log-rank test. P values less than 0.05 were considered significant.
Abbreviations
| Ab | = | antibody |
| ADGRE1 | = | adhesion G protein-coupled receptor E1 |
| ATG7 | = | autophagy related 7 |
| AUC | = | area under the curve |
| CASP1 | = | caspase 1 |
| CCL2 | = | chemokine (C-C motif) ligand 2 |
| CFSE | = | carboxyfluorescein succinimidyl ester |
| CLS | = | crown-like structure |
| CXCL1 | = | chemokine (C-X-C motif) ligand 1 |
| DSS | = | dextran sodium sulfate |
| ER | = | endoplasmic reticulum |
| FOXP3 | = | forkhead box P3 |
| IBD | = | inflammatory bowel disease |
| IL1B | = | interleukin 1 beta |
| IL6 | = | interleukin 6 |
| IL17A | = | interleukin 17A |
| IL2RA | = | interleukin 2 receptor, alpha chain |
| IFNG | = | interferon gamma |
| IPGTT | = | intraperitoneal glucose tolerance test |
| ITGAM | = | integrin alpha M |
| ITT | = | insulin tolerance test |
| MAP1LC3A/B | = | microtubule-associated protein 1 light chain 3, alpha/beta |
| LPS | = | lipopolysaccharide |
| Mφ | = | macrophage |
| NAD | = | nicotinamide adenine dinucleotide |
| NLRP3 | = | NLR family, pyrin domain containing 3 |
| PA | = | palmitic acid |
| ROS | = | reactive oxygen species |
| SVF | = | stromal vascular fraction |
| T2D | = | type 2 diabetes |
| Th | = | T helper |
| TLR | = | toll-like receptor |
| TGFB | = | transforming growth factor, beta |
| TNF | = | tumor necrosis factor |
| Treg | = | regulatory T |
Disclosure of potential conflicts of interest
No potential conflicts of interest were disclosed.
1184799_Supplemental_Material.pdf
Download PDF (356.7 KB)Funding
This study was supported by the Global Research Laboratory Grant of the National Research Foundation of Korea (NRF-2010-00347) and the Samsung Biomedical Research Institute grant (C-B1-120). M-SL is the recipient of the Ulsan National Institute of Science and Technology Research Fund (2014M3A9D8034459) and the Bio & Medical Technology Development Program Fund of the National Research Foundation (NRF-2015M3A9B6073846).
Related Research Data
References
- Mizushima N, Komatsu M. Autophagy: renovation of cells and tissues. Cell 2011; 147:728-41; PMID:22078875; http://dx.doi.org/10.1016/j.cell.2011.10.026
- Ozcan U, Cao Q, Yilmaz E, Lee A-H, Iwakoshi NN, Ozdelen E, Tuncman G, Gorgun C, Glimcher LH, Hotamisligil GS. Endoplasmic reticulum stress links obesity, insulin action, and type 2 Diabetes. Science 2004; 306:457-61; PMID:15486293; http://dx.doi.org/10.1126/science.1103160
- Petersen KF, Befroy D, Dufour S, Dziura J, Ariyan C, Rothman DL, DiPietro L, Cline GW, Shulman GI. Mitochondrial dysfunction in the elderly: possible role in insulin resistance. Science 2003; 300:1140-2; PMID:12750520; http://dx.doi.org/10.1126/science.1082889
- Quan W, Hur KY, Lim Y, Oh SH, Lee J-C, Kim HC, Kim G-H, Kim S-H, Kim HL, Lee M-K, et al. Autophagy deficiency in beta cells leads to compromised unfolded protein response and progression from obesity to diabetes in mice. Diabetologia 2012; 55:392-403; PMID:22075916; http://dx.doi.org/10.1007/s00125-011-2350-y
- Kim KH, Lee M-S. Autophagy-a key player in cellular and body metabolism. Nat Rev Endocrinol 2014; 10:322-37; PMID:24663220; http://dx.doi.org/10.1038/nrendo.2014.35
- Lim Y-M, Lim H-J, Hur KY, Quan W, Lee H-Y, Cheon H, Ryu D, Koo SH, Kim HL, Kim J, et al. Systemic autophagy insufficiency compromises adaptation to metabolic stress and facilitates progression from obesity to diabetes. Nat Commun 2014; 5:4934; PMID:25255859; http://dx.doi.org/10.1038/ncomms5934
- Johnson AMF, Olefsky JM. The origins and drivers of insulin resistance. Cell 2013; 152:673-84; PMID:23415219; http://dx.doi.org/10.1016/j.cell.2013.01.041
- Stienstra R, van Diepen JA, Tack CJ, Zaki MH, van de Veerdonk FL, Perera D, Neale GA, Hooiveld GJ, Hijmans A, Vroegrijk I, et al. Inflammasome is a central player in the induction of obesity and insulin resistance. Proc Natl Acad Sci USA 2011; 108:15324-9; PMID:21876127; http://dx.doi.org/10.1073/pnas.1100255108
- Vandanmagsar B, Youm Y-H, Ravussin A, Galgani JE, Stadler K, Mynatt RL, Ravussin E, Stephens JM, Dixit WD. The NLRP3 inflammasome instigate obesity-induced inflammation and insulin resistance. Nat Med 2011; 15:179-88; PMID:21217695; http://dx.doi.org/10.1038/nm.2279
- Wen H, Gris D, Lei Y, Jha S, Zhang L, Huang MT, Brickey WJ, Ting JP. Fatty acid-induced NLRP3-ASC inflammasome activation interferes with insulin signaling. Nat Immunol 2011; 12:408-15; PMID:21478880; http://dx.doi.org/10.1038/ni.2022
- Shi CS, Shenderov K, Huang NN, Kabat J, Abu-Asab M, Fitzgerald KA, Sher A, Kehrl JH. Activation of autophagy by inflammatory signals limits IL-1β production by targeting ubiquitinated inflammasomes for destruction. Nat Immunol 2012; 13:255-63; PMID:22286270; http://dx.doi.org/10.1038/ni.2215
- Zhou R, Yazdi AS, Menu P, Tshopp J. A role for mitochondria in NLRP3 inflammasome activation. Nature 2011; 469:221-6; PMID:21124315; http://dx.doi.org/10.1038/nature09663
- Ebato C, Uchida T, Arakawa M, Komatsu M, Ueno T, Komiya K, Azuma K, Hirose T, Tanaka K, Kominami E, et al. Autophagy is important in islet homeostasis and compensatory increase of beta cell mass in response to high-fat diet. Cell Metab 2008; 8:325-32; PMID:18840363; http://dx.doi.org/10.1016/j.cmet.2008.08.009
- Jung HS, Chung KW, Kim JW, Kim J, Komatsu M, Tanaka K, Nguyen YH, Kang TM, Yoon KH, Kim JW, et al. Loss of autophagy diminishes pancreatic b-cell mass and function with resultant hyperglycemia. Cell Metab 2008; 8:318-24; PMID:18840362; http://dx.doi.org/10.1016/j.cmet.2008.08.013
- Kaushik S, Rodriguez-Navarro JA, Arias E, Kiffin R, Sahu S, Schwartz GJ, Cuervo AM, Singh R. Autophagy in hypothalamic AgRP neurons regulates food intake and energy balance. Cell Metab 2011; 14:173-83; PMID:21803288; http://dx.doi.org/10.1016/j.cmet.2011.06.008
- Kim KH, Jeong YT, Oh H, Kim S-H, Cho JM, Kim Y-N, Kim SS, Kim DH, Hur KY, Kim HK, et al. Autophagy deficiency leads to protection from obesity and insulin resistance by inducing FGF21 as a ‘mitokine’. Nat Med 2013; 19:83-92; PMID:23202295; http://dx.doi.org/10.1038/nm.3014
- Quan W, Kim H-K, Moon E-Y, Kim SS, Choi CS, Komatsu M, Jeong YT, Lee M-K, Kim K-W, Kim M-S, et al. Role of hypothalamic proopiomelanocortin neuron autophagy in the control of appetite and leptin response. Endocrinology 2012; 153:1817-26; PMID:22334718; http://dx.doi.org/10.1210/en.2011-1882
- Singh R, Kaushik S, Wang Y, Xiang Y, Novak I, Komatsu M, Tanaka K, Cuervo AM, Czaja MJ. Autophagy regulates lipid metabolism. Nature 2009; 458:1131-5; PMID:19339967; http://dx.doi.org/10.1038/nature07976
- Singh R, Xiang Y, Wang Y, Baikati K, Cuervo AM, Luu YK, Tang Y, Pessin JE, Schwartz GJ, Czaja MJ. Autophagy regulates adipose mass and differentiation in mice. J Clin Invest 2009; 119:3329-39; PMID:19855132; http://dx.doi.org/10.1172/JCI35541
- Yang L, Li P, Fu S, Calay ES, Hotamisligil GS. Defective hepatic autophagy in obesity promotes ER stress and causes insulin resistance. Cell Metab 2010; 11:467-78; PMID:20519119; http://dx.doi.org/10.1016/j.cmet.2010.04.005
- Zhang Y, Goldman S, Baerga R, Zhao Y, Komatsu M, Jin S. Adipose-specific deletion of autophagy-related gene 7 (atg7) in mice reveals a role in adipogenesis. Proc Natl Acad Sci USA 2009; 106:19860-5
- Massey DCO, Parkes M. Genome-wide association scanning highlights two autophagy genes, ATG16L1 and IRGM, as being significantly associated with Crohn's disease. Autophagy 2007; 3:649-51; PMID:17921695; http://dx.doi.org/10.4161/auto.5075
- Molodecky NA, Kaplan GG. Environmental risk factors for inflammatory bowel disease. Gastroenterol Hepatol 2010; 6:339-46
- Misawa T, Takahama M, Kozaki T, Lee H, Zou J, Saitoh T, Akira S. Microtubule-driven spatial arrangement of mitochondria promotes activation of the NLRP3 inflammasome. Nat Immunol 2013; 14:454-60; PMID:23502856; http://dx.doi.org/10.1038/ni.2550
- Kim KH, Jeong YT, Kim SH, Lee H-Y, Jung HS, Park KS, Lee M-S. Metformin-induced inhibition of the mitochondrial respiratory chain increases FGF21 expression via ATF4 activation. Biochem Biophys Res Com 2013; 440:76-81; PMID:24041694; http://dx.doi.org/10.1016/j.bbrc.2013.09.026
- Schroder K, Tschopp J. The inflammasomes. Cell 2010; 140:821-32; PMID:20303873; http://dx.doi.org/10.1016/j.cell.2010.01.040
- Strissel KJ, Stancheva Z, Miyoshi H, Perfield II JW, DeFuria J, Jick Z, Greenberg AS, Obin MS. Adipocyte death, adipose tissue remodeling, and obesity complications. Diabetes 2010; 56:2910-8; PMID:17848624; http://dx.doi.org/10.2337/db07-0767
- Youm Y-H, Adijiang A, Vandanmagsar B, Burk D, Ravussin A, Dixit VM. Elimination of the NLRP3-ASC inflammasome protects against chronic obesity-induced pancreatic damage. Endocrinology 2012; 152:4039-45; PMID: 21862613; http://dx.doi.org/10.1210/en.2011-1326
- Feuerer M, Herrero L, Cipolletta D, Naaz A, Wong J, Nayer A, Lee J, Goldfine AB, Benoist C, Shoelson S, et al. Lean, but not obese, fat is enriched for a unique population of regulatory T cells that affect metabolic parameters. Nat Med 2009; 15:930-9; PMID:19633656; http://dx.doi.org/10.1038/nm.2002
- O'Sullivan BJ, Thomas HE, Pai S, Santamaria P, Iwakura Y, Steptoe R, Kay TWH, Thomas R. IL-1b breaks tolerance through expansion of CD25+ effector T cells. J Immunol 2006; 176:7278-87; PMID:16751371; http://dx.doi.org/10.4049/jimmunol.176.12.7278
- Yang XO, Nurieva R, Martinez GJ, Kang HS, Chung Y, Pappu BP, Shah B, Chang SH, Schluns KS, Watowich SS, et al. Molecular antagonism and plasticity of regulatory and inflammatory T cell programs. Immunity 2008; 29:44-56; PMID:18585065; http://dx.doi.org/10.1016/j.immuni.2008.05.007
- Tang Q, Adams JY, Penaranda C, Melli K, Piaggio E, Sgouroudis E, Piccirillo CA, Salomon BL, Bluestone JA. Central role of defective interleukin-2 production in the triggering of islet autoimmune destruction. Immunity 2008; 28:687-97; PMID:18468463; http://dx.doi.org/10.1016/j.immuni.2008.03.016
- Farache J, Zigmond E, Shakhar G, Jung S. Contributions of dendritic cells and macrophages to intestinal homeostasis and immune defense. Immunol Cell Biol 2013; 91:232-9; PMID:23399695; http://dx.doi.org/10.1038/icb.2012.79
- Zaki MH, Boyd K, Vogel P, Kastan MB, Lamkanfi M, Kanneganti TD. The NLRP3 inflammatome protects against loss of epithelial integrity and mortality during experimental colitis. Immunity 2010; 32:379-91; PMID:20303296; http://dx.doi.org/10.1016/j.immuni.2010.03.003
- Bauer C, Duewell P, Mayer C, Lehr HA, Fitzgerald KA, Dauer M, Tschopp J, Endres S, Latz E, Schnurr M. Colitis induced in mice with dextran sulfate sodium (DSS) is mediated by the NLRP3 inflammasome. Gut 2010; 59:1192-9; PMID:20442201; http://dx.doi.org/10.1136/gut.2009.197822
- Saitoh T, Fujita N, Jang MH, Uematsu S, Yang BG, Satoh T, Omori H, Noda T, Yamamoto N, Komatsu M, et al. Loss of the autophagy protein Atg16L1 enhances endotoxin-induced IL-1beta production. Nature 2008; 456:264-9; PMID:18849965; http://dx.doi.org/10.1038/nature07383
- Siegmund B, Lehr HA, Fantuzzi G, Dinarello CA. IL-1b-converting enzyme (caspase-1) in intestinal inflammation. Proc Natl Acad Sci USA 2001; 98:13249-54; PMID:11606779; http://dx.doi.org/10.1073/pnas.231473998
- Yamamoto M, Yoshizaki K, Kishimoto T, Itoh H. IL-6 is required for the development of Th1 cell-mediated murine colitis. J Immunol 2000; 164:4878-82; PMID:10779797; http://dx.doi.org/10.4049/jimmunol.164.9.4878
- Khan WI, Motomura Y, Wang H, El-Sharkawy RTE, Verdu EF, Verma-Gandhu M, Rollins BJ, Collins SM. Critical role of MCP-1 in the pathogenesis of experimental colitis in the context of immune and enterochromaffin cells. Am J Physiol 2006; 291:G803-11; PMID:16728728; http://dx.doi.org/10.1152/ajpcell.00457.2005
- Kim YG, Kamada N, Shaw MW, Warner N, Chen GY, Franchi L, Nunez G. The NOD2 sensor promotes intestinal pathogen eradication via the chemokine CCL2-dependent recruitment of inflammatory monocytes. Immunity 2011; 34:769-80; PMID:21565531; http://dx.doi.org/10.1016/j.immuni.2011.04.013
- Ranganathan P, Jayakumar C, Manicassamy S, Ramesh G. CXCR2 konkcout mice are protected against DSS-colitis-induced acute kidney injury and inflammation. Am J Physiol 2013; 305:F1422-7
- Alex P, Zachos NC, Nguyen T, Gonzales L, Chen T-E, Conklin LS, Cantola M, Li X. Distinct cytokine patterns identified from multiplex profiles of murine DSS and TNBS-induced colitis. Inflamm Bowel Dis 2009; 15:341-52; PMID:18942757; http://dx.doi.org/10.1002/ibd.20753
- Fuss IJ, Becker C, Yang Z, Groden C, Hurnung RL, Heller F, Neurath MF, Strober W, Mannon PJ. Both IL-12p70 and IL-23 are synthesized during active Crohn's disease and are down-regulated by treatment with anti-IL-12 p40 monoclonal antibody. Inflamm Bowel Dis 2006; 12:9-15; PMID:16374252; http://dx.doi.org/10.1097/01.MIB.0000194183.92671.b6
- Kimura A, Kishomoto T. Th17 cells in inflammation. Int Immunopharmacol 2011; 11:319-22; PMID:21035432; http://dx.doi.org/10.1016/j.intimp.2010.10.004
- Yang CS, Kim JJ, Lee HM, Jin HS, Lee SH, Park JH, Kim SJ, Kim JM, Han YM, Lee MS, et al. The AMPK-PPARGC1A pathway is required for antimicrobial host defense through activation of autophagy. Autophagy 2014; 10: in press
- Zhao Z, Fux B, Goodwin M, Dunay IR, Strong D, Miller BC, Cadwell K, Delgado MA, Ponpuak M, Green KG, et al. Autophagosome-independent essential function for the autophagy protein Atg5 in cellular immunity to intracellular pathogens. Cell Host Microbe 2008; 4:458-69; PMID:18996346; http://dx.doi.org/10.1016/j.chom.2008.10.003
- Liu K, Zhao E, Ilyas G, Lalazar G, Lin Y, Haseeb M, Tanaka KE, Czaja MJ. Impaired macrophage autophagy increases the immune response in obese mice by promoting proinflammatory macrophage polarization. Autophagy 2015; 11:271-84; PMID:25650776; http://dx.doi.org/10.1080/15548627.2015.1009787
- Luan B, Goodarzi MO, Phillips NG, Guo X, Chen YD, Yao J, Allison M, Rotter JI, Shaw R, Montminy M. Leptin-mediated increases in catecholamine signaling reduce adipose tissue inflammation via activation of macrophage HDAC4. Cell Metab 2014; 19:1058-65; PMID:24768298; http://dx.doi.org/10.1016/j.cmet.2014.03.024
- Clausen BE, Burkhardt C, Reith W, Renkawitz R, Förster I. Conditional gene targeting in macrophages and granulocytes using LysMcre mice. Transgenic Res 1999; 8:265-77; PMID:10621974; http://dx.doi.org/10.1023/A:1008942828960
- Talukdar S, Oh DY, Bandyopadhyay G, Li D, Xu J, McNelis J, Lu M, Li P, Yan Q, Zhu Y, et al. Neutrophils mediate insulin resistance in mice fed a high-fat diet through secreted elastase. Nat Med 2012; 18:1407-12; PMID:22863787; http://dx.doi.org/10.1038/nm.2885
- Yekollu SK, Thomas R, O'Sullivan B. Targeting curcusomes to inflammatory dendritic cells inhibits NF-κB and improves insulin resistance in obese mice. Diabetes 2011; 60:2928-38; PMID:21885868; http://dx.doi.org/10.2337/db11-0275
- Razani B, Feng C, Coleman T, Emanuel R, Wen H, Hwang S, Ting JP, Virgin HW, Kastan MB, Semenkovich CF. Autophagy links inflammasomes to atherosclerotic progression. Cell Metab 2012; 15:533-44; PMID:22440612; http://dx.doi.org/10.1016/j.cmet.2012.02.011
- Cani PD, Amar J, Iglesias MA, Poggi M, Knauf C, Bastelica D, Neyrinck AM, Fava F, Tuohy KM, Chabo C, et al. Metabolic endotoxemia initiates obesity and insulin resistance. Diabetes 2007; 56:1761-72; PMID:17456850; http://dx.doi.org/10.2337/db06-1491
- Shin N-R, Lee J-C, Lee Y-Y, Kim M-S, Whon TW, Lee M-S, Bae J-W. An increase in the Akkermansia sp. population induced by metformin treatment improves glucose homeostasis in diet-induced obese mice. Gut 2014; 63:727-35; PMID:23804561; http://dx.doi.org/10.1136/gutjnl-2012-303839
- Pal D, Dasgupta S, Kundu R, Maitra S, Das G, Mukhopadhyay S, Ray S, Majumdar SS, Bhattacharya S. Fetuin-A acts as an endogenous ligand of TLR4 to promote lipid-induced insulin resistance. Nat Med 2012; 18:1279-85; PMID:22842477; http://dx.doi.org/10.1038/nm.2851
- Netea MG, Joosten LA, Lewis E, Jensen DR, Voshol PJ, Kullberg B, Tack CJ, van Krieken H, Kim SH, Stalenhoef AF, et al. Deficiency of interleukin-18 in mice leads to hyperphagia, obesity and insulin resistance. Nat Med 2006; 12:650-6; PMID:16732281; http://dx.doi.org/10.1038/nm1415
- Cayrol C, Girard JP. The IL-1-like cytokine IL-33 is inactivated after maturation by caspase-1. Proc Natl Acad Sci USA 2009; 106:9021-6; PMID:19439663; http://dx.doi.org/10.1073/pnas.0812690106
- Bapat SP, Suh JM, Fang SM, Liu S, Zhang Y, Cheng A, Zhou C, Liang Y, LeBlanc M, Liddle C, et al. Depletion of fat-resident Treg cells prevents age-associated insulin resistance. Nature 2015; 528:137-41; PMID:26580014; http://dx.doi.org/10.1038/528S137a
- Larsen CM, Faulenbach M, Vaag A, Volund A, Ehses JA, Seifert B, Mandrup-Poulsen T, Donath MY. Interleukin-1-receptor antagonist in type 2 diabetes mellitus. New Engl J Med 2007; 356:1517-26; PMID:17429083; http://dx.doi.org/10.1056/NEJMoa065213
- Owyang AM, Maedler K, Gross K, Yin J, Esposito L, Shu L, Jadhav J, Domsgen E, Bergmann J, Lee S, et al. XOMA 052, an anti-IL1b monoclonal antibody, improves glucose control and b-cell function in the diet-induced obesity mouse model. Endocrinology 2010; 151:2515-27; PMID:20332197; http://dx.doi.org/10.1210/en.2009-1124
- Masters SL, Dunne A, Subramanian SL, Hull RL, Tannahill GM, Sharp FA, Becker C, Franchi L, Yoshihara E, Chen Z, et al. Activation of the NLRP3 inflammasome by islet amyloid polypeptide provides a mechanism for enhanced IL-1b in type 2 diabetes. Nat Immunol 2010; 11:897-904; PMID:20835230; http://dx.doi.org/10.1038/ni.1935
- Westermark P, Andersson A, Westernark GT. Islet amyloid polypeptide, islet amyloid, and diabetes mellitus. Physiol Rev 2011; 91:795-826; PMID:21742788; http://dx.doi.org/10.1152/physrev.00042.2009
- Cabrera S, Fernández AF, Mariño G, Aguirre A, Suárez MF, Español Y, Vega JA, Laurà R, Fueyo A, Fernández-García MS, et al. ATG4B/autophagin-1 regulates intestinal homeostasis and protects mice from experimental colitis. Autophagy 2013; 9:1188-200; PMID:23782979; http://dx.doi.org/10.4161/auto.24797
- Cadwell K, Patel KK, Maloney NS, Liu TC, Ng AC, Storer CE, Head RD, Xavier R, Stappenbeck TS, Virgin HW. Virus-plus-susceptibility gene interaction determines Crohn's disease gene Atg16L1 phenotypes in intestine. Cell 2010; 141:1135-45; PMID:20602997; http://dx.doi.org/10.1016/j.cell.2010.05.009
- Nowarski R, Jackson R, Gagliani N, de Zoete MR, Palm NW, Bailis W, Low JS, Harman CCD, Graham M, Elinav E, et al. Epithelial IL-18 equilibrium controls barrier function in colitis. Cell 2015; 163:1444-56; PMID:26638073; http://dx.doi.org/10.1016/j.cell.2015.10.072
- Chung Y, Chang SH, Martinez GJ, Yang XO, Nurieva R, Kang HS, Ma L, Watowich SS, Jetten AM, Tian Q, et al. Critical regulation of early Th17 cell differentiation by interleukin-1 signaling. Immunity 2009; 30:576-87; PMID:19362022; http://dx.doi.org/10.1016/j.immuni.2009.02.007
- Brand S. Crohn's disease: Th1, Th17 of both? The change of a paradigm: new immunological and genetic insights imiplicate Th17 cells in the pathogenesis of Crohn's disease. Gut 2011; 58:1152-67; PMID:19592695; http://dx.doi.org/10.1136/gut.2008.163667
- Yen D, Cheung J, Scheerens H, Poulet F, McClanahan T, McKenzie B, Kleinschek MA, Owyang A, Mattson J, Blumenschein W, et al. IL-23 is essential for T cell-mediated colitis and promotes inflammation via IL-17 and IL-6. J Clin Invest 2006; 116:1310-6; PMID:16670770; http://dx.doi.org/10.1172/JCI21404
- Becker C, Dornhoff H, Neufert C, Fantini MC, Wirtz S, Huebner S, Nikolaev A, Lehr HA, Murphy AJ, Valenzuela DM, et al. Cutting edge: IL-23 cross-regulates IL-12 production in T cell-dependent experimental colitis. J Immunol 2006; 177:2760-4; PMID:16920909; http://dx.doi.org/10.4049/jimmunol.177.5.2760
- Strober W, Fuss IJ. Proinflammatory cytokines in the pathogenesis of inflammatory bowel diseases. Gastroenterology 2011; 140:1756-67; PMID:21530742; http://dx.doi.org/10.1053/j.gastro.2011.02.016
- Han MS, Chung KW, Cheon HG, Rhee SD, Yoon C-H, M-K. L, Kim K-W, Lee M-S. Imatinib mesylate reduces endoplasmic reticulum stress and induces remission of diabetes in db/db mice. Diabetes 2009; 58:329-36; PMID:19171749; http://dx.doi.org/10.2337/db08-0080
- Kim HS, Lee M-S. Essential role of STAT1 in caspase-independent cell death of activated macrophages through the p38 mitogen activated protein kinase/STAT1/reactive oxygen species pathway. Mol Cell Biol 2005; 25:6821-33; PMID:16024814; http://dx.doi.org/10.1128/MCB.25.15.6821-6833.2005
- Kim HS, Han MS, Chung KW, Kim S, Kim E, Kim MJ, Jang E, Lee HA, Youn J, Akira S, et al. Toll-like receptor 2 senses beta-cell death and contributes to the initiation of autoimmune diabetes. Immunity 2007; 27:321-33; PMID:17707128; http://dx.doi.org/10.1016/j.immuni.2007.06.010
- Cinti S, Mitchell G, Barbatelli G, Murano I, Ceresi E, Faloia E, Wang S, Fortier M, Greenberg AS, Obin MS. Adipocyte death defines macrophage localization and function in adipose tissue of obese mice and humans. J Lipid Res 2005; 46:2347-55; PMID:16150820; http://dx.doi.org/10.1194/jlr.M500294-JLR200
- Yu Z, Morrison M. Improved extraction of PCR-quality community DNA from digesta and fecal samples. Biotechniques 2004; 36:808-12; PMID:15152600
- Amar J, Chabo C, Waget A, Klopp P, Vachoux C, Bermúdez-Humarán LG, Smirnova N, Bergé M, Sulpice T, Lahtinen S, et al. Intestinal mucosal adherence and translocation of commensal bacteria at the early onset of type 2 diabetes: molecular mechanisms and probiotic treatment. EMBO Mol Med 2011; 9:559-72; PMID:21735552; http://dx.doi.org/10.1002/emmm.201100159
- Kommedal Ø, Simmon K, Karaca D, Langeland N, Wiker HG. Dual priming oligonucleotides for broad-range amplification of the bacterial 16S rRNA gene directly from human clinical specimens. J Clin Microbiol 2012; 50:1289-94; PMID:22278843; http://dx.doi.org/10.1128/JCM.06269-11