
ABSTRACT
Chaperone-mediated autophagy (CMA) involves the selective lysosomal degradation of cytosolic proteins such as SNCA (synuclein α), a protein strongly implicated in Parkinson disease (PD) pathogenesis. However, the physiological role of CMA and the consequences of CMA failure in the living brain remain elusive. Here we show that CMA inhibition in the adult rat substantia nigra via adeno-associated virus-mediated delivery of short hairpin RNAs targeting the LAMP2A receptor, involved in CMA's rate limiting step, was accompanied by intracellular accumulation of SNCA-positive puncta, which were also positive for UBIQUITIN, and in accumulation of autophagic vacuoles within LAMP2A-deficient nigral neurons. Strikingly, LAMP2A downregulation resulted in progressive loss of nigral dopaminergic neurons, severe reduction in striatal dopamine levels/terminals, increased astro- and microgliosis and relevant motor deficits. Thus, this study highlights for the first time the importance of the CMA pathway in the dopaminergic system and suggests that CMA impairment may underlie PD pathogenesis.
Introduction
Chaperone-mediated autophagy (CMA) is one of the main autophagic proteolytic pathways involving the selective targeting of cytosolic proteins to the lysosomes. In contrast to the other 2 lysosomal pathways, macro- and microautophagy, the substrate proteins cross the lysosomal membrane directly to reach the lysosomal lumen.Citation1 Only cytosolic proteins bearing the loose pentapeptide motif KFERQ or a biochemically related sequence (KFERQ-like) are recognized by the cytosolic chaperone HSPA8/HSC70.Citation2,3 The substrate-chaperone complex is then translocated to the level of the lysosomal membrane where interaction with the selective receptor for CMA, LAMP2A (lysosomal-associated membrane protein 2A), takes place.Citation4 This interaction drives the multimerization of the LAMP2A receptor and the formation of the translocation complex, through which substrate proteins are threaded into the lysosomes and degraded in a piecemeal fashion.Citation5 Although basal CMA activity is detectable in most mammalian cell types, it reaches peak activation in response to cellular stressors such as starvation,Citation6 oxidative stress,Citation7,8 proteotoxicityCitation9 and DNA damage.Citation10 Even so, the precise physiological role of CMA remains largely unknown.
LAMP2A is one of 3 isoforms of the gene Lamp2, encoded through alternative splicingCitation11 and the only isoform known to be involved in CMA.Citation4,12,13 As LAMP2A is the rate-limiting step for the pathway it stands to reason that manipulation of LAMP2A levels may alter the rate of CMA-dependent proteolysis. Indeed, as CMA activity declines with age,Citation14 restoration of LAMP2A abundance specifically in liver is sufficient to prevent said loss and preserve overall organ function.Citation15 Conversely, conditional KO of LAMP2A in liver cells causes hepatic glycogen depletion, severe metabolic dysfunction and altered abundance of multiple key enzymes,Citation16 suggesting that CMA decline occurring with age may be related to metabolic deregulation in aged organisms.
In neurons, CMA represents a main pathway for the degradation of SNCA (synuclein α),Citation17,18 whose levels and conformations are critical to Parkinson disease (PD) pathogenesis.Citation19,20 In the context of PD, decreased LAMP2ACitation21-23 and HSPA8/HSC70Citation21 protein levels are detected in human post-mortem PD brains, which—given that age is the primary risk factor for disease developmentCitation24—renders LAMP2A abundance a valid target for both disease pathogenesis and therapy. We have previously shown that RNA-interference targeting LAMP2A results in significant accumulation of SNCA in cultured neurons,Citation17 whereas overexpression of LAMP2A in cell culture models and in dopaminergic neurons of the substantia nigra pars compacta (SNpc) is able to fully rescue neurotoxicity associated with elevated SNCA protein burden.Citation25 However, the importance of proper CMA function in the living brain and the consequences of malfunction of this pathway in brain physiology remain unknown.
In view of the above, we sought to investigate the in vivo impact of impaired CMA function on the integrity of the adult dopaminergic system and on endogenous SNCA homeostasis. To this end, we utilized recombinant adeno-associated viral vector (rAAV)-mediated delivery of short hairpin RNAs (shRNAs) targeting the Lamp2a transcript to specifically knock down the endogenous protein in the rat SNpc—the population of midbrain neurons primarily lost in PD. Our results show that LAMP2A deficiency results in progressive loss of nigral dopaminergic neurons with concurrent accumulation of intracellular SNCA, lysosomal dysfunction manifested by accumulation of autophagic vacuoles and relevant ultrastructural abnormalities, increased astro- and microgliosis and behavioral motor deficits. These phenomena were preceded by a loss of striatal dopamine content and a dystrophic neurite-like pathology in nigrostriatal processes. Taken together, proper CMA function appears to be critical for the integrity of the established nigrostriatal circuit in vivo, while CMA impairment causes nigral dopaminergic neurodegeneration, which resembles in some respects that seen in PD brains.
Results
Generation of rAAV vectors targeting endogenous rat LAMP2A and efficient delivery in the rat nigrostriatal pathway
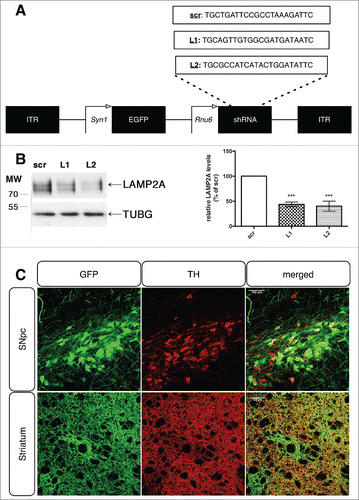
To investigate the consequences of impaired CMA function in the dopaminergic system, we constructed recombinant adeno-associated serotype 6 (rAAV6) viral vectors expressing 2 different shRNAs targeting the rat Lamp2a transcript (designated as L1 and L2) as well as a scrambled control sequence (scr), with co-cistronic GFP expression under the control of the neuronal promoter Syn1 (synapsin I) (). The shRNAs were designed to target the cytosolic tail of LAMP2A (GenBank™ accession number NM_017068), a region that differs between the A and B, C isoforms of the Lamp2 geneCitation13 and were subjected to BLAST search to verify specificity. The selected shRNA sequences were cloned into the pA2SGW rAAV6 vector under the transcriptional control of the Rnu6/U6 (RNA polymerase III dependent) promoter. Prior to the in vivo evaluation, the rAAV plasmids bearing the LAMP2A targeting sequences were tested in rat PC12 cells for their ability to downregulate endogenous LAMP2A upon transient transfection. Assessment of the relative LAMP2A protein levels 48 h following transfection revealed that cells transfected with either the L1 or L2 sequences showed an ∼60% drop of LAMP2A levels compared to the scrambled (scr) shRNA-treated cells (). Stereotactic delivery of the corresponding viruses in the rat substantia nigra resulted in efficient transduction of the majority of TH (tyrosine hydroxylase)-positive nigral dopaminergic neurons throughout the whole nigral rostrocaudal axis (), as well as their projections in the striatum (), manifested by the colocalized expression of TH and the GFP reporter, assessed 8 wk post-transduction. Quantification of the GFP and TH double-positive cells showed about 90% colocalization at the earliest time point examined (data not shown). Due to the fact that the majority of TH+ neurons were also positive for GFP, the GFP protein was used as an indicator for transduced dopaminergic neurons for all the subsequent automated image analyses.
Figure 1. Generation and efficient delivery of rAAV-vectors targeting endogenous LAMP2A in the rat nigrostiatal pathway. (A) General rAAV-vector design, with the 2 different LAMP2A-specific targeting sequences (denoted L1 and L2) and the scrambled control sequence (scr), listed in full. (B) Representative western immunoblots for LAMP2A and TUBG (loading control) in PC12 cells transiently transfected with rAAV vectors targeting rat Lamp2a (L1, L2) or with a scrambled sequence (scr) are shown in the left panel and quantification of LAMP2A levels is shown in the right panel, at 48 h post-transfection (***, p < 0.001; n = 3/group, one-way ANOVA). (C) Representative immunohistochemical fluorescence images with TH and GFP antibodies showing the expression of the GFP-tagged rAAV-scr shRNA vector in the TH+ neurons of the substantia nigra pars compacta (SNpc) (upper row) and their TH+ striatal afferents (lower row), 8-wk post-injection. Scale bar: 100 μm for SNpc and 50 μm for striatum.
Specific LAMP2A downregulation in rat nigral neurons is accompanied by impaired CMA function
In order to assess whether we achieved efficient LAMP2A downregulation in the GFP-transduced nigral neurons, we employed unbiased automated single cell analysis, through immunofluorescent labeling of the LAMP2A protein (red) within the GFP-positive rAAV-transduced nigral neurons ( and videos S1-3). To accomplish this, a mask was created using the GFP signal and applied to filter the intracellular LAMP2A staining and separate it from that of nontransduced neurons and processes (). Given the punctate nature of LAMP2A immunoreactivity, quantifications of puncta per GFP+ cell provides a reliable measure of knockdown efficacy. The automated image analysis revealed a prominent downregulation of LAMP2A puncta at the 4-wk time point for both L1 (67 ± 40%) and L2 (69 ± 44%)-rAAV-injected animals compared to the scr-injected ones (), progressing to a robust significant reduction of LAMP2A protein expression at 8 wk post-transduction, evident for both L1 (56 ± 22%) and L2 (73 ± 21%) rAAV-injected animals compared to scr controls (). At 12 wk following injection, no significant differences between groups were detectable (), a finding that was likely related to the reduced number of GFP+ neurons in the L1- and L2-injected animals compared to the scr-injected animals, due to degeneration of the L1- and L2-transduced neurons (see below).
Figure 2. rAAVs expressing shRNAs against endogenous rat Lamp2a (L1, L2) efficiently decrease LAMP2A protein levels and impair CMA-function in transduced nigral neurons, while LAMP1 levels remain unaffected. (A) Representative immunofluorescence images depicting the expression of LAMP2A (red) in nigral neurons transduced with the GFP-tagged rAAV-shRNAs (green), 8-wk post-injection. The fourth column shows the red channel masked by the green, illustrating the images used for the automated puncta quantifications. Scale bar: 15 μm. (B) Automated quantifications of LAMP2A+ puncta per GFP+ neuron, expressed as folds of the respective time-point matched control (*, p< 0.05; **, p < 0.01; n = 5 animals/group, one-way ANOVA). (C) Representative immunofluorescence images of LAMP2A (red) and LAMP1 (pseudo color) protein expression in GFP-shRNA-transduced neurons, 8-wk post-injection. Scale bar: 5 μm. (D) Western immunoblots for LAMP2A, LAMP1 and TUBG (loading control) in the contralateral (C) and ipsilateral (I) ventral midbrain of rAAV-shRNA-injected animals are shown in the upper panel and quantifications of LAMP2A and LAMP1 levels are shown in the bottom panel, 8-wk post-injection (*, p < 0.05; n = 5 animals/group, one-way ANOVA). (E) In vitro assay to measure CMA activity by monitoring direct translocation of human recombinant SNCA into lysosomes isolated from the contralateral (C) and ipsilateral (I) ventral midbrain of scr-, L1- and L2-injected animals, 2 wk post-injection. Lysosomes were incubated with recombinant SNCA, in the presence (+) or absence (−) of proteinase inhibitors, collected by centrifugation and subjected to immunoblot analysis for SNCA, LAMP2A, CTSD and TUBG levels. Representative western blots are shown in the left panel and quantification of the relative uptake of recombinant SNCA expressed as percent of SNCA detected in the absence or presence of protease inhibitors is shown in the right panel (*, p < 0.05; ***, p < 0.001; n = 2 with 3 pooled animals/group, one-way ANOVA).
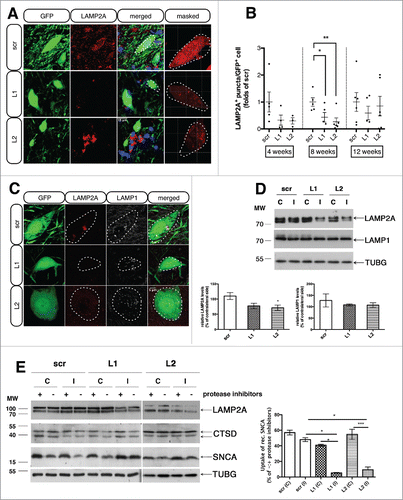
To ensure that the observed decrease in LAMP2A protein levels at 8 wk was specific and not due to impaired maturation or stability of the lysosomes, we performed co-immunofluorescent localization of LAMP2A with LAMP1, a general lysosomal membrane protein. Costaining of the GFP+ nigral neurons with LAMP2A (red) and LAMP1 (pseudo color) revealed strong LAMP1 immunofluorescence in GFP+ neurons that were largely LAMP2A negative, showing the downregulation to be specific for LAMP2A (). These observations were further verified by western blot analysis of LAMP2A and LAMP1 expression levels in the ventral midbrain of L1-, L2- and scr-injected animals, where a significant reduction in LAMP2A but not in LAMP1 levels was detected in L2-injected animals compared to controls; reduction in LAMP2A barely failed to reach significance in L1-injected animals (). The less robust effects on LAMP2A downregulation by immunoblotting compared to immunostaining likely reflect a sampling effect. Given that LAMP2A is considered to be involved in the rate-limiting step of the CMA pathway, we asked whether in vivo LAMP2A downregulation was accompanied by a subsequent reduction in CMA activity. To this end, we isolated intact lysosomes from the ventral midbrain of scr-, L1- and L2-injected animals at 2 wk post-injection and performed an in vitro assay to measure CMA activity using the well-established CMA substrate human recombinant SNCA, in the presence of recombinant HSPA8/HSC70. We chose this time point to perform the CMA activity assay since at 2 wk post-injection lysosomal LAMP2A protein levels were already reduced compared to the respective contralateral sides (∼35% decrease) or the scr controls () and no obvious cell death was detected (data not shown). Lysosomes isolated from the ipsilateral ventral midbrain of L1- and L2-transduced rats displayed reduced ability to degrade human recombinant SNCA in the absence (−) of proteinase inhibitors (L1 [ipsilateral, I]: 5.18 ± 2.44%; and L2 [I]: 9.3 ± 0.48%), compared to the respective contralateral sides and to the scr-injected animals (scr [I]: 47.87 ± 3.5%), where SNCA was being degraded efficiently ().
LAMP2A silencing and subsequent CMA blockade induces intracellular accumulation of ubiquitinated SNCA within rAAV-shLAMP2A-transduced nigral neurons
Since CMA has been proposed to represent a main pathway for SNCA degradation,Citation17,18,25,26 we investigated the impact of LAMP2A downregulation on SNCA levels/aggregation selectively in transduced dopaminergic neurons. Double-immunofluorescent staining of SNCA (red) and GFP (green) in scr-, L1- and L2-injected neurons, revealed the presence of strong punctate SNCA signals within the GFP+ neurons of the L1- and L2-injected animals, which was absent in the scr-injected animals, at 8 wk post-transduction ( and videos S4-6). Following the same protocol of automated image analysis, we quantified the number of SNCA+ puncta per GFP+ neurons and found a significant accumulation of SNCA puncta for L1- and L2-injected animals (2.6 ± 0.7 and 3.1 ± 0.7-fold, respectively compared to scr-treated controls) at 8 wk post-injection, with no detectable differences at the 4- and 12-wk time points (). Correlation analysis of SNCA+ and LAMP2A+ puncta on a per-animal basis revealed a strong, albeit barely nonsignificant, negative correlation coefficient (ρ = −0.36, P = 0.0558) for L1- and L2-treated animals, with all 3 time points being considered in this analysis (). As Lewy bodies (LBs) classically also stain with UBIQUITIN polymer-specific antibodies and colocalization with UBIQUITIN can be considered a proxy for the aggregated nature of SNCA, we next performed co-immunofluorescent visualization of SNCA and UBIQUITIN within the GFP+ SNpc neurons ( and videos S7 and 8). The images revealed a consistent colocalization of UBIQUITIN and SNCA+ puncta in L1- and L2-transduced SNpc neurons, 8 wk post-injection, whereas such colocalization was absent in the scrambled-injected controls (). Quantification of SNCA+ and UBIQUTIN+ puncta revealed an increase in SNCA-UBIQUITIN colocalization in L1- (ρ = 0.09 ± 0.03) and a significant increase in L2-injected animals (ρ = 0.19 ± 0.03), compared to the scr-injected ones (ρ = −0.02 ± 0.05) (). Proteinase K (PK) treatment (2.5 μg/ml, 10 min, RT) indicated that the majority of the SNCA puncta present in L1- and L2-injected animals were PK-soluble, and only a small percentage of them (<5 %, data not shown) were PK-resistant (Fig. S1). Notably, no SNCA-positive puncta were detected in scr-injected animals post-PK treatment (Fig. S1).
Figure 3. LAMP2A downregulation results in increased accumulation of UBIQUITIN-positive SNCA puncta within GFP-transduced nigral neurons. (A) Representative immunofluorescence images showing the expression of SNCA (red) and GFP (green) in rAAV-transduced neurons, 8-wk post-injection. The fourth column depicts the masked red channel used for quantifications. Scale bar: 25 μm. (B) Automated quantifications of SNCA+ puncta/GFP+ cell, expressed as folds of the respective time-point matched scrambled condition (*, p < 0.05; n = 6/group, one-way ANOVA). (C) Cross-correlation analysis of SNCA+ puncta/GFP+ cell and LAMP2A+ puncta/GFP+ cell for every animal injected with L1 or L2 rAAVs at all time-points (ρ = 0.36, p = 0.055; n = 28). (D) Representative immunofluorescent images showing SNCA (red) and UBIQUITIN (pseudo color) in GFP-transduced nigral neurons are shown in the left panel and quantification of SNCA-UBIQUITIN colocalization is shown in the right panel (*, p < 0.05; n = 3 animals/group, one-way ANOVA). Scale bar: 5 μm. (E) Representative immunofluorescence images showing Syn303 SNCA (red) in GFP-transduced nigral neurons. Scale bar: 10 μm.
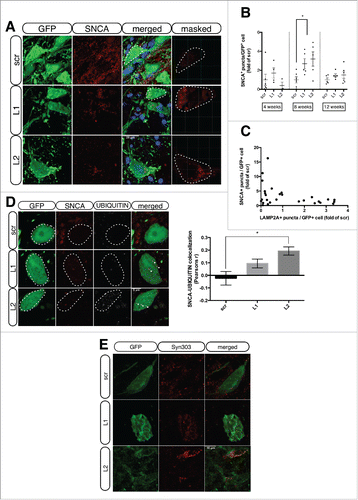
Furthermore, using the Syn303 monoclonal antibody generated against oxidized/nitrated recombinant SNCA,Citation27 we detected a prominent immunoreactivity of the Syn303 signal within the GFP+ nigral neurons in both L1- and L2-injected animals, while only background nonspecific signal was detected in the scr-injected controls ( and videos S9-11).
CMA impairment is accompanied by accumulation of autophagic vacuoles and decreased SQSTM1/p62 levels within transduced degenerating nigral neurons
The intracellular accumulation of SNCA in the LAMP2A-deficient nigral neurons was further demonstrated by immunogold EM analysis. In particular, intracellular SNCA immunoreactive signal was consistently present in both L1- and L2-injected animals in close proximity to endoplasmic reticulum (ER), mitochondria (m) or at the surface of lysosomes (L) (). SNCA immunoreactivity was also present within dystrophic neurites in L1- and L2-injected rats (arrows in ). In scr-injected rats, the cytoplasm of nigral neurons had typical morphological features, free of SNCA immunoreactivity, while SNCA-conjugated silver enhanced immunogold particles were localized mostly in presynaptiC-terminals (). Moreover, multiple lipofuscin granules (Lf, ) filled with lipid-containing residues of lysosomal digestion and autophagic vacuoles (AV) were also present only in the LAMP2A-deficient animals, suggesting lysosomal dysfunction.
Figure 4. CMA deficiency results in accumulation of intracellular SNCA+ immunogold particles and autophagic vacuoles within transduced degenerating nigral neurons. (A) Electron micrographs demonstrating the intracellular distribution of SNCA immunolabeling in SNpc neurons transduced with Lamp2a-shRNA rAAVs. In both L1- and L2-injected animals, SNCA-conjugated silver enhanced immunogold particles (arrows) were found in the cytoplasm (upper row), in close proximity to endoplasmic reticulum (ER), mitochondria (m) and lysosomes (L) (middle and bottom rows). No cytoplasmic SNCA immunolabeling was evident in scr-injected animals, where SNCA was localized mainly in presynaptiC-terminals (S, bottom row). The cytoplasm of LAMP2A-deficient rats was also characterized by the presence of lipofuscin pigments (Lf) and autophagic vacuoles (av). N, nucleus; G, Golgi; mvb, multivesicular bodies; S, synapse; dspine, dendritic spine; Deg. Ax., degrading axon. Scale bars: 0.5 μm (upper row); 0.2 μm (middle row); 0.2 μm (bottom row). (B) Electron micrographs demonstrating the accumulation of numerous autophagosomes (av) with storage material of different nature and also multivesicular bodies (mvb), in degenerating neurites of LAMP2A-deficient rats (L1, L2). In contrast, nigral neurons of control scr-injected rats displayed typical dendrites (D) with intact mitochondria (m) and axonal terminal buttons (At1,2). A cluster of SNCA-conjugated gold/silver particles (arrow) was detectable in neighboring synaptic processes (S) of scr-injected animals, while SNCA-immunolabeling was present in dystrophic neurites in L1- and L2-injected animals (arrows, upper row). Scale bars: 0.2 μm (upper row); 0.1 μm (bottom row).
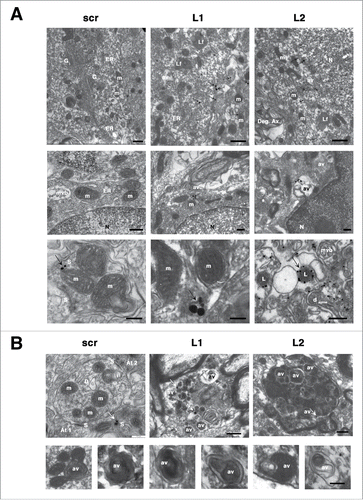
Furthermore, it has been previously shown that selective blockade of CMA in cell culture results in compensatory upregulation of macroautophagyCitation12,28 that may be beneficial or deleterious depending on the system examined. Ultrastructural analysis of the LAMP2A-deficient nigral neurons at 8-wk post-injection, revealed the presence of numerous AVs with storage material of different nature and also multivesicular bodies (mvb) in the cytoplasm and in neurites of both L1- and L2-treated animals, while such structures were absent in scr-treated controls (). Moreover, ultrastructural abnormalities, such as axonal spheroids and dystrophic neurites were evident in LAMP2A-deficient animals, with the L2-injected animals displaying a more severe phenotype ().
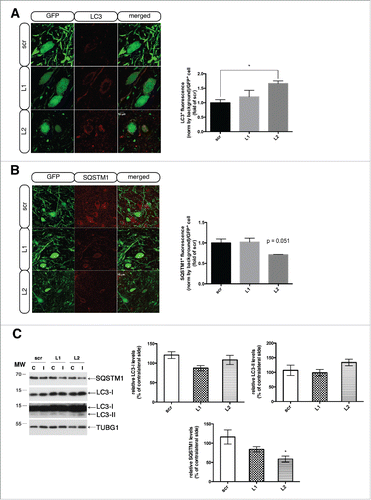
Increased abundance of autophagic vacuoles was further suggested by confocal microscopy, where accumulation of MAP1LC3/LC3 (microtubule-associated protein 1 light chain 3)+ puncta was observed in LAMP2A-deficient animals (), even though no significant differences between the isoforms LC3-I and LC3-II were apparent on western immunoblot (), again likely due to sampling effect. More particular, total LC3+ fluorescence in GFP+ neurons was increased both in L1- (1.20 ± 0.22) and L2-injected animals (1.66 ± 0.09) compared to the scr-injected ones (1.00 ± 0.10) (). Interestingly, SQSTM1 (sequestosome 1) levels were found to be decreased in L2-injected animals, as assessed by confocal microscopy and western immunoblot (), a finding that might further support compensatory macroautophagy induction. In L1-injected animals, there was also a prominent trend for SQSTM1 reduction on western immunoblot (). Quantification of total SQSTM1+ fluorescence in GFP+ neurons showed no difference in L1- (1.02 ± 0.09) and a consistent, almost significant, decrease in L2-injected animals (0.71 ± 0.006), compared to the scr-injected ones (1.00 ± 0.09) ()
Figure 5. LAMP2A downregulation is accompanied by increased LC3 and decreased SQSTM1 levels within transduced nigral neurons. (A) Representative immunofluorescence images depicting LC3 (red) accumulation in GFP-transduced nigral neurons are shown in the left panel and quantification of LC3+ fluorescence/GFP+ cell is shown in the right panel (*, p < 0.05; n = 3 animals/group, one-way ANOVA). Scale bar: 10 μm. (B) Representative immunofluorescence images depicting SQSTM1 (red) reduction in GFP-transduced nigral neurons are shown in the left panel and quantification of SQSTM1+ fluorescence/GFP+ cell is shown in the right panel (p = 0.051; n = 3 animals/group, one-way ANOVA). Scale bar: 15 μm. (C) Western immunoblots for SQSTM1, LC3-I, LC3-II (short and long exposure) and TUBG (loading control) in the contralateral (C) and ipsilateral (I) ventral midbrain of scr, L1 and L2 rAAV-injected animals are shown in the left panels and quantifications of LC3-I, LC3-II and SQSTM1 levels are shown in the right panels, 8-wk post-injection (*, p < 0.05; n = 5 animals/group, one-way ANOVA).
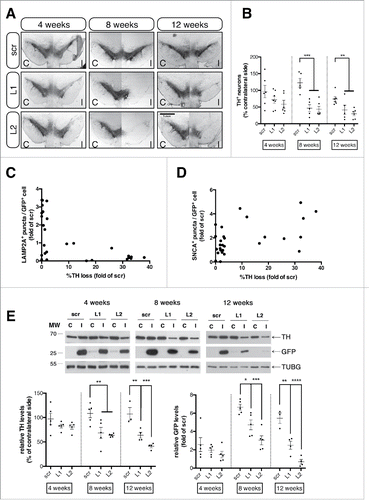
Selective LAMP2A deficiency in the rat SNpc causes progressive loss of dopaminergic neurons
As mentioned above, LAMP2A downregulation in the rat SNpc resulted in the formation of axonal spheroids and dystrophic neurites, indicative of an ongoing neurodegenerative process. To assess the effects of LAMP2A downregulation on the survival of transduced nigral neurons we utilized unbiased stereological quantification of the density of dopaminergic neurons in the ipsilateral injected hemisphere relative to the contralateral control hemisphere. Importantly, LAMP2A downregulation resulted in a dramatic loss of TH+ neurons starting at 53.29 ± 10.32% and 56.37 ± 8.78% at 8 wk and gradually progressing to 58.43 ± 13.88% and 70.07 ± 5.91% loss by 12 wk, for L1 and L2 rAAVs, respectively (). At 4 wk we did not detect statistically significant differences in the numbers of TH+ neurons between the groups, although a trend for cell loss was apparent for the LAMP2A-deficient animals (). Interestingly, the L2 rAAV displayed higher efficacy to downregulate LAMP2A () and to induce SNCA accumulation (), while at the same time it was more toxic to the transduced nigral neurons, compared to the L1 rAAV (). In order to further probe the interrelationship between degeneration of the dopaminergic system on the one hand and levels of LAMP2A and SNCA on the other, we performed cross-correlation analysis across all time-points, which revealed a significant negative correlation between the number of LAMP2A+ puncta per GFP+ cell and the percent of TH+ loss (ρ = −0.40, P = 0.0011) on an animal-by-animal basis (), with an inverse, positive significant correlation (ρ = 0.51, P = 0.0046) between the number of SNCA+ puncta per GFP+ cell and the percent of TH+ loss (). The decreased number of TH+ neurons was not attributed to reduced TH expression but to actual loss of the dopaminergic neurons, since in both L1- and L2- injected animals a significant drop in RBFOX3/NeuN-positive neurons, which coincided with loss of TH+ neurons, was evident at 12 wk post-injection (Fig. S2). The progressive dopaminergic loss in the Lamp2a shRNA-treated animals was further verified by immunoblot analysis of TH and GFP protein levels in the ventral midbrain tissues (). No significant loss of TH and GFP levels was detected at 4 wk post-injection, while both TH and GFP protein levels were significantly reduced for both L1- and L2-treated animals at 8 and 12 wk post-injection ().
Figure 6. Selective LAMP2A downregulation causes progressive loss of dopaminergic neurons in the rat substantia nigra. (A) Representative TH-immuno-labeled nigral coronal images of animals injected with sh-scr (top row), sh-Lamp2a L1 (middle row), or sh-Lamp2a L2 (bottom row), across 4-, 8-, and 12-wk post-injection. Scale bar: 1 mm. (B) Stereological quantification of numbers of TH+ neurons in the ipsilateral (I) SNpc as a percent of the contralateral (C) control hemisphere in all animals (**, p < 0.01; ***, p < 0.001; n = 6/group). (C) Cross-correlation analysis of the average number of the LAMP2A+ puncta/GFP+ cell and the percent loss of TH+ neurons in the ipsilateral SNpc relative to the contralateral control side, for every animal injected with L1 or L2 rAAVs across all time points (ρ = −0.40, p = 0.001; n = 27). (D) Correlation analysis of the SNCA+ puncta/GFP+ cell and the percent loss of TH+ neurons relative to the contralateral hemisphere for every animal injected with L1 or L2 rAAVs across all time points (ρ = 0.51, p = 0.004; n = 28). (E) Representative western immunoblots for TH, GFP and TUBG (loading control) in the contralateral (C) and ipsilateral (I) ventral midbrain of scr, L1 and L2 rAAV-injected animals are shown in the upper panels and quantifications of TH and GFP levels are shown in the bottom panels, at 4-, 8- and 12-wk post-injection (*, p < 0.05; **, p < 0.01; n = 5 animals/group, one-way ANOVA).
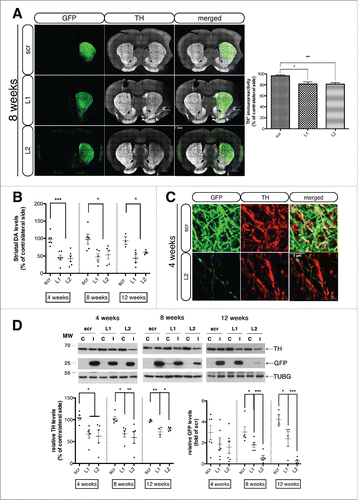
LAMP2A downregulation evokes severe loss of the nigrostriatal terminals that precedes nigral degeneration
As dopaminergic innervation of the striatum is paramount to proper motor function, we sought to investigate the integrity of the nigrostriatal projections and their dopamine content. Immunofluorescent labeling of TH revealed a pronounced loss of dopaminergic innervation in the striatum at 8 wk post-injection, for both Lamp2a-targeting shRNAs, relative to the scrambled-injected control hemisphere ()—again with a qualitative trend for increased degeneration with the L2 compared to the L1 rAAV. Measurement of striatal dopamine levels with HPLC revealed a highly significant 51.51 ± 10.64% and 54.58 ± 10.64% reduction in striatal DA levels at 4 wk for L1 and L2 rAAVs, respectively, relative to the contralateral hemisphere, with no effect detectable in the scrambled control animals (). This drop persisted at 8 and 12 wk following injection (), indicating that the toxicity at the level of striatal terminals was saturated already by 4 wk, prior to the apparent loss of the nigral cell bodies. Furthermore, surviving TH− GFP+ nigrostriatal processes in L2-treated animals showed a dystrophic neurite-like phenotype, evident at 4 wk post-injection (). This “dying-back” phenotype of LAMP2A-deficient neurons was further confirmed by immunoblot analysis of TH and GFP protein levels at all time points. In particular, TH levels were significantly reduced by 69.68 ± 8.13% and 67.04 ± 12.49% in L1- and L2-treated animals, respectively, compared to scr-injected controls already by 4 wk and remained low at the later time points (). Similarly, GFP protein levels were gradually decreased from the 4- to the 12-wk time point ().
Figure 7. Loss of the nigrostriatal innervation due to CMA blockade precedes nigral cell death. (A) Representative tile scan confocal immunofluorescence visualization of the GFP (green) and TH (pseudo color) expression in striatal sections from all groups, 8-wk post-injection is shown in the left panel and quantification of striatal TH levels expressed as the mean percent of the contralateral hemisphere is shown in the right panel (*, p < 0.05; **, p < 0.01; n = 6 animals/group). In the Lamp2a-shRNA injected animals the GFP signal has been pumped up for visualization purposes, since intensity of the signal was much lower in these animals compared in the scr-injected ones, due to the loss of GFP+ terminals. Scale bar: 1 mm. (B) Quantification of striatal dopamine (DA) levels by high-performance liquid chromatography, expressed as the mean percent of the contralateral hemisphere, at all time points (*, p < 0.05; ***, p < 0.001; n = 6 animals/group). (C) High-power immunofluorescence images of TH expression (red) within GFP-positive striatal terminals of scr- and L2-transduced animals, 8-wk post-injection. Scale bar: 1 μm. (D) Representative western immunoblots for TH, GFP and TUBG (loading control) in the contralateral (C) and ipsilateral (I) striatal tissues of scr, L1 and L2 rAAV-injected animals are shown in the upper panels and quantifications of TH and GFP levels are shown in the bottom panels, at 4-, 8- and 12-wk post-injection (*, p < 0.05; **, p < 0.01; n = 5 animals/group, one-way ANOVA).
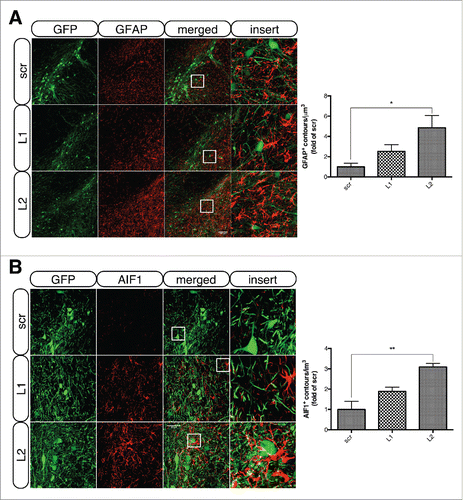
The progressive loss of the nigral dopaminergic neurons is accompanied by robust astro- and microgliosis in LAMP2A-deficient animals
To assess whether the observed loss of TH+ cell bodies was accompanied by an inflammatory response, we performed immunofluorescent labeling of GFAP (glial fibrillary acidic protein) and AIF1/IBA1, markers of astrocytes and microglia, respectively. Both markers showed robust upregulation in the ipsilateral SNpc of L1- and L2-treated animals relative to scrambled transduced neurons at the 8 wk () and 12 wk (data not shown) time points. Quantification of GFAP-positive contours/μm3 of ventral midbrain tissue revealed an increase in both L1- (2.52 ± 0.65-fold) and L2-injected animals (4.85 ± 1.19-fold, p = 0.02) compared to the scr-injected ones (). Similarly, quantification of AIF1-positive contours revealed an increase in both L1- (1.88 ± 0.2-fold, p = 0.051) and L2-injected animals (3.09 ± 0.17-fold) compared to the scr-injected ones ().
Figure 8. LAMP2A deficiency is accompanied by robust astro- and microgliosis in transduced nigral neurons. (A) Representative immunofluorescence images of GFAP+ astrocytes (red) in the vicinity of GFP+ nigral neurons of all groups, 8-wk post-injection are shown in the left panel and quantification of GFAP+ contours/μm3 of ventral midbrain tissue is shown in the right panel (*, p < 0.05; n = 3 animals/group, one-way ANOVA). Scale bar: 100 μm. (B) Representative immunofluorescence staining of AIF1+ microglia (red) in the vicinity of GFP+ nigral neurons of all groups, 8-wk post-injection are shown in the left panel and quantification of AIF1+ contours/μm3 of ventral midbrain tissue is shown in the right panel (*, p < 0.05; n = 3 animals/group, one-way ANOVA). Scale bar: 50 μm. The inserts (right) show higher magnification of the indicated region.
Selective dopaminergic degeneration induced by LAMP2A downregulation produces a unilateral behavioral phenotype
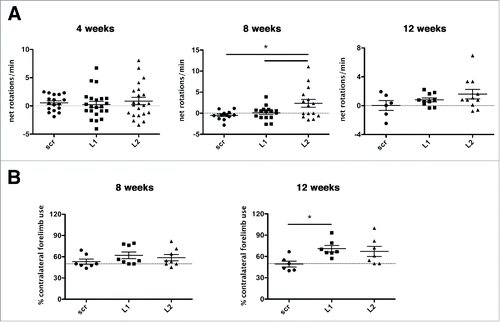
Given the dramatic deterioration of the nigrostriatal pathway upon LAMP2A downregulation, we sought to examine whether unilateral motor behavioral deficits are occurring in these rats. At all time points, we employed motor behavior tests, specifically the measurement of amphetamine-induced rotations () and the cylinder test (). One-way ANOVA revealed a significant treatment effect at 8 wk [F(2,45) = 4.902, p = 0.012]. Multiple comparisons (Bonferonni correction) showed a significant increase in net ipsilateral rotations per minute in the L2 Lamp2a shRNA-treated rats compared with the scrambled shRNA- (p = 0.044) and L1 Lamp2a shRNA-treated animals (p = 0.02). A similar trend for both L1 and L2 was observed at 12 wk (). Regarding contralateral forelimb use as assessed with the cylinder test, one-way ANOVA revealed a significant treatment effect at 12 wk (F[2,20] = 4.087, p = 0.036). Multiple comparisons (Bonferroni correction) showed increased contralateral forelimb use in unilaterally L1 Lamp2a-shRNA rAAV-injected rats compared with scr-shRNA-injected rats (p = 0.044), indicating forelimb use asymmetry, while a similar trend was observed for L2-injected rats ().
Figure 9. Deterioration of the dopaminergic system evoked by CMA impairment produces abnormal motor behavioral phenotypes. (A) LAMP2A downregulation with L2-shRNA resulted in increased net d-amphetamine-induced ipsilateral rotations at 8-wk post-injection, with a similar trend at 12 wk, indicating a unilateral motor impairment (*, p < 0.05; n = 22 animals/group for 4 wk, n = 15 animals/group for 8 wk, n = 11 animals/group for 12 wk, one-way ANOVA). (B) Contralateral forelimb use as assessed in the cylinder test was significantly increased at the 12-wk time point in unilaterally L1 Lamp2a-shRNA-rAAV-injected rats, while a similar trend occurred in L2 shRNA-rAAV-injected rats, indicating forelimb use asymmetry (*, p < 0.05; n = 7 animals/group, one-way ANOVA).
Discussion
We have demonstrated that selective blockade of the CMA pathway in the adult rat SNpc, via downregulation of the LAMP2A receptor, is accompanied by intracellular accumulation of SNCA puncta, buildup of autophagic vacuoles and relevant abnormal structures associated with lysosomal malfunction, within LAMP2A-deficient nigral neurons. Most importantly, LAMP2A downregulation triggers a progressive loss of nigral dopaminergic neurons, a severe reduction in striatal dopamine levels/terminals that precedes the loss of the nigral cell bodies, increased astro- and microgliosis and relevant motor behavioral deficits.
In this study, in order to eliminate the possibility of off-target actions, we have targeted 2 different sequences on Lamp2a by AAV-mediated shRNA expression, and the results are similar, although L2, by almost all indices, conferred more significant effects. The relevance of LAMP2A downregulation to the phenomena of neurodegeneration and nigral neuron SNCA accumulation is further demonstrated by the fact that on an animal per animal basis there was a strong correlation between these indices. The progressive nature of the nigral neurodegeneration, following treatment with the 2 different LAMP2A-targeting vectors, suggests that the most severely affected neurons continuously died off. This would explain the apparent lack of SNCA accumulation and LAMP2A depletion at the 12-wk time-point, wherein up to 70% of the dopaminergic neurons have been lost. In the “dying-back” hypothesis of PD-like neurodegeneration, the pathological cascade occurs initially at the level of axonal innervation in the striatum, which in turn causes cytotoxicity at the level of the dopaminergic nigral cell bodies.Citation29 This is in accordance with our observations of significantly reduced striatal dopamine content at the 4-wk time-point, where no statistically significant loss of dopaminergic cell bodies is observed. This indicates that initial CMA dysfunction in nigral neurons causes axonal degeneration, which, over time, results in severe cytotoxicity at the level of the SNpc.
Our findings suggest that LAMP2A deficiency is detrimental for the adult nigrostriatal circuit. It is possible that similar detrimental effects might be observed when LAMP2A, and by extension CMA, is impaired in other neuronal types. It should be noted, however, that with the strategy utilized in the current study, LAMP2A deficiency resulted in a severe loss of nigral neurons, whereas, in the same LAMP2A-deficient animals, other TH-negative but GFP-positive neurons along the needle tract were spared (data not shown), suggesting that dopaminergic neurons may be more vulnerable to CMA dysfunction compared to other neuronal cells. This may provide at least a partial explanation for the fact that, even though SNCA accumulates in various brain regions in PD, correlating inversely with decreased protein levels of LAMP2A and HSPA8/HSC70,Citation21,22,23 pronounced neurodegeneration occurs predominantly within nigral dopaminergic neurons. As aging is the main risk factor associated with PD and other neurodegenerative disorders, it would be very important to investigate whether CMA dysfunction, manifested by decreased LAMP2A and/or HSPA8/HSC70 levels, also occurs in the human brain with aging and whether brain areas affected in PD such as the nigra, show lower LAMP2A and/or HSPA8/HSC70 levels during aging compared to other regions (e.g., the cerebellum) that are spared; however, such an analysis has not yet been performed.
Regarding SNCA, our findings are in agreement with previous in vitro work from usCitation17 and others,Citation30 where Lamp2a-targeted RNAi was accompanied by SNCA accumulation, suggesting that CMA may represent a major pathway for SNCA degradation. However, a recent report failed to detect buildup of SNCA or other known CMA substrates, such as GAPDH or MEF2D, in the brain of Lamp2 knockout mice or in neuroblastoma cells under physiological or prolonged starvation conditions.Citation31 Similarly, LAMP1-LAMP2 double-deficient fibroblasts display normal long-lived protein degradation rates, including CMA-dependent proteolysis.Citation32 The LAMP1-LAMP2 deficient cells show accumulation of unesterified cholesterol in endo/lysosomal compartments, an effect that is rescued by LAMP2A overexpression,Citation32 suggesting a more prominent role of LAMP2 in cholesterol homeostasis. Compensatory mechanisms may account for this discrepancy, especially given the fact that all LAMP2 isoforms were targeted in these studies, even though no obvious compensatory activation of macroautophagy or the proteasome was detected in these systems (microautophagy was not tested).
The timing of the manipulation may also be a critical factor, because different adaptations may occur in the system, depending on when LAMP2A is deficient, i.e. at birth or later on in adulthood. Finally, it is plausible that alternative receptors or mechanisms for CMA besides LAMP2A may exist that take over once LAMP2A is deficient. Nonetheless, Lamp2 knockout mice show hippocampal dysfunction and behavioral abnormalities associated with severe neuroinflammation, the latter being reported in our model also, suggesting that the ongoing neurodegeneration may have masked the true turnover of the CMA substrates. For example, in LAMP2A-deficient nigral neurons we observed increased accumulation of intracellular, possibly aberrant forms of SNCA as detected with the Syn303 antibody, with a concurrent loss of SNCA+ neuropil staining, which is normally present in control scr-injected animals, indicating that gross levels of the protein may not change but rather redistribute—in line with our inability to detect changes in gross SNCA content both in Triton X-100-soluble and in SDS-soluble fractions derived from dissected ventral midbrain samples (data not shown).
The small, punctate nature of SNCA+ nigral cytoplasmic signal, confirmed by immuno-EM, does not, of course, constitute LBs, but such species could, with time, form the basis for more fibrillar structures. These findings contrast with those in mice with genetically determined deficient macroautophagy, where a slight overall increase of SNCA occurs in the nigrostriatal system, but without evidence for significant SNCA accumulation within nigral neurons.Citation33,34 Therefore, these studies overall suggest that CMA is more important than macroautophagy in the normal turnover of endogenous SNCA, so that more aggregated conformations are prevented. The fact that in our study there was a good correlation between loss of nigral neurons and formation of SNCA+ puncta suggests that these SNCA conformations may be etiologically related to the nigrostriatal neurodegeneration. The majority of the observed SNCA puncta were PK-soluble, at least under the conditions utilized, suggesting that these SNCA forms probably do not represent higher-grade aggregates. However, a small percentage of them (< 5%) was detected in the cytoplasm of both L1- and L2-injected animals, while at the same time, no signal was observed in the scr-injected ones, suggesting that some aberrant forms of SNCA are building up when CMA is dysregulated. An altered, aberrant conformation of the accumulating SNCA puncta is further supported by the colocalization with UBIQUITIN and the positive SNCA Syn303 staining.
Even though we observed a dystrophic neurite-like phenotype of striatal GFP+ processes originating from the SNpc, we were unable to detect SNCA within these structures (preliminary observations). We speculate that this might be due to the conformational state of the protein within these structures, as immunogold EM analysis clearly showed SNCA+ immunoreactive deposits within dystrophic neurites in the substantia nigra of shRNA-Lamp2a treated animals. Further studies will be required to establish the exact nature of the conformation of SNCA species present in this model and whether this is etiologically related to neurodegeneration.
The increased accumulation of autophagic vacuoles in LAMP2A-deficient neurons indicate upregulation of macroautophagic-dependent degradation, an effect which has previously been reported by us in vitroCitation28 and by others, both in vitroCitation12 and in vivo in LAMP2-deficient mice.Citation31,35 Although the presence of autophagic vacuoles by itself cannot determine whether the observed macroautophagy response is productive or not, the significantly reduced levels of the macroautophagy substrate SQSTM1 in L2-treated animals 8 wk post-transduction, suggest elevated autophagic flux resulting in accelerated degradation of macroautophagy substrates. However, the effect on SQSTM1 levels might also be mediated via compensatory proteasomal upregulation. Whether the apparent macroautophagy induction is detrimental or represents an attempt to promote survival in this model will require further study. It is interesting to note that, despite the apparent lack of malfunction of the macroautophagy pathway, there was evidence of generalized lysosomal impairment, such as lipofuscin accumulation, indicating that CMA inhibition alone may lead to such phenomena. These results are consistent with the findings in the LAMP2-deficient mice.Citation31
In conclusion, our study highlights for the first time an important physiological role for LAMP2A, and, by extension, the CMA pathway in the brain, and in particular in the dopaminergic system. Furthermore, the presented model of LAMP2A downregulation in the adult substantia nigra recapitulates the main features of PD, including the severe loss of dopaminergic neurons and the accumulation of ubiquitinated SNCA within surviving neurons. This fact, in conjunction with previous biochemical and neuropathological evidence linking CMA impairment to the disease, suggests that this model may be useful in investigating relevant mechanisms and therapeutic interventions.
Methods and materials
Production of rAAVs
rAAV-sh[LAMP2A] (L1 and L2) and rAAV-sh[control] (scrambled) were generated by ligating annealed oligonucleotides targeting rat endogenous Lamp2a (L1: 5′-TGCAGTTG-TGGCGATGATAATC-3′, L2: 5′-TGCGCCATCATACTGGATATTC-3′) or a control sequence (scr: 5′-TGCTGATTCCGC-CTAAAGATTC-3′) into the HpaI/XhoI sites of the pA2SGW-Synapsin-GFP-U6-siRNA rAAV vector. This vector was derived from the pA2SGW-Synapsin-GFP vector (a gift from Deniz Kirik, Lund University), by inserting the Rnu6 promoter and the relative siRNA sequences downstream of GFP. High titer and purity rAAV vectors were generated by cotransfection of HEK293 cells with the rAAV backbone plasmid and the helper AAV6 (pDP6) plasmid (kindly provided by Deniz Kirik, Lund University), using the calcium-phosphate method, as previously described.Citation25 To determine the titer of the viral stock solutions quantitative PCR with primers and probes targeting the ITR (inverted terminal repeats) sequence was performed. The final titer of the used rAAVs was 1.9E14 gc/mL, 1.4E14 gc/mL, and 1.8E14 gc/mL for rAAV6 expressing L1, L2, and scr siRNAs, respectively.
Animals
Eight-wk-old female Wistar rats (180–200 g) were housed (3–4 animals/cage) with free access to food and water under a 12-h light/dark cycle. All experimental procedures performed were approved by the Ethical Committee for Use of Laboratory Animals in the Biomedical Research Foundation of Athens.
Surgical procedures
All surgical procedures were performed under isoflurane (Abbott, B506) anesthesia. After placing the animal into a stereotaxic frame (Kopf Instruments, USA), 2 μL of rAAV6 solution (with final titer of 7E13 gc/mL) was injected unilaterally into the right SN using the following coordinates: −5.0 mm anteroposterior, −2.0 mm mediolateral from the bregma, and −7.2 mm dorsoventral from the dura, according to the rat stereotaxic atlas.Citation36 The tooth bar was adjusted to −2.3 mm. Injection was performed using a pulled glass capillary (diameter of approximately 60–80 μm) attached to a Hamilton syringe with a 22s gauge needle. After delivery of the viral vector using an injection rate of 0.1 μL/15 sec the capillary was held in place for 5 min, retracted 0.1 μm, and, after 1 min, was slowly withdrawn from the brain.
Cell culture and transfections
PC12 cells were cultured in RPMI 1640 (Gibco Life Technologies, 11875–093) with 10% horse serum (Biowest., S0960) and 5% fetal bovine serum (Biowest., S1810) on home-made rat tail collagen-coated plates. Transfection with the scr, L1 and L2 rAAV vector plasmids was performed with the calcium-phosphate precipitation method and cells were lysed 48 h later for western blot analysis.
Western blotting
For the biochemical analysis of the ventral midbrain and striatal tissues, the animals were decapitated at 4, 8 and 12 wk following injection; the brains were harvested, dissected on ice to obtain the region of interest, and frozen immediately. All animals were processed in a similar manner. Tissue was stored at −80°C until further use. The ventral midbrain encompassing the SN and the striata from the injected and uninjected hemispheres were rapidly dissected and homogenized in Triton extraction buffer (150 mM NaCl [Lach-Ner, 30093], 50 mM Tris [Sigma-Aldrich, T1503], pH 7.6, 1% Triton X-100 [Applichem, A1388], 2 mM EDTA [Applichem, A1104]) containing phosphatase inhibitors (Roche, 11836153001). The lysate was sonicated and then centrifuged (100,000 × g for 60 min) to collect the supernatant fraction. Primary antibodies included antibodies to LAMP2A/lgp96 (1:1,000; Thermo Fisher Scientific, 51–2200), LAMP1/LY1C6 (1:1,000; Santa Cruz Biotechnology, 65236), SNCA/syn-1/α-Synuclein (1:1,000; BD Biosciences, 619787), CTSD/cathepsin D (1:1,000; Santa Cruz Biotechnology, sc6486), TH (1:2,000; EMD Millipore, MAB318), GFP (1:1,000; Synaptic Systems, 132002), LC3 (1:1,000; MBL Life Science, PM036), SQSTM1/p62 (1:1,000; MBL Life Science, PM045), and TUBG/tubulin gamma (1:2,000; Sigma-Aldrich, T5326). The intensity of the immunoreactive bands was estimated by densitometric quantification using the Gel Analyzer v1.0 software.
Isolation of lysosomes
Two wk following injections, the ventral midbrain tissue from the injected and uninjected hemispheres from 3 rats per condition were pooled and homogenized in 0.25 M sucrose (Applichem, A4734). Isolation of lysosomes from a light mitochondrial-lysosomal fraction was performed using a discontinuous density gradient, as described,Citation37,38 using nycodenz (Progen Biotechnik, 1002424), a nonionic derivative of metrizoic acid, instead of metrizamide. Following isolation, lysosomal integrity was verified by measuring the activity of HEXB/β-hexosaminidase and preparations with more than 10% broken lysosomes after isolation or more than 20% at the end of the incubation were discarded.
CMA of recombinant SNCA by isolated lysosomes
Transport of human recombinant SNCA, a bona fide CMA substrate, into isolated lysosomes from the contralateral and ipsilateral sides of scr, L1 and L2-injected animals was analyzed using an in vitro system as previously described.Citation18 Briefly, 0.2 μg of recombinant SNCA (kindly provided by Dr. Hilal Lashuel, EPFL) were incubated with freshly isolated midbrain lysosomes in MOPS buffer (10 mM 3-[N-morpholino] propanesulfonic acid [Sigma-Aldrich, M1254] pH 7.3, 0.3 M sucrose [Applichem, A4734]), in the presence of 0.6 μg recombinant HSPA8/HSC70 (Enzo Life Sciences, AD1-SPP-751-D) for 20 min at 37°C. Where indicated, lysosomes were pre-incubated with a cocktail of proteinase inhibitors (Roche, 11836153001) for 10 min at 0°C.Citation38 At the end of the incubation lysosomes were collected by centrifugation, washed and subjected to SDS-PAGE and immunoblotted for SNCA, LAMP2A, CTSD and TUBG.
HPLC
Dopamine and its metabolites (DOPAC, HVA, 3MT) were measured in the brain tissue homogenates with reverse phase ion-pair chromatography on an isocratic pump (YL9112 Instrument Co., Ltd., Gyeonggi-do, Korea) coupled with an electrochemical detector (Bioanalytical Systems, Inc., Indianapolis, IN, USA) as previously described,Citation25 with minor modifications. Briefly, the columns used were YMC Triart C18 100 × 2 mm, 3-μm particle size, the mobile phase consisted of an acetonitrile (Sigma-Aldrich, 271004)-50 mM phosphate buffer (1:9 dilution; Thermo Fisher Scientific, 70011036), pH 3.0, containing 300 mg/l 5-octylsulfate sodium salt (Merck Millipore, 112268) as the ion-pair reagent and 20 mg/l Na2EDTA (Sigma-Aldrich, 03683). The working electrode (glassy carbon) was set at + 0.8 mV. Samples were diluted (1:10) with homogenization buffer before injection. Specific HPLC software (DataApex, Clarity) was used to quantify neurotransmitter levels by comparing the area under the peaks with the area of external reference standards. Results are expressed as percent DA of the contralateral side.
Immunohistochemistry
Animals were perfused intracardially through the ascending aorta with phosphate-buffered saline (PBS; Thermo Fisher Scientific, 70011036) under isoflurane anesthesia, followed by ice-cold 4% paraformaldehyde (Sigma-Aldrich, P6148). The brains were post-fixed for 24 h in the same preparation of paraformaldehyde and then transferred to 15% sucrose overnight, before being incubated in 30% sucrose until sectioning. The brains were sectioned with a sliding microtome (Thermo Fisher Scientific, 910010) through the coronal plane at 35-mm increments, and every section throughout the striatum and the SN were collected. General immunohistochemical stainings were carried out in free-floating sections as described previously,Citation39 with the exception of LAMP2A, in which a modified protocol utilizing 30 sec of freezing MeOH (Sigma-Aldrich, 322415) post-fixation and citric acid antigen retrieval (80°C, 30 min) were added preceding the blocking step. The primary antibodies used were against TH (1:2,000; EMD Millipore, mouse MAB318 and rabbit AB152), LAMP2A (1:800), LAMP1 (1:400), SNCA, SNCA Syn303 (1:1000; Biolegend, 824301), UBIQUITIN (1:1,000; DAKO, Z0458), RBFOX3/NeuN (1:500, EMD Millipore, MAB377), LC3, SQSTM1, GFAP (1:1,000; DAKO, Z0334), AIF1/IBA1 (1:1,000; WAKO, 019741) and GFP. The fluorescent secondary antibodies used were Biotium CF488A (1:2000; 20010 ms, 20012 rb), Biotium CF555 (1:2000; 20030 ms, 20033 rb), and Jackson Immunoresearch Affinipure Cy5 (1:400, 115-175-146). Images were obtained with a Leica SP5 mark II with conventional photon-multiplier tube, at 23°C using the Leica Advanced Fluorescence v2.7 acquisition software (Leica Microsystems, Wetzlar, Germany). The ImageJ v2.0.0 software was used for flattening and cropping of confocal stacks in preparation of the representative figures. In , a rolling ball background removal algorithm (diameter set at 50 μm) was used to process the LAMP2A (red) signal.
Proteinase K assay
After antigen retrieval, free-floating sections were treated with 2.5 μg/ml proteinase K (Invitrogen, 25530049) in PBS (1x) for 10 min at room temperature, and then washed in PBS for 30 min.
Stereology
TH (tyrosine hydroxylase)-positive nigral neuron density was estimated by an unbiased stereological quantification method utilizing the optical fractionator principle embedded within the Stereo Investigator v10.0 software (MicroBrightField Bioscience, Magdeburg, Germany), a motorized stage (MAC5000, Ludl Electronic Products, Ltd., NY, USA) and a top-mounted camera (QImaging, MicroBrightField Bioscience, Magdeburg, Germany) with the light microscope (Leica, DMRA2, Wetzlar, Germany). Every sixth section throughout the whole rostro-caudal axis of the substantia nigra was included, the region of interest was outlined with a Leica 2.5×0.07 objective (50601) and counting was performed using a Leica 63×1.3 glycerol immersion objective (506192). A random start and systematic sampling was applied. Counting parameters were adjusted to achieve at least 100 counts per hemisphere. A single blinded investigator performed all quantifications and analysis. A coefficient of error (Gundersen, m = 1) of ≤ 0.1 was accepted. Data are means from all animals and expressed as percent of the contralateral side.
Automated image analysis
Confocal z-stacks of 512 × 512 pixels were collected throughout the whole optical thickness of the mounted sections using a z-step of 0.9 microns, imaging through a Leica TCS SP5 (Wetzlar, Germany). SNCA-immunolabeled samples were imaged using a water-immersion Leica HCX APO 63×1.20 objective, and samples immunostained for LAMP2A were imaged using an oil-immersion Leica HCX APO 100 × 1.35 objective. Three to 6 stacks were collected per animal, with an average 10–20 GFP+ cell profiles visible in each field of view. Quantifications were done with the Imaris software suite (v7.7.2, Bitplane AG), using a static set of parameters to isolate GFP+ cell profiles, and then masking the channel containing the LAMP2A or SNCA signal using said profiles. The masking of the GFP+ signal was based on intensity and sphericity and the quantification of immunofluorescent puncta in other channels filtered by the GFP+ mask was done using the automated spot counter plug-in. For both and , the masked signal represents immunofluorescence from the full depth of the confocal stack, masked by all GFP+ signal above threshold (see also online videos S1-6). Following the filtering step, puncta were counted using fixed criteria and expressed as number of puncta/GFP+ cell profile. For GFAP and AIF1 quantifications, total fluorescence was measured within GFP+ neuronal profiles and normalized to the average background signal of the whole image. Values from all stacks were averaged to produce a single value per animal, and data are expressed as fold change of the average in the scrambled control group.
Electron microscopy
Tissue preparation: Rat brain tissues were prepared according to Moss and Bolam.Citation40 Briefly, animals were perfused intracardially through the ascending aorta with 50 ml PBS under isoflurane anesthesia, followed by 200 ml of fixative (0.1 M phosphate buffer, pH 7.4, 3% paraformaldehyde, 0.1% glutaraldehyde [Sigma-Aldrich, G5882]) for 25 min. Free fixative was removed by post-perfusion with PBS and brains were removed and sectioned through the coronal plane at the level of SNpc at 65-mm increments, using a vibrating blade microtome (VT1000S, Leica, Wetzlar, Germany).
Immunohistochemistry: Pre-embedding immunohistochemical procedures (immunogold-silver and immunoperoxidase labeling) were performed on free-floating sections as describedCitation41 with some modifications. Briefly, 65-μm-thick sections were blocked, incubated overnight with the mouse SNCA antibody (1:25), followed by incubation with nanogold anti-mouse IgG (1:50; Nanoprobes, 2001) and HQ Silver enhancement (Nanoprobes, 2012). Subsequently, the sections were incubated with the TH antibody (1:2,000; Millipore, AB152) and detection of the signal was performed with the Vectastain Elite ABC Kit (Vector Laboratories, PK-6101) and the DAB + Substrate Chromogen System (DAKO, K3468). The sections were finally post-fixed with osmium tetroxide, dehydrated in an ascending ethanol series, flat-embedded in epoxy resin [mixture of Glycid Ether 100 (Serva, 21045.02), 2-Dodecenylsuccinic-acid anhydrade (Serva, 20755.02), 2,4,6-Tris (dimethyl-aminomethyl) phenol (Serva, 36975.01), Remlan M-1 (Serva, 13825.02) and Di-n-butyl phthalate, 99% (Alfa Aesar, A13257)] using ACLAR Film (EMS, 50425) and the specimens were allowed to polymerize at 60°C for 24 h. All sections were examined under the light microscope and the selected small areas from the SNpc right and left, which were characterized from the TH-positive neurons, were cut, re-embedded on the top of resin blocks and polymerized again at 60°C for 24 h. Ultrathin sections (65-nm thick) cut in a Leica EM UC7 Ultramicrotome (Leica Microsystems, Vienna, Austria) were lead-stained and examined under a Philips EM 420 electron microscope (Philips Electron Optics, Eindhoven, The Netherlands).
Behavioral testing
Amphetamine rotations: Animals at 4, 8 and 12 wk post-injection were treated intraperitoneally with 2.5 mg/kg amphetamine and rotations were measured for 90 min. Specifically, rats were placed in an acrylic bowl (30-cm diameter) with an overhead video camera and their rotational activity was tracked with specialized video tracking software (Noldus Ethovision XT9, Noldus Information Technolgy Inc., Wageningen, The Netherlands). Data are expressed as the net difference between the number of clockwise and counterclockwise rotations/min.
Cylinder test: Forelimb use asymmetry was assessed using the cylinder test. Individual animals were placed in a transparent acrylic cylinder (18-cm diameter × 20-cm height) and spontaneous activity was video-recorded from below for 5 min. Both, contralateral and ipsilateral weight-bearing forepaw placements on the wall of the cylinder were recorded. Data are expressed as percentage of contralateral forelimb use: ([contra + ½ both]/[ipsi + contra + both])x100 as previously described.Citation42
Statistical analysis
The data are shown as the mean ± SEM. Unless stated otherwise, statistical analysis was carried out with GraphPad Prism 5 using one-way or 2-way analysis of variance (ANOVA) followed by Tukey's or Fisher's LSD multiple comparisons post-test. Nonparametric Pearson's rho was used to assess the correlation between different variables of each sample, as indicated. Differences were considered significant for P < 0.05.
Abbreviations
| AAV | = | adeno-associated virus |
| AIF1/IBA1 | = | allograft inflammatory factor 1 |
| AV | = | autophagic vacuole |
| CMA | = | chaperone-mediated autophagy |
| CTSD | = | cathepsin D |
| GFAP | = | glial fibrillary acidic protein |
| LAMP2A | = | lysosomal-associated membrane protein 2A |
| LBs | = | Lewy bodies |
| MAP1LC3/LC3 | = | microtubule-associated protein 1 light chain 3 |
| PD | = | Parkinson disease |
| PK | = | proteinase K |
| shRNA | = | short hairpin RNA |
| SNCA | = | synuclein α |
| SNpc | = | substantia nigra pars compacta |
| TH | = | tyrosine hydroxylase |
| TUBG | = | tubulin gamma |
Disclosure of potential conflicts of interest
No potential conflicts of interest were disclosed.
KAUP_A_1214777_Supplementary_material.zip
Download Zip (9.3 MB)Funding
This work was supported by an ARISTEIA I (GSRT) grant to LS. Additional support was provided by the NEURASYNC FP7 grant to LS.
Related Research Data
References
- Cuervo AM. Chaperone-mediated autophagy: Dice's ‘wild’ idea about lysosomal selectivity. Nat Rev Mol Cell Biol 2011; 12:535-41; PMID:21750569; http://dx.doi.org/10.1038/nrm3150
- Dice JF. Peptide sequences that target cytosolic proteins for lysosomal proteolysis. Trends Biochem Sci 1990; 15:305-9; PMID:2204156; http://dx.doi.org/10.1016/0968-0004(90)90019-8
- Chiang HL, Terlecky SR, Plant CP, Dice JF. A role for a 70-kgdalton heat shock protein in lysosomal degradation of intracellular proteins. Science 1989; 246:382-5; PMID:2799391; http://dx.doi.org/10.1126/science.2799391
- Cuervo AM, Dice JF. A receptor for the selective uptake and degradation of proteins by lysosomes. Science 1996; 273:501-3; PMID:8662539; http://dx.doi.org/10.1126/science.273.5274.501
- Bandyopadhyay U, Kaushik S, Varticovski L, Cuervo AM. The chaperone-mediated autophagy receptor organizes in dynamic protein complexes at the lysosomal membrane. Mol Cell Biol 2008; 28:5747-63; PMID:18644871; http://dx.doi.org/10.1128/MCB.02070-07
- Cuervo AM, Knecht E, Terlecky SR, Dice JF. Activation of a selective pathway of lysosomal proteolysis in rat liver by prolonged starvation. Am J Physiol 1995; 269:C1200-8; PMID:7491910
- Hubbi ME, Hu H, Kshitiz Ahmed I, Levchenko A, Semenza GL. Chaperone-mediated autophagy targets hypoxia-inducible factor-1alpha (HIF-1alpha) for lysosomal degradation. J Biol Chem 2013; 288:10703-14; PMID:23457305; http://dx.doi.org/10.1074/jbc.M112.414771
- Kiffin R, Christian C, Knecht E, Cuervo AM. Activation of chaperone-mediated autophagy during oxidative stress. Mol Biol Cell 2004; 15:4829-40; PMID:15331765; http://dx.doi.org/10.1091/mbc.E04-06-0477
- Koga H, Martinez-Vicente M, Arias E, Kaushik S, Sulzer D, Cuervo AM. Constitutive upregulation of chaperone-mediated autophagy in Huntington's disease. J Neurosci 2011; 31:18492-505; PMID:22171050; http://dx.doi.org/10.1523/JNEUROSCI.3219-11.2011
- Park C, Suh Y, Cuervo AM. Regulated degradation of Chk1 by chaperone-mediated autophagy in response to DNA damage. Nat Commun 2015; 6:6823; PMID:25880015; http://dx.doi.org/10.1038/ncomms7823
- Eskelinen EL, Cuervo AM, Taylor MR, Nishino I, Blum JS, Dice JF, Sandoval IV, Lippincott-Schwartz J, August JT, Saftig P. Unifying nomenclature for the isoforms of the lysosomal membrane protein LAMP-2. Traffic 2005; 6:1058-61; PMID:16190986; http://dx.doi.org/10.1111/j.1600-0854.2005.00337.x
- Massey AC, Kaushik S, Sovak G, Kiffin R, Cuervo AM. Consequences of the selective blockage of chaperone-mediated autophagy. Proc Natl Acad Sci U S A 2006; 103:5805-10; PMID:16585521; http://dx.doi.org/10.1073/pnas.0507436103
- Cuervo AM, Dice JF. Unique properties of lamp2a compared to other lamp2 isoforms. J Cell Sci 2000; 113 Pt 24:4441-50; PMID:11082038
- Cuervo AM, Dice JF. Age-related decline in chaperone-mediated autophagy. J Biol Chem 2000; 275:31505-13; PMID:10806201; http://dx.doi.org/10.1074/jbc.M002102200
- Zhang C, Cuervo AM. Restoration of chaperone-mediated autophagy in aging liver improves cellular maintenance and hepatic function. Nat Med 2008; 14:959-65; PMID:18690243; http://dx.doi.org/10.1038/nm.1851
- Schneider JL, Suh Y, Cuervo AM. Deficient chaperone-mediated autophagy in liver leads to metabolic dysregulation. Cell Metab 2014; 20:417-32; PMID:25043815; http://dx.doi.org/10.1016/j.cmet.2014.06.009
- Vogiatzi T, Xilouri M, Vekrellis K, Stefanis L. Wild type α-synuclein is degraded by chaperone-mediated autophagy and macroautophagy in neuronal cells. J Biol Chem 2008; 283:23542-56; PMID:18566453; http://dx.doi.org/10.1074/jbc.M801992200
- Cuervo AM, Stefanis L, Fredenburg R, Lansbury PT, Sulzer D. Impaired degradation of mutant α-synuclein by chaperone-mediated autophagy. Science 2004; 305:1292-5; PMID:15333840; http://dx.doi.org/10.1126/science.1101738
- Lashuel HA, Overk CR, Oueslati A, Masliah E. The many faces of α-synuclein: from structure and toxicity to therapeutic target. Nat Rev Neurosci 2013; 14:38-48; PMID:23254192; http://dx.doi.org/10.1038/nrn3406
- Vekrellis K, Stefanis L. Targeting intracellular and extracellular α-synuclein as a therapeutic strategy in Parkinson disease and other synucleinopathies. Exp Opin Therapeutic Targets 2012; 16:421-32; PMID:22480256; http://dx.doi.org/10.1517/14728222.2012.674111
- Alvarez-Erviti L, Rodriguez-Oroz MC, Cooper JM, Caballero C, Ferrer I, Obeso JA, Schapira AH. Chaperone-mediated autophagy markers in Parkinson disease brains. Arch Neurol 2010; 67:1464-72; PMID:20697033; http://dx.doi.org/10.1001/archneurol.2010.198
- Murphy KE, Gysbers AM, Abbott SK, Spiro AS, Furuta A, Cooper A, Garner B, Kabuta T, Halliday GM. Lysosomal-associated membrane protein 2 isoforms are differentially affected in early Parkinson disease. Mov Disord 2015; 30(12):1639-47; PMID:25594542
- Murphy KE, Gysbers AM, Abbott SK, Tayebi N, Kim WS, Sidransky E, Cooper A, Garner B, Halliday GM. Reduced glucocerebrosidase is associated with increased α-synuclein in sporadic Parkinson disease. Brain 2014; 137:834-48; PMID:24477431; http://dx.doi.org/10.1093/brain/awt367
- Collier TJ, Kanaan NM, Kordower JH. Ageing as a primary risk factor for Parkinson disease: evidence from studies of non-human primates. Nat Rev Neurosci 2011; 12:359-66; PMID:21587290; http://dx.doi.org/10.1038/nrn3039
- Xilouri M, Brekk OR, Landeck N, Pitychoutis PM, Papasilekas T, Papadopoulou-Daifoti Z, Kirik D, Stefanis L. Boosting chaperone-mediated autophagy in vivo mitigates α-synuclein-induced neurodegeneration. Brain 2013; 136:2130-46; PMID:23757764; http://dx.doi.org/10.1093/brain/awt131
- Mak SK, McCormack AL, Manning-Bog AB, Cuervo AM, Di Monte DA. Lysosomal degradation of α-synuclein in vivo. J Biol Chem 2010; 285:13621-9; PMID:20200163; http://dx.doi.org/10.1074/jbc.M109.074617
- Duda JE, Giasson BI, Mabon ME, Lee VM, Trojanowski JQ. Novel antibodies to synuclein show abundant striatal pathology in Lewy body diseases. Ann Neurol 2002; 52:205-10; PMID:12210791; http://dx.doi.org/10.1002/ana.10279
- Xilouri M, Vogiatzi T, Vekrellis K, Park D, Stefanis L. Abberant α-synuclein confers toxicity to neurons in part through inhibition of chaperone-mediated autophagy. PloS One 2009; 4:e5515; PMID:19436756; http://dx.doi.org/10.1371/journal.pone.0005515
- Burke RE, O'Malley K. Axon degeneration in Parkinson disease. Exp Neurol 2013; 246:72-83; PMID:22285449; http://dx.doi.org/10.1016/j.expneurol.2012.01.011
- Alvarez-Erviti L, Seow Y, Schapira AH, Rodriguez-Oroz MC, Obeso JA, Cooper JM. Influence of microRNA deregulation on chaperone-mediated autophagy and α-synuclein pathology in Parkinson disease. Cell Death Dis 2013; 4:e545; PMID:23492776; http://dx.doi.org/10.1038/cddis.2013.73
- Rothaug M, Stroobants S, Schweizer M, Peters J, Zunke F, Allerding M, D'Hooge R, Saftig P, Blanz J. LAMP-2 deficiency leads to hippocampal dysfunction but normal clearance of neuronal substrates of chaperone-mediated autophagy in a mouse model for Danon disease. Acta Neuropathologica Commun 2015; 3:6; PMID:25637286; http://dx.doi.org/10.1186/s40478-014-0182-y
- Eskelinen EL, Schmidt CK, Neu S, Willenborg M, Fuertes G, Salvador N, Tanaka Y, Lullmann-Rauch R, Hartmann D, Heeren J, et al. Disturbed cholesterol traffic but normal proteolytic function in LAMP-1/LAMP-2 double-deficient fibroblasts. Mol Biol Cell 2004; 15:3132-45; PMID:15121881; http://dx.doi.org/10.1091/mbc.E04-02-0103
- Ahmed I, Liang Y, Schools S, Dawson VL, Dawson TM, Savitt JM. Development and characterization of a new Parkinson disease model resulting from impaired autophagy. J Neurosci 2012; 32:16503-9; PMID:23152632; http://dx.doi.org/10.1523/JNEUROSCI.0209-12.2012
- Friedman LG, Lachenmayer ML, Wang J, He L, Poulose SM, Komatsu M, Holstein GR, Yue Z. Disrupted autophagy leads to dopaminergic axon and dendrite degeneration and promotes presynaptic accumulation of α-synuclein and LRRK2 in the brain. J Neurosci 2012; 32:7585-93; PMID:22649237; http://dx.doi.org/10.1523/JNEUROSCI.5809-11.2012
- Tanaka Y, Guhde G, Suter A, Eskelinen EL, Hartmann D, Lullmann-Rauch R, Janssen PM, Blanz J, von Figura K, Saftig P. Accumulation of autophagic vacuoles and cardiomyopathy in LAMP-2-deficient mice. Nature 2000; 406:902-6; PMID:10972293; http://dx.doi.org/10.1038/35022595
- Paxinos G, Watson C, eds. The Rat Brain in Stereotaxic Coordinates. Academic Press, 1998.
- Storrie B, Madden EA. Isolation of subcellular organelles. Meth Enzymol 1990; 182:203-25; PMID:2156127; http://dx.doi.org/10.1016/0076-6879(90)82018-W
- Cuervo AM, Dice JF, Knecht E. A population of rat liver lysosomes responsible for the selective uptake and degradation of cytosolic proteins. J Biol Chem 1997; 272:5606-15; PMID:9038169; http://dx.doi.org/10.1074/jbc.272.9.5606
- Xilouri M, Brekk OR, Kirik D, Stefanis L. LAMP2A as a therapeutic target in Parkinson disease. Autophagy 2013; 9:2166-8; PMID:24145820; http://dx.doi.org/10.4161/auto.26451
- Moss J, Bolam JP. A dopaminergic axon lattice in the striatum and its relationship with cortical and thalamic terminals. J Neurosci 2008; 28:11221-30; PMID:18971464; http://dx.doi.org/10.1523/JNEUROSCI.2780-08.2008
- Miner LH, Jedema HP, Moore FW, Blakely RD, Grace AA, Sesack SR. Chronic stress increases the plasmalemmal distribution of the norepinephrine transporter and the coexpression of tyrosine hydroxylase in norepinephrine axons in the prefrontal cortex. J Neurosci 2006; 26:1571-8; PMID:16452680; http://dx.doi.org/10.1523/JNEUROSCI.4450-05.2006
- Schallert T. Behavioral tests for preclinical intervention assessment. NeuroRx 2006; 3:497-504; PMID:17012064; http://dx.doi.org/10.1016/j.nurx.2006.08.001