
ABSTRACT
Death receptors of TNFSF10/TRAIL (tumor necrosis factor superfamily member 10) contribute to immune surveillance against virus-infected or transformed cells by promoting apoptosis. Many viruses evade antiviral immunity by modulating TNFSF10 receptor signaling, leading to persistent infection. Here, we report that hepatitis B virus (HBV) X protein (HBx) restricts TNFSF10 receptor signaling via macroautophagy/autophagy-mediated degradation of TNFRSF10B/DR5, a TNFSF10 death receptor, and thus permits survival of virus-infected cells. We demonstrate that the expression of the TNFRSF10B protein is dramatically reduced both in liver tissues of chronic hepatitis B patients and in cell lines transfected with HBV or HBx. HBx-mediated downregulation of TNFRSF10B is caused by the lysosomal, but not proteasomal, degradation pathway. Immunoblotting analysis of LC3B and SQSTM1, and microscopy analysis of tandem-fluorescence-tagged LC3B revealed that HBx promotes complete autophagy. Inhibition of autophagy with a pharmacological inhibitor and LC3B knockdown revealed that HBx-induced autophagy is crucial for TNFRSF10B degradation. Immunoprecipitation and GST affinity isolation assays showed that HBx directly interacts with TNFRSF10B and recruits it to phagophores, the precursors to autophagosomes. We confirmed that autophagy activation is related to the downregulation of the TNFRSF10B protein in liver tissues of chronic hepatitis B patients. Inhibition of autophagy enhanced the susceptibility of HBx-infected hepatocytes to TNFSF10. These results identify the dual function of HBx in TNFRSF10B degradation: HBx plays a role as an autophagy receptor–like molecule, which promotes the association of TNFRSF10B with LC3B; HBx is also an autophagy inducer. Our data suggest a molecular mechanism for HBV evasion from TNFSF10-mediated antiviral immunity, which may contribute to chronic HBV infection.
Introduction
Autophagy is a major catabolic process for degradation and recycling of damaged organelles and long-lived proteins that are engulfed within double-membraned vacuoles (autophagosomes) and then transported to lysosomes (which become autolysosomes after fusion of the 2 compartments). This process plays an essential role in the maintenance of cellular homeostasis and many physiological and pathological processes such as suppression of tumor development and restriction of pathogen replication.Citation1 Under cellular stress conditions such as nutrient deficiency, chemotherapy, and virus infection, autophagy is rapidly activated and affects the survival of virus-infected or transformed cells.Citation2,3 Emerging lines of evidence suggest that some viruses have developed strategies to counteract autophagy, whereas others induce or use the autophagy machinery as a proviral factor to favor viral replication.Citation2
Hepatitis B virus (HBV) is a noncytopathic, hepatotropic DNA virus and a major pathogen causing liver disease worldwide.Citation4 Although HBV vaccines have reduced the number of new HBV infections, they do not benefit patients with chronic HBV infection, who have a high risk for the development of liver cirrhosis and hepatocellular carcinoma.Citation5 HBV X protein (HBx) is an essential viral protein that is required for successful replication and maintenance of viral infection in mouse models and various cultured cell systems.Citation6,7 HBx can induce autophagy in liver cell lines by upregulating BECN1 (Beclin 1) expression.Citation8 HBx can trigger autophagy by directly interacting with the class III phosphatidylinositol 3-kinase (PtdIns3K) to favor virus replication.Citation9 Although the fact that HBx induces autophagy is well established, the role of autophagy in HBV-related liver pathology is poorly understood.
TNFSF10/TRAIL (tumor necrosis factor superfamily member 10) is a typical death ligand expressed on natural killer cells and cytotoxic T lymphocytes that contributes to immune surveillance against virus-infected or transformed cells via the death receptor TNFRSF10B/DR5 (TNF receptor superfamily member 10b).Citation10,11 Upon ligand binding, TNFRSF10B recruits the key adapter molecule FADD (Fas-associated via death domain) to the cell membrane and induces the caspase cascade, which can kill not only the virus-infected or tumor cells but also immune cells to terminate the immune response, limit tissue damage and restore homeostasis when the infection is controlled.Citation10,11 Therefore, the amount of TNFRSF10B at the cell surface may determine the strength of the apoptotic response to physiological levels of TNFSF10. Notably, death receptor signaling is a critical target modulated by viruses to evade TNFSF10-mediated cell death. Death receptors are directly targeted by adenovirus and human cytomegalovirus, which downregulate the expression of these proteins on the cell surface.Citation12,13 Some other viruses upregulate anti-apoptotic proteins and thus inhibit death receptor signaling.Citation12 TNFSF10 is abundant in liver tissues and sera of chronic hepatitis B (CHB) patients, implying that TNFSF10 signaling is associated with antiviral response and liver damage in CHB patents.Citation14-17 However, the ability of HBV to induce lifelong chronic infection despite this antiviral response suggests the existence of an evading mechanism that remains to be elucidated.
In the present study, we demonstrate that HBx restricts TNFSF10 receptor signaling via autophagy-mediated degradation of TNFRSF10B (without affecting other apoptosis-related proteins), which may contribute to the protection of HBV-infected cells from TNFSF10-mediated killing. Our finding suggests a novel mechanism for evasion of HBV-infected hepatocytes from antiviral responses.
Results
HBx reduces the expression of TNFRSF10B by post-transcriptional regulation
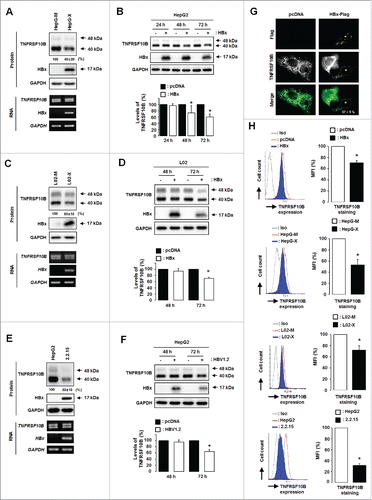
Since the essential role of HBx in noncytopathic viral replication and maintenance of infection is well known,Citation6 we speculated that HBx may dysregulate TNFSF10 receptor signaling and thus lead to HBV persistence by evasion from this antiviral response. To test this hypothesis, we analyzed the expression profiles of TNFRSF10B in HBx-expressing cells. As shown in , the TNFRSF10B protein level was reduced to approximately 40% in cells stably producing HBx under the control of the HBV enhancer/promoter (HepG-X) compared to control cells stably transfected with empty vector (HepG-M); however, there was no change in the expression of TNFRSF10B mRNA. HBx also reduced the level of the TNFRSF10B protein in transiently transfected HepG2 cells (). Similarly, stable or transient expression of HBx reduced the TNFRSF10B level in a normal liver cell line, L02 (). RT-PCR and immunoblot analysis revealed that the TNFRSF10B protein level was reduced to 30 ± 10 % in cells stably transfected with the HBV genome, HepG2.2.15, compared to that in control HepG2 cells, whereas no difference was found in TNFRSF10B mRNA expression (). The downregulation of the TNFRSF10B protein was also observed in cells transiently transfected with HBV1.2mer, a replication-competent HBV construct (). To further confirm the downregulation of the TNFRSF10B protein in HBx-expressing cells, we performed immunocytochemistry analysis after transfection with Flag-tagged HBx. A notable reduction in the TNFRSF10B protein level was observed in 37±5 % of HBx-expressing cells (). Because the expression level of TNFRSF10B on the cell surface is crucial for determining the strength of the apoptotic response to physiological TNFSF10 concentrations,Citation10,11 we determined whether HBx reduces the expression of TNFRSF10B on the cell surface. Flow cytometry analysis revealed that cell surface expression of TNFRSF10B was markedly lower in cells stably or transiently expressing HBx as well as cells stably infected with HBV than in control cells (). These results suggest that HBx downregulates TNFRSF10B during HBV infection.
Figure 1. HBx downregulates the expression of TNFRSF10B in HBV-infected cells. (A) TNFRSF10B expression levels in HepG-X and HepG-M cells were analyzed by semi-quantitative RT-PCR and immunoblot assay. (B) TNFRSF10B expression at the indicated time points after transfection with the control or HBx plasmid in HepG2 cells was analyzed by immunoblot assay. A representative immunoblot and quantification of the TNFRSF10B signal are shown. (C) TNFRSF10B expression levels in L02-X and L02-M cells were analyzed by semi-quantitative RT-PCR and immunoblot assay. (D) TNFRSF10B expression at the indicated time points after transfection of L02 cells with the control or HBx plasmid was analyzed by immunoblot assay. Quantification of the TNFRSF10B signal is shown. (E) Expression levels of TNFRSF10B in HepG2 and HepG2.2.15 cells were analyzed by semi-quantitative RT-PCR and immunoblot assay. (F) TNFRSF10B expression at the indicated time points after transfection in HepG2 cells with the control or HBV1.2mer plasmid was analyzed by immunoblot assay. A representative immunoblot and quantification of the TNFRSF10B signal are shown. (G) Representative immunocytochemical images of TNFRSF10B expression in HepG2 cells transiently transfected with the HBx plasmid. Cells transfected with the HBx-Flag or pcDNA3.1 vector were stained with anti-Flag (red) and anti-TNFRSF10B (green) antibodies. Among the HBx-positive cells, the percentage of cells showing reduced TNFRSF10B expression compared to control cells is indicated. (H) TNFRSF10B expression levels on the surface of HBx-expressing cells, HepG2.2.15 cells, and the corresponding control cells were analyzed by flow cytometry. Relative TNFRSF10B expression on the cell surface was calculated as the percentage of mean fluorescence intensity (MFI) as described in the Materials and Methods. All data are mean ± SD of 3 independent experiments. P-values were obtained by Student t test (*P < 0.05).
HBx-mediated downregulation of TNFRSF10B involves the lysosomal pathway but not the proteasome
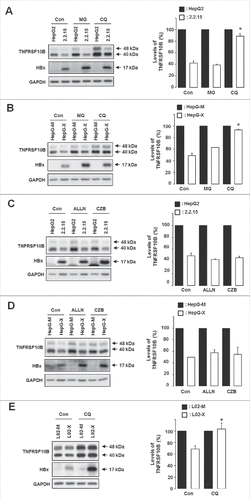
Because HBx-mediated TNFRSF10B downregulation was observed without changes in its mRNA level (), we speculated that HBx induces TNFRSF10B degradation. To test this possibility, we examined the TNFRSF10B protein level following treatment with proteasome or lysosome inhibitors. HBx-mediated degradation of TNFRSF10B was clearly blocked by the lysosome inhibitor chloroquine, whereas MG132, a proteasome inhibitor, showed only a marginal or no effect in both HepG-X and HepG2.2.15 cell lines (). We further tested whether the proteasome pathway is involved in HBx-mediated TNFRSF10B degradation by using 2 other proteasome inhibitors, ALLN and carfilzomib. These inhibitors also showed little effect in both HepG-X and HepG2.2.15 cells but increased the level of the TNFRSF10B protein in the corresponding control cells (). In addition, we confirmed the involvement of the lysosomal pathway in HBx-mediated degradation of TNFRSF10B using L02 cells (). These results indicate that, at steady state, a large pool of the TNFRSF10B protein in HBV-infected cells is degraded by lysosomes through the action of viral HBx.
Figure 2. HBx promotes TNFRSF10B degradation through a lysosomal pathway. (A, B) Expression levels of TNFRSF10B upon treatment with MG132 (MG) or chloroquine (CQ) for 5 h were analyzed by immunoblot assay in HepG2 and HepG2.2.15 cells, and in HepG-M and HepG-X cells, respectively. (C, D) Expression levels of TNFRSF10B upon treatment with ALLN or carfilzomib (CZB) for 5 h were analyzed by immunoblot assay in HepG2 and HepG2.2.15 cells, and in HepG-M and HepG-X cells, respectively. (E) Expression levels of TNFRSF10B upon treatment with CQ for 5 h were analyzed by immunoblot assay in L02-M and L02-X cells. Con, control. Representative immunoblots and quantification of the TNFRSF10B signal are shown. Data are mean ± SD of 3 independent experiments. P-values were obtained by ANOVA (*P < 0.05).
Complete autophagy is triggered by both HBx and HBV
Since lysosomal degradation is the last step of autophagy, we determined whether HBV can induce complete autophagy. HepG2 cells were transiently cotransfected with HBx-HA and the autophagy reporter tandem fluorescent MAP1LC3B/LC3B (microtubule-associated protein 1 light chain 3 β) (tfLC3B).Citation18 This reporter labels autophagosomes with both red and green fluorescent puncta, whereas autolysosomes are labeled with red puncta only (RFP-LC3B puncta) due to the degradation/quenching of acid-labile GFP in lysosomes (). The percentage of autophagic cells was significantly higher among HBx-expressing cells than among control cells (). The numbers of yellow (autophagosomes) and red (autolysosomes) LC3B puncta per cell in merged images were also significantly increased in HBx-expressing cells (). In both HepG-X () and HepG2.2.15 cell lines (), the percentage of cells with autophagosomes or autolysosomes was also significantly increased. These results indicate that HBx can trigger the overall process of autophagy, promoting the formation of autophagosomes and their maturation into autolysosomes.
Figure 3. HBx promotes complete autophagy. Representative immunofluorescence images of autophagic cells (left) and their quantification (right). (A) HepG2 cells were cotransfected with the indicated plasmids and the tfLC3B plasmid. Cells with both red and green fluorescent LC3B dots (autophagosomes) and those with only red fluorescent LC3B dots (autolysosomes) were quantified as described in Materials and Methods. (B, C) HepG-X (B) or HepG2.2.15 (C) cells were transfected with the tfLC3B plasmid, and the formation of autophagosomes and autolysosomes was compared in these and the corresponding control cells as in (A). (D, E) Endogenous levels of LC3B and SQSTM1 in HepG2 (D) and L02 (E) cells were analyzed by immunoblot assay at the indicated time points after transfection with the HBx plasmid or HBV1.2mer. (F) Endogenous levels of LC3B and SQSTM1 in HepG-X, L02-X, and HepG2.2.15 cells were compared with those in the corresponding control cells. All data are mean ± SD of 3 independent experiments. P-values were obtained by Student t test (*P < 0.05).
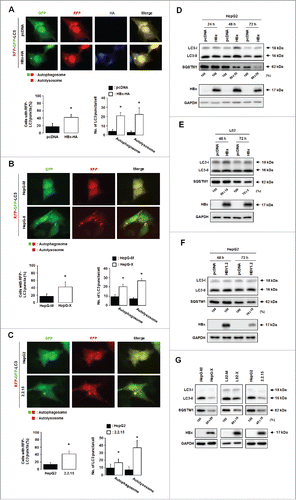
We further investigated the effect of HBx on the autophagic flux by assessing the levels of SQSTM1/p62 (an autophagic flux marker) and LC3B-II (an autophagosome marker).Citation19 Transient expression of HBx reduced the SQSTM1 level from 48 h post-transfection concomitantly with an increase in LC3B-II levels compared to control cells (). In cells transfected with the HBV genome, the reduction of SQSTM1 level was promoted 72 h post-transfection compared to control cells (). In the HepG-X, L02-X, and HepG2.2.15 cell lines, SQSTM1 levels were reduced concomitantly with the reduction in endogenous LC3B-II levels (). The reduction in the level of LC3B-II in stable cells may be due to its degradation at the late stage of autophagy as described previously.Citation19 These data indicate that HBx promotes complete autophagy, resulting in the degradation of host proteins.
HBx-induced autophagy is involved in TNFRSF10B degradation
To determine whether the TNFRSF10B level is reduced by HBx-induced autophagy, we examined the TNFRSF10B protein level after treatment with the autolysosome inhibitor bafilomycin A1 (BAF). BAF increased the levels of SQSTM1 and LC3B-II in all cell lines tested, indicating that the autophagic flux is efficiently blocked. In the presence of BAF, the reduced TNFRSF10B levels in both HepG-X and HepG2.2.15 cells recovered to control levels (), demonstrating that, in steady-state, TNFRSF10B is degraded by autolysosomes and that the HBx-induced autophagic flux promotes TNFRSF10B degradation.
Figure 4. HBx-induced autophagy is responsible for TNFRSF10B degradation and downregulation of its cell surface expression. TNFRSF10B expression levels in HepG-X (A) and HepG2.2.15 (B) cells were analyzed after treatment with bafilomycin A1 (BAF) for the indicated times. The level of TNFRSF10B in control cells at each time point was set to 100%. (C) TNFRSF10B expression levels in HepG2 cells transfected with the HBx plasmid, and in HepG-X and HepG2.2.15 cells were analyzed after LC3B knockdown by siRNA. (D, E) HepG-X cells were transfected with the tfLC3B plasmid and treated with DMSO or 3-MA for 16 h (D), or cultured in normal or starvation (Earle's balanced salt solution, EBSS) medium for 16 h (E). Representative immunofluorescence images of autophagy detected by the presence of RFP-LC3B dots. N indicates the nucleus. Under the same conditions, the expression levels of TNFRSF10B and SQSTM1 were analyzed by immunoblotting. (F) Expression levels of TNFRSF10B on the surface of HepG-X and HepG2.2.15 cells were analyzed by flow cytometry after LC3B knockdown by siRNA or after 3-MA treatment. The relative expression of TNFRSF10B on the cell surface was calculated as the percentage of mean fluorescence intensity (MFI) as described in the Materials and Methods. Data are mean ± SD of 3 independent experiments. P-values were obtained by Student t test (*P < 0.05).
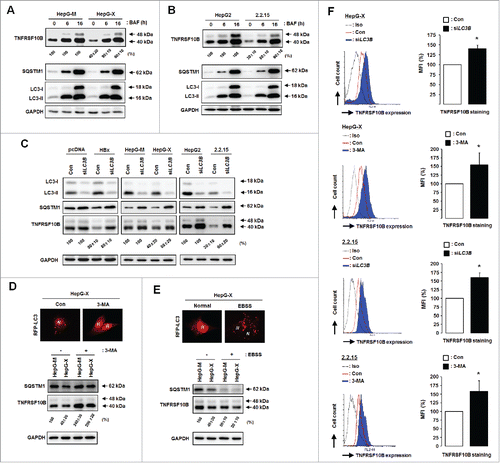
We confirmed the role of HBx-induced autophagy in TNFRSF10B degradation by using LC3B-knockdown cells. Transfection with LC3B siRNA efficiently reduced LC3B expression concomitantly with an increase in SQSTM1 levels in all cell lines tested (). Under this condition, the reduced TNFRSF10B levels in HBx-expressing cells also recovered to control levels. We also confirmed the role of autophagy in TNFRSF10B degradation by treating cells with the autophagy inhibitor 3-methyladenine (3-MA). Fluorescence microscopy and immunoblot analysis showed that 3-MA treatment blocked the formation of RFP-LC3B puncta, increased the SQSTM1 level, and restored the reduced TNFRSF10B level in HBx-expressing cells (). These results indicate that HBx-triggered autophagy is PtdIns3K dependent, in line with a previous report,Citation9 and that this pathway is crucial for HBx-mediated downregulation of the TNFRSF10B protein.
Since nutrient starvation enhances complete autophagy,Citation19 we examined TNFRSF10B degradation under starvation conditions (). A considerable reduction in the TNFRSF10B level was observed in starved HBx-expressing cells compared to control cells, indicating that autophagy induced by environmental conditions could promote HBx-mediated TNFRSF10B degradation. Taken together, our data demonstrate that HBx-induced autophagy plays a crucial role in TNFRSF10B degradation.
To examine whether HBx-induced autophagy downregulates the surface expression of TNFRSF10B, we determined its level in HepG-X and HepG2.2.15 cells either transfected with siRNA targeting LC3B or treated with 3-MA. In both cases, flow cytometry analysis revealed a recovery of the cell surface expression of TNFRSF10B that had been reduced by HBx (). These results indicate that degradation of the intracellular TNFRSF10B protein by autophagy downregulates its cell surface expression.
HBx facilitates the recruitment of TNFRSF10B to the autophagy machinery
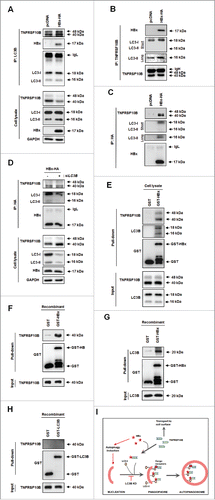
Since HBx promoted autophagy-mediated degradation of TNFRSF10B, we wondered whether there are specific interactions among HBx, TNFRSF10B, and proteins of the autophagy machinery. Immunoprecipitation with anti-LC3B, anti-TNFRSF10B, and anti-HA antibodies revealed that HBx interacts with both TNFRSF10B and LC3B proteins (). Importantly, the interaction between TNFRSF10B and LC3B was enhanced by HBx (). HBx still interacted with TNFRSF10B when LC3B was knocked down, indicating that the interaction between HBx and TNFRSF10B was not mediated by LC3B (). We examined whether HBx directly binds to TNFRSF10B or LC3B using an in vitro glutathione S-transferase (GST) affinity isolation assay. GST-HBx interacted with both TNFRSF10B and LC3B in L02 cell lysates, consistent with the results of immunoprecipitation (). Recombinant TNFRSF10B protein interacted with purified GST-HBx even in the absence of LC3B (). Moreover, recombinant LC3B also directly interacted with GST-HBx in the absence of TNFRSF10B (). However, GST-LC3B did not directly interact with TNFRSF10B when HBx was absent (). These results indicate that HBx is required for and promotes the association of TNFRSF10B with LC3B, suggesting that HBx functions as an autophagy receptor-like protein and selectively targets TNFRSF10B to the autophagy machinery through the interaction among the 3 proteins ().
Figure 5. HBx facilitates the recruitment of TNFRSF10B to the autophagy machinery through ternary complex formation between HBx, TNFRSF10B, and LC3B. (A) Analysis of the interactions among LC3B, TNFRSF10B, and HBx in HBx-expressing cells by immunoprecipitation. At 48 h after transfection with the HBx-HA construct, cell lysates were immunoprecipitated with anti-LC3B antibody and proteins were detected by immunoblot assay. (B, C) Immunoprecipitation with anti-TNFRSF10B and anti-HA antibodies. (D) Analysis of the interaction between HBx and TNFRSF10B in LC3B knockdown cells by immunoprecipitation with anti-HA antibody. (E–G) Analysis of the interactions among LC3B, TNFRSF10B, and HBx in vitro by using a GST affinity isolation assay. GST or GST-HBx immobilized on glutathione resin was incubated with L02 cell lysates (E), purified recombinant TNFRSF10B (F), or purified recombinant LC3B (G). An aliquot of each incubation mixture was analyzed by immunoblotting to examine the input levels of each protein. Another aliquot was used for affinity isolation experiments and the bound proteins were detected by immunoblot assay. (H) Analysis of a direct interaction between LC3B and TNFRSF10B in vitro. Recombinant GST or GST-LC3B immobilized on glutathione resin was incubated with purified recombinant TNFRSF10B, and the affinity isolation assay was performed as above. (I) Proposed mechanism of HBx-mediated TNFRSF10B recruitment to the autophagy machinery. HBx activates autophagy and promotes TNFRSF10B recruitment to the autophagy machinery via interaction with LC3B, leading to TNFRSF10B degradation. This effect is blocked by LC3B knockdown, resulting in TNFRSF10B transport to the cell surface.
Autophagy activity is inversely related to TNFRSF10B expression in liver tissues of CHB patients
To investigate the in vivo relevance of our findings, we examined the relation between autophagy activation and TNFRSF10B expression in the livers of CHB patients. We first compared the expression profiles of TNFRSF10B in liver tissues of CHB patients and normal healthy controls (). Immunohistochemical analysis showed strong TNFRSF10B expression (median expression value = 142 IMPV) in normal hepatocytes, in line with a previous work,Citation20 but weak expression (median expression value = 124 IMPV) in CHB tissues (P<0.0001, Student t test) (), suggesting that TNFRSF10B expression is downregulated in the livers of CHB patients, consistent with a previous report.Citation21
Figure 6. Expression level of TNFRSF10B is inversely related to autophagy activity in liver tissues of CHB patients. (A) Representative immunohistochemical images of TNFRSF10B expression in tissues of normal subjects and CHB patients (upper part) and relative levels of the TNFRSF10B protein (lower part). Paraffin-embedded sections of liver tissue arrays (healthy controls, n = 32; CHB patients, n = 32) were stained with anti-TNFRSF10B antibody. The expression levels of TNFRSF10B are shown as the inverted median pixel value (IMPV) as described in Fig. S1. (B) Representative immunohistochemical images of BECN1 staining (upper part) and analysis of BECN1 positivity (lower part) in CHB liver tissues. Paraffin-embedded sections of the same tissue arrays as in (A) were stained with anti-BECN1 antibody. BECN1 positivity was analyzed as described in the Materials and Methods. (C) Inverse relationship between BECN1 positivity and TNFRSF10B expression levels in clinical liver tissues. TNFRSF10B expression levels in BECN1-positive (n = 19) or -negative (n = 45) tissues were analyzed as described in the Materials and Methods. Representative immunohistochemical images (left) and relative TNFRSF10B expression (right) are shown. Data were obtained from 3 independent experiments and the P-values were obtained by Student t test.
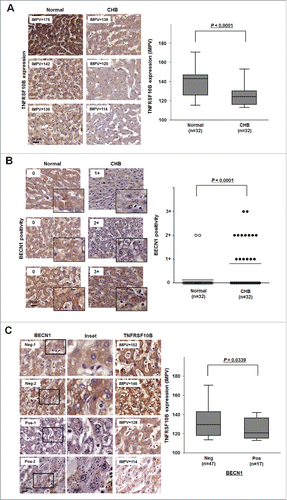
Since BECN1 positivity is a hallmark of HBV-mediated autophagy,Citation8 we examined BECN1 in clinical liver tissues as previously described.Citation22,23 As shown in , diffuse staining for BECN1 was observed in the cytoplasm of hepatocytes in healthy control tissues (regarded as negative), whereas large dark brown puncta were observed (regarded as positive) in those of CHB patients. Strong positivity for BECN1 was observed in 15 of 32 CHB liver tissues (47%), whereas only 4 of 32 healthy controls (12%) were weakly positive (). Statistical analysis demonstrated that this difference in BECN1 positivity was highly significant (P < 0.0001), suggesting that autophagy activation is increased in hepatocytes of CHB patients.
We further investigated the correlation between BECN1 positivity and TNFRSF10B levels in clinical liver samples. BECN1-negative tissues showed strong positivity (median expression value = 132 IMPV) for TNFRSF10B expression, whereas BECN1-positive tissues showed weak positivity (median expression value = 121 IMPV) (). Statistical analysis indicated that BECN1 positivity was inversely related to TNFRSF10B expression in clinical liver tissues (P = 0.0339), suggesting that autophagy activation is associated with the reduction in TNFRSF10B levels in the livers of CHB patients.
HBx-induced autophagy protects cells from TNFSF10-mediated killing
To study the functional consequences of autophagy-mediated downregulation of TNFRSF10B, we determined cell viability and apoptosis upon TNFSF10 treatment. Expression of HBx increased viability and decreased apoptosis in TNFSF10-treated cells (). Activation of CASP8 (caspase 8), CASP3 (caspase 3), and PARP1 (poly[ADP-ribose] polymerase 1) by TNFSF10 treatment was considerably suppressed in HBx-expressing cells (). These data demonstrate that HBx restricts TNFSF10-mediated cell death.
Figure 7. HBx-induced autophagy plays a cytoprotective role against TNFSF10-mediated cell death. (A) Cell viability and (B) apoptosis in cells stably expressing HBx. Cells were treated with TNFSF10 for 16 h, and MTT assay or flow cytometry analysis was performed as described in the Materials and Methods. (C) CASP activation in HepG-X cells. Cells were treated with TNFSF10 (100 ng/ml) for the indicated times, and immunoblot assay was performed. Pro, procaspase. For CASP3, short and long exposures are shown to visualize the procaspase and cleaved (active) forms, respectively. (D, E) Cell viability (left) and apoptosis (right) after LC3B knockdown by siRNA (D) or 3-MA treatment (E). (F) Caspase activity in HepG-X cells upon LC3B knockdown. All data are mean ± SD of 3 independent experiments. P-values were obtained by ANOVA (*P < 0.05).
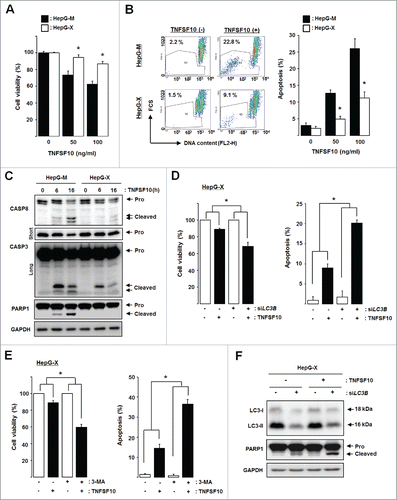
Inhibition of autophagy by LC3B knockdown or 3-MA treatment decreased viability and increased apoptosis in TNFSF10-treated HBx-expressing cells and HepG2.2.15 cells (; Fig. S2). LC3B knockdown restored the activation of PARP1 in HBx-expressing cells (). Together, these results demonstrate that HBx-induced autophagy protects cells from TNFSF10 cytotoxicity through downregulation of TNFRSF10B.
Discussion
Previous studies have shown that HBx can induce autophagy to enhance viral replication in cell culture and transgenic mouse models.Citation1,2 In the present study, we found that HBx is involved in downregulation of the TNFRSF10B protein in virus-infected hepatocytes. TNFRSF10B degradation was associated with HBx-triggered autophagy. In addition, we found a novel function of HBx: it plays a role as an autophagy receptor-like molecule and promotes the association of TNFRSF10B with LC3B through physical interaction, facilitating the recruitment of TNFRSF10B to phagophores. Finally, we demonstrated that HBx-induced autophagy is a cell survival factor that restricts the TNFSF10-mediated antiviral response.
Infection with viruses typically induces the TNFSF10-mediated antiviral response, which limits the spread of viruses. Nevertheless, a number of viruses successfully replicate and cause persistent infection. This is mostly due to many strategies employed by viruses to modulate the apoptotic signaling pathway; these strategies range from restriction of death ligand-receptor interactions to blockage of caspase activation or activation of prosurvival pathways.Citation12,13,24 The essential function of HBx in HBV replication and liver inflammation is well known.Citation6,7 HBx is a multifunctional protein that affects multiple events in infected cells, including signal transduction, proteasome activity, cell proliferation, and apoptosis.Citation6,7,25-29 Numerous lines of evidence suggest that HBx contributes to protection of infected hepatocytes from immune-mediated destruction.Citation6,7 This function of HBx is mediated by the activation of intracellular signaling pathways dependent on NFKB (nuclear factor kappa B), MAPK8/JNK1 (mitogen-activated protein kinase 8), and PDPK1/PKB kinase (3-phosphoinositide dependent protein kinase 1), which promote growth and survival of infected cells.Citation30-34 Indeed, HBx can alter the expression patterns of apoptosis-related genes to promote cell survival and persistence of the carrier state.Citation6,7 In the current study, we found that TNFRSF10B degradation induced by HBx leads to the downregulation of its cell surface expression with no effect on the expression of other apoptosis-related proteins such as CASP8, FADD, BIRC3/cIAP2 (baculoviral IAP repeat containing 3), CFLAR/c-FLIP (CASP8 and FADD like apoptosis regulator), and MCL1 (BCL2 family apoptosis regulator) (Fig. S3). We also determined the effect of HBx on the surface expression of TNFRSF10A/DR4 (TNF receptor superfamily member 10a). Although the surface expression of TNFRSF10A was very low, it was further reduced by HBx expression (Fig. S3). Our findings suggest a new aspect of HBx function: HBx is crucial for the downregulation of TNFRSF10B expression in HBV-infected cells and is involved in limiting TNFSF10 response.
Expression of TNFSF10 receptors can be regulated at the post-transcriptional level via both the proteasome and lysosomal pathways at steady state as well as upon stimulation with TNFSF10.Citation35,36 TNFSF10 receptors are critical targets modulated by viruses to evade immune effector-mediated cell death.Citation12,13 In our study, the TNFRSF10B protein was downregulated at steady-state in HBV-infected and HBx-expressing cells by lysosome-dependent degradation but not by the proteasome pathway, whereas the transcription of its gene was not reduced. This effect may be due to the function of HBx as a proteasome inhibitor.Citation37,38 Complete autophagy is often triggered upon proteasome inhibition as an alternative degradation pathway.Citation39 We demonstrated that complete autophagy is triggered in HBx- or HBV-expressing cells. In HBx-expressing cells, LC3B knockdown and the autolysosome inhibitor BAF completely blocked HBx-mediated TNFRSF10B downregulation, suggesting that LC3B-dependent autophagy is required for HBx-mediated degradation of TNFRSF10B. However, in whole virus-infected cells, LC3B knockdown slightly increased TNFRSF10B downregulation, suggesting that an LC3B-independent lysosomal pathway is also engaged in whole virus-mediated TNFRSF10B degradation. Therefore, TNFRSF10B downregulation by HBV infection is regulated through multiple lysosomal pathways.
We demonstrated that strong degradation of the TNFRSF10B protein in HBx-expressing cells is related to the degree of autophagy activity. Thus, we wondered how HBx specifically targets TNFRSF10B to the autophagy-mediated degradation pathway. Immunoprecipitation showed that HBx facilitated the formation of a ternary complex between TNFRSF10B, LC3B, and HBx, indicating that this interaction is involved in autophagy-mediated TNFRSF10B degradation. Autophagy, which degrades cargoes such as aggregated proteins, damaged organelles, or pathogens, is mediated by selective autophagy receptors such as SQSTM1, NBR1 (NBR1, autophagy cargo receptor), CALCOCO2/NDP52 (calcium binding and coiled-coil domain 2), TAX1BP1 (Tax1 binding protein 1), SPP1/OPN (secreted phosphoprotein 1), CBL (Cbl proto-oncogene), and STBD1 (starch binding domain 1).Citation40,41 Autophagy receptors selectively bind their cargoes and recruit them to the forming autophagosome, leading to degradation of both cargoes and autophagy receptors.Citation40,41 Our in vitro GST affinity isolation assay revealed that HBx directly binds to TNFRSF10B and LC3B, whereas TNFRSF10B cannot interact with LC3B when HBx is absent. These results indicate that HBx functions as an autophagy receptor-like molecule and promotes TNFRSF10B association with phagophores in HBV-infected hepatocytes. Therefore, our data demonstrate that HBx promotes TNFRSF10B degradation in a dual way, by activating autophagy overall and by recruiting TNFRSF10B to the autophagy machinery. Consistent with a previous report,Citation42 we showed in the current study that HBx activates complete autophagy and thus downregulates the surface expression of TNFRSF10B through its degradation. However, Liu et al. reported that HBx reduces lysosomal degradative capacity of autophagy, leading to autophagosome accumulation.Citation43 A recent study demonstrated that autophagosome accumulation in TNFSF10-resistant cancer cells downregulates the surface expression of TNFRSF10B, because intracellular TNFRSF10B is accumulated in autophagosomes.Citation44 Therefore, these reports and our results suggest that HBx downregulates the surface expression of TNFRSF10B despite its inhibitory effect on lysosomal degradative activity of autophagy.
The induction of autophagy is tightly controlled by multiple autophagy-related genes.Citation1 HBx-mediated autophagy can be enhanced by the upregulation of BECN1Citation8 or by the interaction between HBx and PtdIns3K.Citation9 Our data show that HBx-mediated autophagy is inhibited by 3-MA treatment, suggesting the involvement of PtdIns3K. During autophagy activation, PtdIns3K and BECN1 are recruited to the proteins of the autophagy machinery to form a macro-complex located in the proximity of the endoplasmic reticulum and trans-Golgi network.Citation45 Autophagy-active BECN1 can be detected as large puncta by immunostaining analysis.Citation45 Autophagy activation has been evaluated in clinical tissues including non-Hodgkin lymphomas and ovarian cancers by monitoring BECN1 puncta.Citation22,23 Although we did not observe BECN1 upregulation in liver tissues and cell models (data not shown), macro-aggregated BECN1 puncta were abundant in liver tissues of CHB patients compared to normal liver tissues. This observation was in good agreement with TNFRSF10B downregulation. Our data suggest that the BECN1-containing PtdIns3K-dependent pathway is important for HBx-mediated downregulation of the TNFRSF10B protein in the livers of CHB patients.
Although autophagy plays a major role in cellular homeostasis, crosstalk between autophagy and apoptosis has been reported.Citation46 Subsequently, it has been elucidated that autophagy can be induced under stress conditions to promote cell survival. A study using Atg7-deficient mice revealed that autophagy -protects hepatocytes from TNF-dependent cytotoxicity.Citation47 Another study showed that autophagy accelerates the degradation of extrinsic and intrinsic apoptotic components, including CASP8 and CASP3, thus inhibiting the apoptotic pathway.Citation48 HBV infection can promote PARK2/parkin-mediated mitochondrial autophagy (mitophagy) to eliminate damaged mitochondria and attenuate apoptosis of virus-infected cells.Citation49 In our study, inhibition of autophagy sensitized HBV-infected cells to TNFSF10-mediated killing by restoring the TNFRSF10B level without affecting CASP8 or CASP3. Taken together, the data suggest that HBx-induced autophagy contributes to the protection of virus-infected hepatocytes from TNFSF10-mediated apoptosis.
During liver inflammation, both soluble and membrane-bound TNFSF10s are enriched in liver tissues and sera of CHB patients.Citation16,17 TNFSF10 treatment rapidly downregulated the TNFRSF10B protein in HBx-expressing cells, whereas control cells were less affected (Fig. S4). This observation suggests that HBV-infected cells may acquire TNFSF10 resistance during liver inflammation, which would favor persistent infection. The deficiency of TNFRSF10B is closely related to the susceptibility to chronic inflammation and hepatocellular carcinogenesis.Citation50 It has also been reported that HBx-induced autophagy contributes to liver inflammation through NFKB-mediated production of pro-inflammatory cytokines such as IL6 (interleukin 6), IL8 (interleukin 8), and CXCL2 (C-X-C motif chemokine ligand 2).Citation42 Therefore, autophagy-mediated downregulation of a TNFSF10 death receptor by HBx may potentiate liver inflammation after infection as well as HBV persistence, leading to the progression to severe liver diseases such as liver cirrhosis and hepatocellular carcinoma.
In line with other studies, we suggest that HBx-induced autophagy plays a critical role in viral replication, survival of infected cells, and establishing persistent infection during liver inflammation.
Materials and methods
Antibodies, reagents, and plasmids
Anti-TNFRSF10B/DR5 antibodies for immunoblot analysis and immunocytochemistry were obtained from Cell Signaling Technology (8074) and Novus Biologicals (NB100-56618), respectively. Phycoerythrin-conjugated antibodies (anti-human TNFRSF10B/DR5 and isotype control) were purchased from R&D Systems (FAB6311P and IC002P, respectively). Antibodies against GAPDH/glyceraldehyde-3-phosphate dehydrogenase (sc-47724), SQSTM1 (sc-28359), PARP1 (sc-7150), FADD (sc-5559), BIRC3 (sc-7944), CFLAR (sc-8346), MCL1 (sc-819), and GST (sc-138) were purchased from Santa Cruz Biotechnology. Anti-CASP3 (9662) and anti-CASP8 (9746) antibodies were obtained from Cell Signaling Technology. Antibodies against HBx (BioVendor, RD981038100), HA (Sigma-Aldrich, H6908), Flag M2 (Sigma-Aldrich, F1804), LC3B (Abcam, ab51520), and BECN1 (Atlas Antibodies, HPA028949) were also used. Alexa Fluor 488 anti-rabbit IgG (A21441), Alexa Fluor 350 anti-rabbit IgG (A10039), and Alexa Fluor 546 anti-mouse IgG (A11030) for immunocytochemistry were obtained from ThermoFisher Scientific. Anti-mouse (SAB3701153) and anti-rabbit antibodies (A9169) conjugated with horseradish peroxidase were purchased from Sigma-Aldrich.
Propidium iodide/RNase staining solution (4087) was purchased from Cell Signaling Technology. The proteasome inhibitor MG132 (474790) was obtained from Calbiochem. ALLN (1834–5) and carfilzomib (2385–5) were obtained from BioVision. Lysosome inhibitor chloroquine (CQ) (tlrl-chq) and autolysosome inhibitor bafilomycin A1 (tlrl-baf1) were obtained from InvivoGen. The autophagy inhibitor 3-MA (sc-205596) was purchased from Santa Cruz Biotechnology. Earle's balanced salt solution (EBSS; LB002-01) was obtained from Welgene. Human recombinant TNFSF10 (GWB-63F4CF) was purchased from GenWay biotech. All stock solutions were prepared according to the manufacturers' instructions. The concentrations of inhibitors were 25 μM MG132, 20 μM CQ, 100 nM BAF, and 5 mM 3-MA.
To generate a HBx stable cell line, the HBV enhancer and the HBx gene were inserted instead of the CMV promoter into the pcDNA3.1 vector (Thermo Fisher Scientific, V79020). The replication-competent HBV construct, HBV1.2mer (strain ayw), was kindly provided by Dr. W.S. Ryu (Yonsei University) and was described previously.Citation1 The HBx-HA and HBx-Flag plasmids, which carry inserts encoding HBx-HA and HBx-Flag, respectively, were cloned into the pcDNA3.1 vector as described previously.Citation2 mRFP-GFP tfLC3 was kindly provided by Dr. H. J. Lee (Konkuk University). GST control (pGEX-4T-1) and GST-HBx (pGEX-HBx-His) plasmids for E. coli expression were kindly provided by Dr. M. O. Lee (Seoul National University, Republic of Korea).
Cell lines, transient transfection, and generation of stable cell lines
HepG2 cells were obtained from the American Type Culture Collection (HB-8065). L02 cells (an immortalized normal liver cell line) were kindly provided by Dr. K. H. Lee (Korea Institute of Radiological and Medical Sciences). All cells were cultured in DMEM (Welgene, LM001-05) supplemented with 10% fetal bovine serum and 100 U/mL of penicillin and streptomycin at 37°C in a 5% CO2 incubator. Transient transfection was performed using Lipofectamine 2000 reagent (ThermoFisher Scientific, 11668–019) according to the manufacturer's instructions. Stable cell lines expressing HBV enhancer-driven HBx (HepG-X) or control vector (HepG-M) were generated by stable transfection with HBV enhancer-driven HBx in pcDNA3.1 and empty pcDNA3.1 plasmid, respectively. L02-based-stable cell lines were generated by stable transfection with empty pcDNA3.1 (L02-M) or pcDNA3.1-HBx-HA plasmid (L02-X) to confirm HBx-mediated degradation of TNFRSF10B, autophagy activation, and lysosome-dependent degradation of TNFRSF10B.
Analysis of the expression of TNFSF10 receptor and HBx
To detect the expression levels of TNFRSF10B mRNA and protein, semiquantitative RT-PCR and immunoblot analysis were performed, respectively, as described previously.Citation51 Primer sequences were as follows: TNFRSF10B sense, 5′-CAG AGG GAT TGT GTC CAC CT-3′; TNFRSF10B antisense, 5′-TAC GGC TGC AAC TGT GAC TC-3′; HBx sense, 5′-AAA AAG TTG CAT GGT GCT GGT GAA C-3′; HBx antisense, 5′-GCG CGG GAC GTA CTT TGT-3′; GAPDH sense, 5′-CGT CTT CAC CAT GGA GA-3′; GAPDH antisense, 5′-CGG CCA TCA CGC CAC AGT TT-3′. Immunoblot analysis was performed as described previously.Citation51 Briefly, cells were lysed with SDS lysis buffer (100 mM Tris-HCl, pH 6.8, 10% glycerol [Sigma-Aldrich, G5516], and 1% SDS [Sigma-Aldrich, L3771]); immunoblotting with anti-TNFRSF10B, anti-HBx, and anti-GAPDH antibodies was performed as recommended by the suppliers. Signal intensity was determined by densitometry using the Multi Gauge software (Fujifilm, Tokyo, Japan). The TNFRSF10B signal intensity was normalized to that of GAPDH, and the control value was set to 100%. Immunoprecipitation and immunoblotting were performed with anti-HBx antibody as described previously.Citation52
The expression level of TNFSF10 receptors on the cell surface was determined by flow cytometry as described previously.Citation53 Briefly, cells were detached with diluted trypsin, washed with PBS (ThermoFisher Scientific, 21300025), and resuspended in PBS containing 2% fetal bovine serum. Cells were incubated with phycoerythrin-conjugated TNFRSF10B antibodies for 30 min on ice. Stained cells were analyzed with a FACScalibur flow cytometer (BD Biosciences, Seoul, Republic of Korea) and Flowing Software (University of Turku, Finland). Receptor expression on the cell surface is shown as the percentage of mean fluorescence intensity of control cells.
Autophagy analysis
To monitor the autophagy level, LC3B puncta in cells transfected with mRFP-GFP tfLC3B were examined by immunofluorescence microscopy as described previously.Citation18 cells grown on coverslips were transfected with mRFP-GFP tandem fluorescent-tagged LC3B with or without the HBx-HA plasmid as described previously. At 16 h post-transfection, cells were treated with 3-MA or EBSS. Cellular localization of LC3B was observed using a Carl Zeiss Axiovert 200 fluorescence microscope and analyzed with the software supplied by the manufacturer (Carl Zeiss, Seoul, Republic of Korea). Cells containing 3 or more mRFP-LC3B puncta were defined as autophagy-positive cells. The percentage of autophagy-positive cells relative to the total number of mRFP-positive cells was calculated as described previously.Citation8 At least 100 mRFP-positive cells per sample were counted in at least 3 independent experiments. Cells stained with both RFP and GFP were defined as autophagosome positive, and cells stained with RFP only were defined as autolysosome positive. The number of fluorescent LC3B puncta was determined by counting more than 100 cells with triplicates.
For detection of endogenous LC3B-II and SQSTM1 expression levels, immunoblot analysis was performed with anti-LC3B, anti-SQSTM1, and anti-BECN1 antibodies as recommended by the suppliers. Protein levels were quantified by using the Multi Gauge software. The SQSTM1 signal was normalized to that of GAPDH, and the control value was set to 100%.
Immunocytochemistry
For detection of TNFRSF10B expression upon transient expression of HBx, cells were seeded on coverslips and transfected with the HBx-Flag plasmid. At 24 h post-transfection, cells were fixed with 3.7% paraformaldehyde (Electron Microscopy Sciences, 15710) for 15 min at room temperature. After washing with PBS, cells were probed with anti-TNFRSF10B and anti-Flag M2 antibodies at 4°C overnight. After 3 washes with PBS, the cells were incubated with Alexa Fluor 488 anti-rabbit IgG and Alexa Fluor 546 anti-mouse IgG secondary antibodies at room temperature for 40 min. Fluorescence images were obtained using a Carl Zeiss Axiovert 200 microscope and analyzed by using the supplier's software. The percentage of HBx-expressing cells showing reduced expression of TNFRSF10B relative to control cells transfected with the empty plasmid was calculated. At least 100 HBx-expressing cells per sample were counted in 3 independent experiments.
For HBx detection in autophagy analysis, cells were fixed as above, rinsed with PBS, and probed with anti-HA antibody at 4°C overnight. After 3 washes with PBS, the cells were incubated with Alexa Fluor 350 anti-rabbit IgG secondary antibody at room temperature for 40 min.
RNA interference
Small interfering RNA (siRNA) duplexes, one targeting LC3B (siLC3B, 5′-GAU AAU UAG AAG GCG CUU A-3′) and the other one representing nonspecific scrambled control siRNA (5′-AUG AAC GUG AAU UGU UCA A-3′), were synthesized by ST Pharm Co. (Seoul, Republic of Korea). Cells were transfected with siRNAs (final concentration of 100 nM) using Lipofectamine 2000 reagent. At 48 to 72 h post-transfection, cells were analyzed for target expression, autophagy, TNFRSF10B expression, and TNFSF10-mediated cell death.
Immunohistochemical analysis of liver tissues
Liver tissue array slides (LV20812) were purchased from US Biomax and used to detect TNFRSF10B and autophagy-active BECN1 by immunohistochemical analysis. The slides contained normal (16 cases/32 cores) and CHB (16 cases/32 cores) liver tissue specimens. Information on the histopathology and patients is available at the manufacturer's website (http://www.biomax.us/tissue-arrays/). The slides were baked at 60°C for 30 min, deparaffinized with xylene and dehydrated with ethanol. The slides were subjected to antigen retrieval and incubated with blocking solution to prevent nonspecific antibody binding, followed by incubation with anti-TNFRSF10B antibody or anti-BECN1 antibody overnight at 4°C. After counterstaining with hematoxylin, the sections were dehydrated and mounted. Immunohistochemistry (IHC) images were scanned with a Pannoramic MIDI automatic slide scanner (3DHistech Ltd., Budapest, Hungary) to obtain normalized signal intensity and thus minimize experimental error. For the analysis of TNFRSF10B expression levels, staining intensity of the TNFRSF10B protein was measured using the NIH-ImageJ software with the IHC Profiler plugin (http://rsb.info.nih.gov/ij/) and analyzed as described previously.Citation54 Staining intensity of TNFRSF10B is shown as the inverted median pixel value (IMPV). TNFRSF10B positivity was determined as high positive (>150 IMPV), medium positive (150–100 IMPV), low positive (100–50 IMPV), and negative (<50 IMPV) (Fig. S1). For analysis of BECN1 positivity, the levels of BECN1 macro-aggregates were assessed as described previously.Citation22 Representative areas were selected from scanned IHC images and cells were identified by hematoxylin staining of the nuclei. The percentage of cells with BECN1 macro-aggregates in the selected areas was determined. At least 5 fields (approximately total 100 cells) per section were evaluated. BECN1 positivity was scored as 0 (<20%), 1+ (20–40%), 2+ (40–70%), and 3+ (70–100%).
Immunoprecipitation and GST affinity isolation assay
Cells transiently transfected with the HBx-HA construct were lysed with immunoprecipitation lysis buffer (50 mM Tris-HCl, pH 7.2, 10 mM NaCl, 1% NP-40 [Sigma-Aldrich, NP40S], and protease inhibitor cocktails [ThermoFisher Scientific, 78441]). The lysate was precleared with protein A agarose (Sigma-Aldrich, 11134515001) at 4°C for 1 h and incubated with anti-LC3B, anti-TNFRSF10B, or anti-HA antibody at 4°C overnight, and then with protein A agarose at 4°C for 4 h. The agarose was washed 3 times with lysis buffer and boiled. Boiled samples were subjected to immunoblot analysis.
GST and GST-HBx proteins were prepared as previously described.Citation55 In brief, E. coli Rosetta BL21(DE3) (Novagen, 70954) transformed with pGEX-HBx-His or pGEX-4T-1 were induced with 0.3 mM IPTG at 16°C for 18 h, pelleted, and lysed in NETN buffer (20 mM Tris-HCl, pH 7.5, 200 mM NaCl, 1mM EDTA, 4 mM DTT, 0.1% NP-40, and protease inhibitor cocktails). The GST affinity isolation procedures were performed as described previously.Citation56 The GST, GST-HBx-His, and GST-LC3B (Enzo Life Sciences, BML-UW1155) proteins were immobilized on glutathione-sepharose 4B beads (GE Healthcare Bio-Sciences, 17-0756-01). Total lysates of L02 cells, recombinant LC3B (Enzo Life Sciences, ADI-APR-100), and full-length TNFRSF10B/DR5 (OriGene Technologies, TP319808) were incubated with immobilized GST-HBx, GST-LC3B, or GST in TEN buffer (20 mM Tris-Cl, pH 7.5, 200 mM NaCl, 1 mM EDTA, and protease inhibitor cocktails) at 4°C overnight. The beads were washed 4 times with TEN buffer, eluted in SDS-PAGE sample buffer, and analyzed by immunoblotting with antibodies against each protein.
TNFSF10-mediated cell death assay
Cell viability was determined by MTT assay (Sigma-Aldrich, M2128) according to the manufacturer's instructions. Cells were seeded and treated with TNFSF10 as indicated in the figure legends. After treatment, 50 μg/mL MTT was added into each well for 2 h. The absorbance was measured at 560 nm using a SpectraMAX Microplate Reader (Molecular Devices, Sunnyvale, CA), and the percentage of viable cells was calculated relative to untreated control cells.
Apoptotic cell population was determined by evaluating the DNA content of hypodiploid cells. Cells were fixed with cold 70% ethanol and treated with propidium iodide/RNase staining solution as described in the manufacturer's instructions. Cells were analyzed with a FACScalibur flow cytometer, and cellular DNA content and forward scatter was analyzed with WinMDI software (Scripps Research Institute, La Jolla, CA) as described previously.Citation57
For caspase activation assays, immunoblot analyses were performed with anti-CASP3, anti-CASP8, and anti-PARP1 antibodies as recommended by the suppliers.
Statistical analysis
Data shown are mean ± SD. Differences between 2 groups were analyzed by the Student t test. Multi-group comparisons were performed by one-way analysis of variance (ANOVA). P-values <0.05 were considered statistically significant.
Abbreviations
| 3-MA | = | 3-methyladenine |
| BECN1 | = | Beclin 1 |
| BAF | = | bafilomycin A1 |
| BIRC3/cIAP2 | = | baculoviral IAP repeat containing 3 |
| CFLAR/c-FLIP | = | CASP8 and FADD like apoptosis regulator |
| CHB | = | chronic hepatitis B |
| CASP3 | = | caspase 3 |
| CASP8 | = | caspase 8 |
| FADD | = | Fas associated via death domain |
| HBV | = | hepatitis B virus |
| HBx | = | hepatitis B virus X protein |
| IHC | = | Immunohistochemistry |
| MAP1LC3B/LC3B | = | microtubule-associated protein 1 light chain 3 β |
| MAPK8/JNK1 | = | mitogen-activated protein kinase 8 |
| MCL1 | = | BCL2 family apoptosis regulator |
| NFKB | = | nuclear factor kappa B |
| PARP1 | = | poly(ADP-ribose) polymerase 1 |
| PDPK1/PKB kinase | = | 3-phosphoinositide dependent protein kinase 1 |
| PtdIns3K | = | class III phosphatidylinositol 3-kinase |
| tfLC3B | = | tandem fluorescent MAP1LC3B/LC3B |
| TNFRSF10A/DR4 | = | TNF receptor superfamily member 10a |
| TNFRSF10B/DR5 | = | TNF receptor superfamily member 10b |
| TNFSF10/TRAIL | = | tumor necrosis factor superfamily member 10 |
Disclosure of potential conflicts of interest
No potential conflicts of interest were disclosed.
Supplemental Files
Download MS Word (550 KB)Funding
This study was supported by the Basic Science Research Program through the National Research Foundation of Korea (NRF) funded by the Ministry of Education, Science and Technology (NRF-2013R1A1A2010395, NRF-2015R1D1A1A01057281, and NRF-2016R1A5A2012284). This research was also supported by a grant from the Korea Health Technology R&D Project through the Korea Health Industry Development Institute (KHIDI), funded by the Ministry of Health & Welfare, Republic of Korea (HI14C-1529-020014).
Related Research Data
References
- Rautou PE, Mansouri A, Lebrec D, Durand F, Valla D, Moreau R. Autophagy in liver diseases. J Hepatol 2010; 53:1123-34; PMID:20810185; http://dx.doi.org/10.1016/j.jhep.2010.07.006
- Jackson WT. Viruses and the autophagy pathway. Virology 2015; 479–480:450-56; PMID:25858140
- Parzych KR, Klionsky DJ. An overview of autophagy: morphology, mechanism, and regulation. Antioxid Redox Signal 2014; 20:460-73; PMID:23725295; http://dx.doi.org/10.1089/ars.2013.5371
- McMahon BJ. Natural history of chronic hepatitis B. Clin Liver Dis 2010; 14:381-96; PMID:20638020; http://dx.doi.org/10.1016/j.cld.2010.05.007
- Torres HA, Davila M. Reactivation of hepatitis B virus and hepatitis C virus in patients with cancer. Nat Rev Clin Oncol 2012; 9:156-66; PMID:22271089; http://dx.doi.org/10.1038/nrclinonc.2012.1
- Feitelson MA, Bonamassa B, Arzumanyan A. The roles of hepatitis B virus-encoded X protein in virus replication and the pathogenesis of chronic liver disease. Expert Opin Ther Targets 2014; 18:293-306; PMID:24387282; http://dx.doi.org/10.1517/14728222.2014.867947
- Martin-Vilchez S, Lara-Pezzi E, Trapero-Marugán M, Moreno-Otero R, Sanz-Cameno P. The molecular and pathophysiological implications of hepatitis B X antigen in chronic hepatitis B virus infection. Rev Med Virol 2011; 21:315-29; PMID:21755567
- Tang H, Da L, Mao Y, Li Y, Li D, Xu Z, Li F, Wang Y, Tiollais P, Li T, et al. Hepatitis B virus X protein sensitizes cells to starvation-induced autophagy via up-regulation of beclin 1 expression. Hepatology 2009; 49:60-71; PMID:19065679; http://dx.doi.org/10.1002/hep.22581
- Sir D, Tian Y, Chen WL, Ann DK, Yen TS, Ou JH. The early autophagic pathway is activated by hepatitis B virus and required for viral DNA replication. Proc Natl Acad Sci U S A 2010; 107:4383-88; PMID:20142477; http://dx.doi.org/10.1073/pnas.0911373107
- Falschlehner C, Schaefer U, Walczak H. Following TRAIL's path in the immune system. Immunology 2009; 127:145-54; PMID:19476510; http://dx.doi.org/10.1111/j.1365-2567.2009.03058.x
- Wang S, El-Deiry WS. TRAIL and apoptosis induction by TNF-family death receptors. Oncogene 2003; 22:8628-33; PMID:14634624; http://dx.doi.org/10.1038/sj.onc.1207232
- Rahman MM, McFadden G. Modulation of tumor necrosis factor by microbial pathogens. PLoS Pathog 2006; 2:e4; PMID:16518473
- Smith W, Tomasec P, Aicheler R, Loewendorf A, Nemčovičová I, Wang EC, Stanton RJ, Macauley M, Norris P, Willen L, et al. Human cytomegalovirus glycoprotein UL141 targets the TRAIL death receptors to thwart host innate antiviral defenses. Cell Host Microbe 2013; 13:324-35; PMID:23498957; http://dx.doi.org/10.1016/j.chom.2013.02.003
- Oliviero B, Varchetta S, Paudice E, Michelone G, Zaramella M, Mavilio D, De Filippi F, Bruno S, Mondelli MU. Natural killer cell functional dichotomy in chronic hepatitis B and chronic hepatitis C virus infections. Gastroenterology 2009; 137:1151-60; PMID:19470388; http://dx.doi.org/10.1053/j.gastro.2009.05.047
- Maini MK, Peppa D. NK cells: a double-edged sword in chronic hepatitis B virus infection. Front Immunol 2013; 4:1-7; PMID:23355837; http://dx.doi.org/10.3389/fimmu.2013.00057
- Han LH, Sun WS, Ma CH, Zhang LN, Liu SX, Zhang Q, Gao LF, Chen YH. Detection of soluble TRAIL in HBV infected patients and its clinical implications. World J Gastroenterol 2002; 8:1077-80; PMID:12439929; http://dx.doi.org/10.3748/wjg.v8.i6.1077
- Dunn C, Brunetto M, Reynolds G, Christophides T, Kennedy PT, Lampertico P, Das A, Lopes AR, Borrow P, Williams K, et al. Cytokines induced during chronic hepatitis B virus infection promote a pathway for NK cell-mediated liver damage. J Exp Med. 2007; 204:667-80; PMID:17353365; http://dx.doi.org/10.1084/jem.20061287
- Kimura S, Noda T, Yoshimori T. Dissection of the autophagosome maturation process by a novel reporter protein, tandem fluorescent-tagged LC3. Autophagy 2007; 3:452-60; PMID:17534139; http://dx.doi.org/10.4161/auto.4451
- Ni HM, Bockus A, Wozniak AL, Jones K, Weinman S, Yin XM, Ding WX. Dissecting the dynamic turnover of GFP-LC3 in the autolysosome. Autophagy 2011; 7:188-204; PMID:21107021; http://dx.doi.org/10.4161/auto.7.2.14181
- Jo M, Kim TH, Seol DW, Esplen JE, Dorko K, Billiar TR, Strom SC. Apoptosis induced in normal human hepatocytes by tumor necrosis factor-related apoptosis-inducing ligand. Nat Med 2000; 6:564-67; PMID:10802713; http://dx.doi.org/10.1038/75045
- Du J, Liang X, Liu Y, Qu Z, Gao L, Han L, Liu S, Cui M, Shi Y, Zhang Z, et al. Hepatitis B virus core protein inhibits TRAIL-induced apoptosis of hepatocytes by blocking DR5 expression. Cell Death Differ 2009; 16:219-29; PMID:18927587; http://dx.doi.org/10.1038/cdd.2008.144
- Nicotra G, Mercalli F, Peracchio C, Castino R, Follo C, Valente G, Isidoro C. Autophagy-active beclin-1 correlates with favourable clinical outcome in non-Hodgkin lymphomas. Mod Pathol 2010; 23:937-50; PMID:20473282; http://dx.doi.org/10.1038/modpathol.2010.80
- Valente G, Morani F, Nicotra G, Fusco N, Peracchio C, Titone R, Alabiso O, Arisio R, Katsaros D, Denedetto C, et al. Expression and clinical significance of the autophagy proteins BECLIN 1 and LC3 in ovarian cancer. Biomed Res Int 2014; 2014:462658
- Mocarski ES, Upton JW, Kaiser WJ. Viral infection and the evolution of caspase 8-regulated apoptotic and necrotic death pathways. Nat Rev Immunol 2011; 12:79-88; PMID:22193709; http://dx.doi.org/10.1038/nrm3043
- Bouchard MJ, Schneider RJ. The enigmatic X gene of hepatitis B virus. J Virol 2004; 78:12725-34; PMID:15542625; http://dx.doi.org/10.1128/JVI.78.23.12725-12734.2004
- Kim KH, Seong BL. Pro-apoptotic function of HBV X protein is mediated by interaction with c-FLIP and enhancement of death-inducing signal. EMBO J 2003; 22:2104-16; PMID:12727877; http://dx.doi.org/10.1093/emboj/cdg210
- Liang X, Liu Y, Zhang Q, Gao L, Han L, Ma C, Zhang L, Chen YH, Sun W. Hepatitis B virus sensitizes hepatocytes to TRAIL-induced apoptosis through Bax. J Immunol 2007; 178:503-10; PMID:17182590; http://dx.doi.org/10.4049/jimmunol.178.1.503
- Kong F, You H, Zhao J, Liu W, Hu L, Luo W, Hu W, Tang R, Zheng K. The enhanced expression of death receptor 5 (DR5) mediated by HBV X protein through NF-kappaB pathway is associated with cell apoptosis induced by (TNF-α related apoptosis inducing ligand) TRAIL in hepatoma cells. Virol J 2015; 12:192
- Chen JY, Chen YJ, Yen CJ, Chen WS, Huang WC. HBx sensitizes hepatocellular carcinoma cells to lapatinib by up-regulating ErbB3. Oncotarget 2016; 7:473-89; PMID:26595522
- Yun C, Um HR, Jin YH, Wang JH, Lee MO, Park S, Lee JH, Cho H. NF-kappaB activation by hepatitis B virus X (HBx) protein shifts the cellular fate toward survival. Cancer Lett 2002; 184:97-104; PMID:12104053; http://dx.doi.org/10.1016/S0304-3835(02)00187-8
- Pan J, Duan LX, Sun BS, Feitelson MA. Hepatitis B virus X protein protects against anti-Fas-mediated apoptosis in human liver cells by inducing NF-kappa B. J Gen Virol 2001; 82:171-82; PMID:11125170; http://dx.doi.org/10.1099/0022-1317-82-1-171
- Diao J, Khine AA, Sarangi F, Hsu E, Iorio C, Tibbles LA, Woodgett JR, Penninger J, Richardson CD. X protein of hepatitis B virus inhibits Fas-mediated apoptosis and is associated with up-regulation of the SAPK/JNK pathway. J Biol Chem 2001; 276:8328-40; PMID:11099494; http://dx.doi.org/10.1074/jbc.M006026200
- Shih WL, Kuo ML, Chuang SE, Cheng AL, Doong SL. Hepatitis B virus X protein activates a survival signaling by linking SRC to phosphatidylinositol 3-kinase. J Biol Chem 2003; 278:31807-13; PMID:12805382; http://dx.doi.org/10.1074/jbc.M302580200
- Rawat S, Bouchard MJ. The hepatitis B virus (HBV) HBx protein activates AKT to simultaneously regulate HBV replication and hepatocyte survival. J Virol 2015; 89:999-1012; PMID:25355887; http://dx.doi.org/10.1128/JVI.02440-14
- Song JJ, Szczepanski MJ, Kim SY, Kim JH, An JY, Kwon YT, Alcala MA, Jr, Bartlett DL, Lee YJ. c-Cbl-mediated degradation of TRAIL receptors is responsible for the development of the early phase of TRAIL resistance. Cell Signal 2010; 22:553-63; PMID:19932172; http://dx.doi.org/10.1016/j.cellsig.2009.11.012
- van de Kooij B, Verbrugge I, de Vries E, Gijsen M, Montserrat V, Maas C, Neefjes J, Borst J. Ubiquitination by the membrane-associated RING-CH-8 (MARCH-8) ligase controls steady-state cell surface expression of tumor necrosis factor-related apoptosis inducing ligand (TRAIL) receptor 1. J Biol Chem 2013; 288:6617-28; PMID:23300075; http://dx.doi.org/10.1074/jbc.M112.448209
- Hu Z, Zhang Z, Doo E, Coux O, Goldberg AL, Liang TJ. Hepatitis B virus X protein is both a substrate and a potential inhibitor of the proteasome complex. J Virol 1999; 73:7231-40; PMID:10438810
- Zhang Z, Protzer U, Hu Z, Jacob J, Liang TJ. Inhibition of cellular proteasome activities enhances hepadnavirus replication in an HBX-dependent manner. J Virol 2004; 78:4566-72; PMID:15078938; http://dx.doi.org/10.1128/JVI.78.9.4566-4572.2004
- Korolchuk VI, Menzies FM, Rubinsztein DC. Mechanisms of cross-talk between the ubiquitin-proteasome and autophagy-lysosome systems. FEBS Lett 2010; 584:1393-98; PMID:20040365; http://dx.doi.org/10.1016/j.febslet.2009.12.047
- Rogov V, Dötsch V, Johansen T, Kirkin V. Interactions between autophagy receptors and ubiquitin-like proteins form the molecular basis for selective autophagy. Mol Cell 2014; 53:167-78; PMID:24462201; http://dx.doi.org/10.1016/j.molcel.2013.12.014
- Birgisdottir ÅB, Lamark T, Johansen T. The LIR motif - crucial for selective autophagy. J Cell Sci 2013; 126:3237-47; PMID:23908376
- Luo MX, Wong SH, Chan MT, Yu L, Yu SS, Wu F, Xiao Z, Wang X, Zhang L, Cheng AS, et al. Autophagy Mediates HBx-Induced Nuclear Factor-κB Activation and Release of IL-6, IL-8, and CXCL2 in Hepatocytes. J Cell Physiol 2015; 230:2382-89; PMID:25708728; http://dx.doi.org/10.1002/jcp.24967
- Liu B, Fang M, Hu Y, Huang B, Li N, Chang C, Huang R, Xu X, Yang Z, Chen Z, Liu W. Hepatitis B virus X protein inhibits autophagic degradation by impairing lysosomal maturation. Autophagy 2014; 10:416-30; PMID:24401568; http://dx.doi.org/10.4161/auto.27286
- Di X, Zhang G, Zhang Y, Takeda K, Rivera Rosado LA, Zhang B. Accumulation of autophagosomes in breast cancer cells induces TRAIL resistance through downregulation of surface expression of death receptors 4 and 5. Oncotarget 2013; 4:1349-64; PMID:23988408; http://dx.doi.org/10.18632/oncotarget.1174
- Kihara A, Kabeya Y, Ohsumi Y, Yoshimori T. Beclin-phosphatidylinositol 3-kinase complex functions at the trans-Golgi network. EMBO Rep 2001; 2:330-35; PMID:11306555; http://dx.doi.org/10.1093/embo-reports/kve061
- Eisenberg-Lerner A, Bialik S, Simon HU, Kimchi A. Life and death partners:apoptosis, autophagy and the cross-talk between them. Cell Death Differ 2009; 16:966-75; PMID:19325568; http://dx.doi.org/10.1038/cdd.2009.33
- Amir M, Zhao E, Fontana L, Rosenberg H, Tanaka K, Gao G, Czaja MJ. Inhibition of hepatocyte autophagy increases tumor necrosis factor-dependent liver injury by promoting caspase-8 activation. Cell Death Differ 2013; 20:878-87; PMID:23519075; http://dx.doi.org/10.1038/cdd.2013.21
- Kovacs JR, Li C, Yang Q, Li G, Garcia IG, Ju S, Roodman DG, Windle JJ, Zhang X, Lu B. Autophagy promotes T-cell survival through degradation of proteins of the cell death machinery. Cell Death Differ 2012; 19:144-52; PMID:21660048; http://dx.doi.org/10.1038/cdd.2011.78
- Kim SJ, Khan M, Quan J, Till A, Subramani S, Siddiqui A. Hepatitis B virus disrupts mitochondrial dynamics: induces fission and mitophagy to attenuate apoptosis. PLoS Pathog 2013; 9:e1003722; PMID:24339771; http://dx.doi.org/10.1371/journal.ppat.1003722
- Finnberg N, Klein-Szanto AJ, El-Deiry WS. TRAIL-R deficiency in mice promotes susceptibility to chronic inflammation and tumorigenesis. J Clin Invest 2008; 118:111-23; PMID:18079962; http://dx.doi.org/10.1172/JCI29900
- Shin GC, Ahn SH, Choi HS, Kim J, Park ES, Kim DH, Kim KH. Hepatocystin contributes to interferon-mediated antiviral response to hepatitis B virus by regulating hepatocyte nuclear factor 4α. Biochim Biophys Acta 2014; 1842:1648-57; PMID:24769044; http://dx.doi.org/10.1016/j.bbadis.2014.04.016
- Shin GC, Ahn SH, Choi HS, Lim KH, Choi DY, et al. Hepatocystin/80K-H inhibits replication of hepatitis B virus through interaction with HBx protein in hepatoma cell. Biochim Biophys Acta 2013; 1832:1569-81; PMID:23644164; http://dx.doi.org/10.1016/j.bbadis.2013.04.026
- Zhang Y, Zhang B. TRAIL resistance of breast cancer cells is associated with constitutive endocytosis of death receptors 4 and 5. Mol Cancer Res 2008; 6:1861-71; PMID:19074831; http://dx.doi.org/10.1158/1541-7786.MCR-08-0313
- Varghese F, Bukhari AB, Malhotra R, De A. IHC Profiler: an open source plugin for the quantitative evaluation and automated scoring of immunohistochemistry images of human tissue samples. PloS One 2014; 9:e96801; PMID:24802416; http://dx.doi.org/10.1371/journal.pone.0096801
- Na TY, Ka NL, Rhee H, Kyeong D, Kim MH, et al. Interaction of hepatitis B virus X protein with PARP1 results in inhibition of DNA repair in hepatocellular carcinoma. Oncogene 2016; PMID:27041572; http://dx.doi.org/10.1038/onc.2016.82
- Margret BE. Detection of protein-protein interactions using the GST fusion protein pull-down technique. Nature Methods 2004; 1:275-76; http://dx.doi.org/10.1038/nmeth1204-275
- Riccardi C, Nicoletti I. Analysis of apoptosis by propidium iodide staining and flow cytometry. Nat Protoc 2006; 1:1458-61; PMID:17406435; http://dx.doi.org/10.1038/nprot.2006.238