
ABSTRACT
Recently, macroautophagy/autophagy has emerged as a promising target in various types of solid tumor treatment. However, the impact of autophagy on acute myeloid leukemia (AML) maintenance and the validity of autophagy as a viable target in AML therapy remain unclear. Here we show that Kmt2a/Mll-Mllt3/Af9 AML (MA9-AML) cells have high autophagy flux compared with normal bone marrow cells, but autophagy-specific targeting, either through Rb1cc1-disruption to abolish autophagy initiation, or via Atg5-disruption to prevent phagophore (the autophagosome precursor) membrane elongation, does not affect the growth or survival of MA9-AML cells, either in vitro or in vivo. Mechanistically, neither Atg5 nor Rb1cc1 disruption impairs endolysosome formation or survival signaling pathways. The autophagy inhibitor chloroquine shows autophagy-independent anti-leukemic effects in vitro but has no efficacy in vivo likely due to limited achievable drug efficacy in blood. Further, vesicular exocytosis appears to mediate chloroquine resistance in AML cells, and exocytotic inhibition significantly enhances the anti-leukemic effect of chloroquine. Thus, chloroquine can induce leukemia cell death in vitro in an autophagy-independent manner but with inadequate efficacy in vivo, and vesicular exocytosis is a possible mechanism of chloroquine resistance in MA9-AML. This study also reveals that autophagy-specific targeting is unlikely to benefit MA9-AML therapy.
Introduction
Macroautophagy/autophagy, is a self-recycling process that maintains cellular homeostasis by degrading and recycling damaged intracellular organelles and protein aggregates. The canonical autophagy process is well characterized and is orchestrated by a series of highly conserved protein complexes. Autophagy begins with the protein complex RB1CC1-ULK1/2-ATG13-ATG101 relocating to the phagophore assembly site (PAS).Citation1-Citation3 This is followed by elongation of the phagophore membrane, which requires 2 ubiquitin-like conjugation processes to form the ATG12–ATG5-ATG16L1 protein complex and LC3-II, the mammalian homolog of yeast Atg8.Citation4,Citation5 A recently identified alternative autophagy process begins with the same RB1CC1-ULK1/2-ATG13-ATG101 and BECN1-PIK3C3 protein complexes.Citation6 However, the elongation phase of the alternative pathway requires RAB9 instead of the 2 ubiquitin-like processes needed in the canonical pathway.Citation6 Both the canonical and the alternative pathways terminate with the autophagosome merging with a lysosome to degrade the contents with lysosomal enzymes. Accordingly, ATG5 is necessary only for the canonical autophagy pathway, while RB1CC1 is required for both the canonical and alternative autophagy pathways.
Cancer cells exhibit high autophagy flux to support their rapid proliferation and turnover rates. Recent studies suggest that the autophagy pathway is a promising therapeutic target for the treatment of several solid tumors such as breast cancer, melanoma and ovarian cancer. In experimental studies, combining an autophagy inhibitor with chemotherapy augments therapeutic benefits and helps overcomes drug resistance.Citation7-Citation9 Clinical trials using the late stage autophagy inhibitor chloroquine or its derivative hydroxychloroquine are underway. Published results show patients have safely gone through the combinatory treatment of chloroquine-hydroxychloroquine with standard chemotherapies and exhibit prolonged survival in certain types of cancer.Citation10-Citation14
Although autophagy inhibition appears beneficial in the treatment of solid tumors,Citation15 evidence supporting a role for autophagy-manipulation for acute myeloid leukemia (AML) treatment is preliminary and controversial, as the reported evidence is mostly based on in vitro effects of nonspecific autophagy inducers or inhibitors and cell lines.Citation16-Citation18 One recent report showed decreased autophagy genes expression may contribute to AML proliferation,Citation19 while another found higher autophagy flux is associated with shorter disease remission in AML patients and a possible involvement in chemoresistance.Citation20 In the blood system, autophagy is necessary for normal hematopoiesis,Citation21-Citation25 which is a process of continuous self-renewal and active proliferation. We hypothesize that AML cells might also be dependent on autophagy, given their higher proliferation and turnover rates.
In this study, we have analyzed the role of autophagy genetically in Kmt2a/Mll-Mllt3/Af9 AML (MA9-AML), an aggressive and chemotherapy-resistant subtype of AML induced by Kmt2a fusion genes.Citation26 Additionally, we have sought to determine the potential value of autophagy inhibition as a therapeutic strategy in MA9-AML treatment. We observed highly elevated levels of autophagy in MA9-AML cells compared with nonleukemic mouse bone marrow cells. However, autophagy inhibition, through specific gene disruptions in both the canonical and alternative autophagy pathways, did not affect the propagation of MA9-AML cells, either in vitro or in vivo. Further, the autophagy inhibitor chloroquine showed autophagy-independent anti-leukemic effects in both wild-type and autophagy gene disrupted MA9-AML cells. However, chloroquine therapy showed no significant therapeutic benefit in vivo likely due to the inability to reach effective drug concentrations. We also found that leukemia cells treated with chloroquine underwent prominent exocytosis to expel undigested endolysosome cargos extracellularly. With the inhibition of exocytotic processes, the anti-leukemic effect of chloroquine was significantly increased. Our study reveals that autophagy is dispensable for MA9-AML cell growth and survival, both in vitro and in vivo. Additionally, the autophagy inhibitor chloroquine works in an autophagy-independent manner, and exocytosis may be a mechanism for chloroquine resistance in AML cells. These findings will have a significant impact on autophagy- and chloroquine-related leukemia therapy and drug discovery.
Results
MA9-AML cells have high autophagy activity
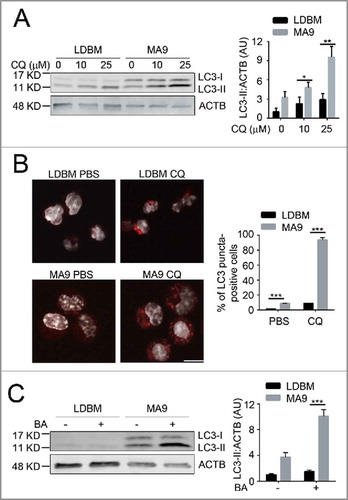
To determine whether autophagy is a potential targetable pathway in MA9-AML, we examined autophagy levels in both the retroviral and knock-in MA9 AML models. Compared with wild-type low-density bone marrow cells (LDBM) with enriched hematopoietic progenitors, retroviral-transduced leukemia cells had a significantly higher autophagy activity as shown by increased LC3-II accumulation () and increased LC3 puncta formation upon chloroquine treatment (). A higher autophagy flux was also seen after addition of bafilomycin A1, another late stage autophagy inhibitor (). Similarly, a higher autophagy flux was also observed in MA9 knock-in leukemia cells compared with their littermate controls (Fig. S1). These data show that MA9-AML cells have a higher basal autophagy activity than wild-type cells.
Figure 1. MA9-induced leukemia cells exhibit a high autophagy flux. (A) MA9-transformed leukemia cells and empty vector-transduced normal low-density bone marrow cells were treated with chloroquine at the indicated dosages for 6 h followed by western blotting. LDBM, low-density bone marrow cells; CQ, chloroquine; MA9; MA9 retrovirally-transduced leukemia cells. Quantification is LC3-II:ACTB ratio (n = 4 mice). (B) Leukemia cells and LDBM cells described in (A) were treated with CQ for 6 h at 25 μM before immunostaining for LC3. Scale bar: 10 μm. Quantification is percentage of LC3 puncta positive cells. Cells with more than 1 punctum are considered positive for quantification. (n = 3 mice). (C) Leukemia cells and LDBM cells described in (A) were treated with bafilomycin A1 (BA) for 4 h at 20 nM followed by western blot analysis. Quantification is the LC3-II:ACTB ratio (n = 3 mice). Results are shown as mean ± SD, * P < 0.05, ** P < 0.01, *** P < 0.001.
Atg5 is dispensable for MA9-AML maintenance both in vitro and in vivo
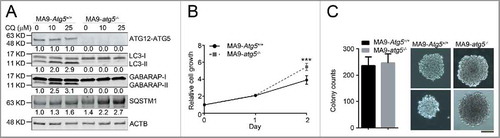
Because Atg5 is essential for proper autophagosome formation and/or maturation,Citation27 we investigated the effect of autophagy inhibition in MA9-AML cells through an Atg5 gene-targeting strategy. We first retrovirally transduced MA9 into Atg5flox/flox lineage negative (Lin−) bone marrow cells. We then introduced a puromycin-resistant retrovirus expressing tamoxifen-inducible CreER (Puro-CreER) into MA9-AML cells. Treatment with 4-hydroxytamoxifen (4-OHT) and colony selection led to clean Atg5 gene deletion as demonstrated by the absence of ATG5 protein expression in MA9-AML cells (). In agreement with previous reports,Citation28 cells without Atg5 lacked LC3-II and GABARAP-II (another Atg8 family member) generation, and also exhibited increased SQSTM1/p62 accumulation, which is a receptor and substrate protein in autophagy, upon treatment with chloroquine (). LC3 puncta were also absent in Atg5-deleted cells (Fig. S2A). Surprisingly, we did not observe any growth inhibition () or pro-apoptotic effects (Fig. S2B) after Atg5 deletion in MA9-AML cells. A colony forming assay showed a similar number of colonies in Atg5 wild-type and Atg5-deleted conditions, with a larger average colony size in the Atg5-deleted group (). Although autophagy inhibition can cause elevated reactive oxygen species (ROS) levels and mitochondria accumulation,Citation29 we did not observe any significant changes; nor did the expression of the mitochondria protein COX4/COX IV change after Atg5 deletion (Fig. S2C-E). In addition, Atg5 wild-type and knockout cells showed a similar response to starvation (Fig. S2F), further indicating that autophagy is not required for leukemia cell survival.
Figure 2. Atg5 is dispensable for MA9-AML cell growth and survival in vitro. (A) Clean Atg5-deleted MA9 cells were prepared through 4-OHT treatment and colony selection. MA9-Atg5+/+ and MA9-atg5−/− leukemia cells were treated with chloroquine at the indicated dosages for 6 h followed by western blot analysis. Numbers represent the densitometry quantification of protein levels normalized to ACTB (n = 4 repeats). MA9-Atg5+/+, Atg5 wild-type MA9 leukemia cells; MA9-atg5−/−, Atg5-deficient MA9 leukemia cells. (B) Basal cell growth rates of MA9-Atg5+/+ and MA9-atg5−/− cells were analyzed by MTS assay at the indicated time points. OD: 490 nM (n = 6 repeats). Results are mean ± SD, * P < 0.05. (C) Five hundred MA9-Atg5+/+ or MA9-atg5−/− leukemia cells were plated in M3434 medium for 5 d followed by colony counting (n = 3 repeats). Images show representative colonies. Images were taken by light microscopy (Olympus, CKX41) under the 10X objective. Scale bar: 100 μm.
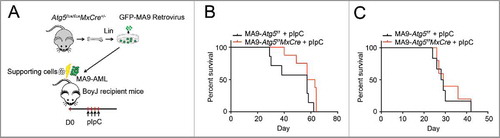
Next, we examined whether Atg5 deletion had any growth and/or survival impact on MA9-AML in vivo . We transformed Atg5flox/floxMxCre+ Lin− cells with a retrovirus expressing MA9-GFP, using Atg5flox/flox littermates as controls. After 2 rounds of colony selection, GFP+ MA9-AML cells together with supporting cells, were transplanted into lethally irradiated BoyJ recipient mice (). Two wk post-transplantation, recipient mice were treated with polyinosinic:polycytidylic acid (polyI:C) to induce Atg5 deletion (Fig. S3A). Upon Atg5 deletion, the peripheral white blood cell count dropped significantly (Fig. S3B). However, there were no changes in either hemoglobin or platelet levels (Fig. S3C,D). Leukemia burden in the bone marrow was unchanged (Fig. S3E) and Atg5 deletion did not prolong the survival of MA9-AML mice in either primary or secondary transplantation assays (). These data strongly suggest that the Atg5-dependent autophagy pathway is dispensable for the pathogenesis of MA9-AML cells both in vitro and in vivo.
Figure 3. Atg5 disruption does not benefit MA9-AML mice survival. (A) Illustration of transplantation strategy: 1 million leukemia cells together with 0.25 million supporting cells were transplanted into BoyJ recipient mice after lethal irradiation. Intraperitoneal injection of polyI:C (plpC) was started 20 d post transplantation at the dosage of 100 μg/g, every other day for 4 injections. (B) Kaplan-Meier survival curve for the primary transplantation (n = 7 in Atg5f/f group, n = 8 in Atg5f/fMxCre group). (C) Kaplan-Meier survival curve for the secondary transplantation (n = 6 in Atg5f/f group, n = 5 in Atg5f/fMxCre group).
To investigate whether the lack of a dependence on Atg5 is specific to MA9 leukemia, we examined the effect of Atg5 deletion on cells expressing Runx1/Aml1-Runx1t1/Eto (AE), another oncogene commonly found in AML.Citation30 Using a similar retroviral transduction strategy, we introduced a retrovirus expressing AE labeled with THY1/Thy1.1 followed by Puro-CreER into Atg5flox/flox Lin− cells to generate AE-Atg5flox/flox CreER cells (Fig. S4A). We observed no change in colony-forming ability compared with wild-type AE-AML cells (Fig. S4B), after induction of Atg5 deletion (Fig. S4C). These data indicate that the Atg5-dependent autophagy pathway is also likely dispensable for AE-AML.
Rb1cc1 is not essential for MA9-AML cell maintenance
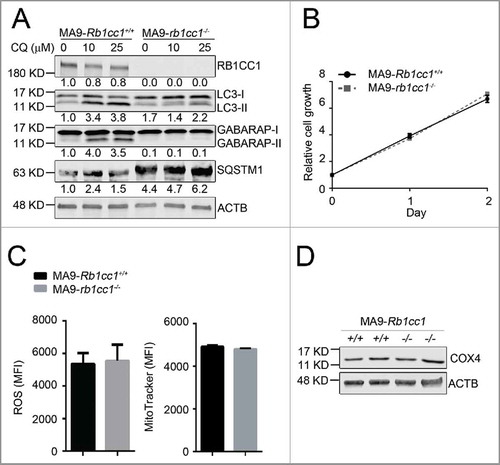
To determine whether the resistance of MA9-AML cells to Atg5 deletion is due to compensatory effects from an alternative autophagy pathway, we performed a similar set of experiments in a Rb1cc1-deleted background. We introduced MA9-GFP and Puro-CreER retroviruses into Rb1cc1flox/flox Lin− bone marrow cells followed by 4-OHT treatment to induce deletion in vitro. Through colony selection, clean deletion of Rb1cc1 was confirmed by western blot analysis (). Unlike Atg5 deletion, we still observed LC3-II accumulation by western blot and LC3 puncta formation in Rb1cc1-deleted cells, albeit at a much lower level when compared with wild-type MA9-AML cells (, Fig. S5A). There was also a high level of SQSTM1 accumulation (), indicating suppression of autophagy activity after Rb1cc1 deletion. However, when we examined the growth and survival impact of Rb1cc1 deletion in MA9-AML cells, we did not observe any changes in cell proliferation (), apoptosis (Fig. S5B), colony-forming ability (Fig. S5C), or survival under starvation conditions (Fig. S5D). In addition, Rb1cc1-deleted MA9-AML cells did not show changes in ROS or mitochondria levels, nor in the mitochondria protein COX4 expression (). Collectively, these data show that although Rb1cc1 deletion causes signaling changes in the autophagy pathway, the normal growth and survival of MA9-AML cells is not impaired, indicating that both the canonical and alternative autophagy pathways are dispensable for MA9-AML maintenance.
Figure 4. Rb1cc1 deficiency does not affect the maintenance of MA9-AML cells. (A) Clean Rb1cc1-deleted cells were prepared through 4-OHT treatment and colony selection. MA9-Rb1cc1+/+ and MA9-rb1cc1−/− leukemia cells were treated with chloroquine at the indicated dosages for 6 h before western blot analysis. Numbers represent the densitometry quantification of protein levels normalized to ACTB (n = 3 repeats). MA9-Rb1cc1+/+, Rb1cc1 wild-type MA9 leukemia cells; MA9-rb1cc1−/−, Rb1cc1-deficient MA9 leukemia cells. (B) Basal cell growth rates of MA9-Rb1cc1+/+ and MA9-rb1cc1−/− cells were analyzed by MTS assay at the indicated time points (n = 4 repeats). (C) MA9-Rb1cc1+/+ and MA9-rb1cc1−/− leukemia cells stained with CellROX Deep Red reagent or MitoTracker Red were analyzed by flow cytometry for ROS or mitochondria levels at basal state, respectively (n = 4 repeats). MFI, mean fluorescence intensity. (D) MA9-Rb1cc1+/+ and MA9-rb1cc1−/− cells under basal state were harvested and used for western blot analysis of the mitochondria protein COX4.
Endolysosome formation remains intact in Atg5- or Rb1cc1-deleted MA9-AML cells
To investigate why early stage autophagy inhibition does not impair MA9-AML maintenance, we tracked the change of late stage autophagy in either Atg5- or Rb1cc1-deleted MA9 cells with or without chloroquine treatment using transmission electron microscopy (TEM). At basal state, neither Atg5- nor Rb1cc1-deleted cells showed any ultrastructural abnormalities compared with wild-type MA9-AML cells. (). Upon chloroquine treatment, we observed a large number of morphologically typical endolysosomes in both Atg5- and Rb1cc1-deleted cells similar to wild-type (, Table S1). When staining the cells with the lysosomal marker LAMP1, we observed large LAMP1-positive puncta formation, matching the size of vesicles observed under TEM, upon chloroquine treatment in Atg5- or Rb1cc1-deleted leukemia cells, similar to the observation in wild type (Fig. S6).
Figure 5. Atg5 or Rb1cc1 deficiency does not affect the lysosomal degradation pathway. (A) MA9 wild-type, MA9-atg5−/− and MA9-rb1cc1−/− leukemia cells were treated with chloroquine at 25 μM for 6 h followed by TEM imaging. Scale bar: 500 nm. (B) MA9 wild-type, MA9-atg5−/− and MA9-rb1cc1−/− leukemia cells cultured under basal condition were harvested and used for western blot analysis (n = 2 repeats).
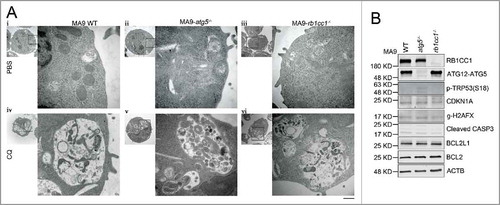
Since autophagy blockade can induce TRP53 phosphorylation and apoptotic response in cancer cells,Citation31 we examined signaling changes in TRP53 and apoptotic pathways in both Atg5- and Rb1cc1-deleted MA9-AML cells. We did not observe any change in phospho-TRP53, its downstream effector CDKN1A/p21, or the DNA damage-related protein γ-H2AFX by western blot (). Neither did we observe any changes in the apoptosis-related proteins BCL2L1, BCL2, or cleaved CASP3 (). These data show that although autophagy inhibition is achieved by specific gene targeting at the early stages of autophagy, MA9-AML cells can still form intact endolysosomes, suggesting a normally functioning lysosomal degradation system that maintains cellular homeostasis.
Neither Atg5 nor Rb1cc1 disruption increases the susceptibility of MA9-AML cells to standard chemotherapies
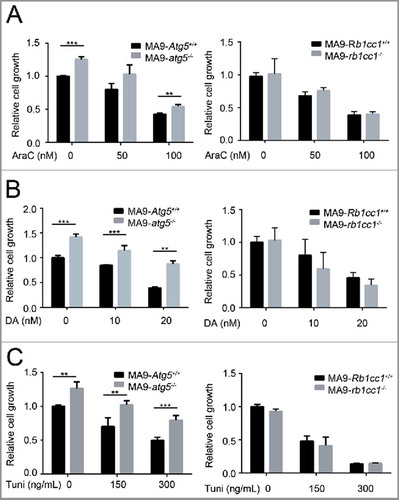
Since autophagy blockade showed a combinatory activity with chemotherapy in solid tumor treatment, we investigated whether an autophagy-specific gene disruption would increase the susceptibility of MA9-AML cells to standard chemotherapy. Interestingly, ATG5-deficient MA9-AML cells showed a slight resistance to chemotherapy drugs, including cytarabine (AraC) and doxorubicin (DA) (, Fig. S7A,B). Such resistance was not seen in the RB1CC1-deficient cells, which had a similar response to wild-type after treatment with either AraC or DA (, Fig. S7A,B). We also tested the effect of ER stressing (upstream of the autophagy pathway) with the ER stressor tunicamycin, on Atg5- or Rb1cc1-deleted cells and found that leukemia cells with an Atg5 deletion were more resistant to tunicamycin treatment, while loss of Rb1cc1 had no effect relative to wild-type cells (, Fig. S7C). Collectively, these data suggest that autophagy inhibition through either Atg5 or Rb1cc1 gene disruption does not increase the sensitivity of MA9-AML cells to chemotherapy.
Figure 6. Loss of Atg5 or Rb1cc1 does not sensitize MA9-AML cells to chemotherapy. MA9-Atg5+/+ and MA9-atg5−/− , or MA9-Rb1cc1+/+ and MA9-rb1cc1−/− leukemia cells were treated with chemotherapy drugs or an ER stressor at the indicated dosages for 48 h followed by MTS assay. AraC, cytarabine; DA, doxorubicin; Tuni, tunicamycin. Results are mean ± SD, ** P < 0.01, *** P < 0.001 (n = 3 to 6 repeats).
Chloroquine shows an autophagy-independent anti-leukemic effect that can be enhanced by exocytosis inhibition
Currently, the antimalarial drug chloroquine is being widely tested in both research and clinical settings for cancer treatment with the antitumor mechanism thought to work through autophagy inhibition. However, recent reports have shown that chloroquine also has autophagy-independent roles that suppress tumor growth and invasion.Citation32,Citation33 To investigate the effect and potential mechanism of chloroquine in leukemia, we tested the sensitivity of MA9-AML cells to chloroquine treatment in comparison with wild-type Lin− bone marrow cells. We found that both MA9 knock-in and retroviral-transduced leukemia cells were more sensitive to chloroquine treatment as demonstrated by suppressed growth rates (). Colony-forming assays showed that chloroquine at a high (25 μM) concentration can sufficiently suppress the colony-forming ability of MA9 leukemia cells, but not at a low (10 μM) concentration (Fig. S8A). Loss of either Atg5 or Rb1cc1 did not improve the sensitivity of MA9-AML cells to chloroquine treatment ( and Fig. S8B). These data collectively suggest that chloroquine has an anti-leukemic effect that is independent of Atg5- or Rb1cc1-regulated autophagy.
Figure 7. Chloroquine shows an autophagy-independent anti-leukemic effect in vitro, but is not potent in vivo. (A) MA9 knock-in leukemia cells (MA9-KI), MA9-Retro and wild-type Lin− bone marrow cells were treated with chloroquine at the indicated dosages for 48 h followed by MTS assay (n = 3 repeats). (B) MA9-Atg5+/+ and MA9-atg5−/− leukemia cells were treated with chloroquine at the indicated dosages for 48 h before MTS assay (n = 4 repeats). Results are mean ± SD, ** P < 0.01, *** P < 0.001. (C) Kaplan-Meier survival curve of chloroquine and AraC combinatory treatment in MA9-AML leukemia mice. AraC was injected intraperitoneally at 100 mg/kg once a day for 5 d. Chloroquine was injected at 50 mg/kg twice a day for 5 d (n = 6 in each group). The transplantation method is as described in . (D) For ex vivo assay, chloroquine was injected as described in (C). Bone marrow Lin− cells were harvested within 2 h after the last injection followed by western blot analysis. For in vitro assay, bone marrow Lin− cells were treated with chloroquine at 10 μΜ for 6 h followed by western blot analysis. Quantification is the LC3-II:ACTB ratio (n = 3 mice). Results are mean ± SD, * P < 0.05. AU, arbitrary units.
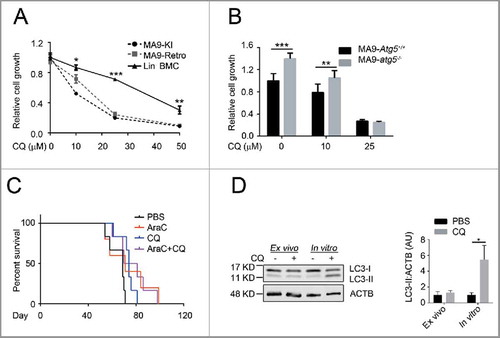
To validate the therapeutic benefit of chloroquine in vivo, we treated MA9-AML transplanted mice with chloroquine intraperitoneally at 50 mg/kg twice a d for 5 d. We observed a significant improvement in hemoglobin levels in treated versus nontreated groups (Fig. S8C). However, no changes were seen in peripheral white blood cell counts (Fig. S8D), leukemia burden in the bone marrow (Fig. S8E), or improvement in overall survival (Fig. S8E) following chloroquine treatment. In an attempt to enhance the efficacy, we combined chloroquine treatment with chemotherapy drugs and found that whereas chloroquine showed prominent combinatory activities with chemotherapy in suppressing leukemia cell growth (Fig. S8G,H) and inducing apoptosis (Fig. S8I,J) in vitro, this combinatory benefit was not enough to prolong mouse survival (). We also tested the anti-leukemia effect of chloroquine on human patient KMT2A-SEPT6-rearranged leukemia cells and found similar results to mouse MA9-AML, including suppressed leukemia cell growth in vitro, but no change in mouse survival in vivo (Fig. S8K,L). The lack of detectable effects of chloroquine treatment in vivo may be due to its suboptimal pharmacokinetics resulting in an inability to maintain this drug at a blood concentration of approximately 10 μM.Citation34 Consistently, we could not observe an accumulation of LC3-II in chloroquine-injected mouse bone marrow cells, which can be readily detected at 10 μM in vitro (). These data suggest that adding chloroquine to AML chemotherapy can improve certain clinical features such as anemia, but the current drug formulation is not effective enough to treat AML in vivo possibly due to its limitations in pharmacokinetics and nontoxic delivery dosage.Citation34-Citation36
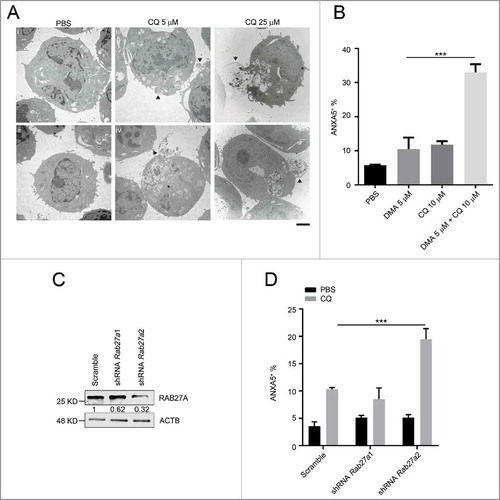
To investigate the possible chloroquine response mechanism in MA9-AML, we followed the response of leukemia cells to chloroquine treatment at different dosages and time points under TEM. We began to observe endolysosome accumulation at 5 μM concentration within a short time period (2 h) upon chloroquine treatment. Meanwhile, cells started to expel under-degraded endolysosomes through exocytosis (). Such responses happened in a time- and dosage-dependent manner with a more prominent exocytotic activity seen at a higher chloroquine concentration (25 μM) and a longer treatment period (6 h) (, Table S2). To validate exocytosis as a mediator of chloroquine resistance, we treated leukemia cells with chloroquine and the exocytosis inhibitor 5-(N,N-dimethyl) amiloride HCl (DMA).Citation37 We found that DMA treatment greatly enhanced the anti-leukemic effect of chloroquine in inducing cell death (). To further address the mechanism, we performed shRNA interference of the Rab27a gene, a well-validated gene involved in cellular exocytotic activity.Citation37,Citation38 We found that Rab27a knockdown did not significantly affect the survival of MA9 leukemia cells. However, when combined with chloroquine treatment, Rab27a knockdown significantly improved the anti-leukemic effect of chloroquine (), similar to DMA. These data suggest that when the lysosomal degradation pathway is blocked by chloroquine, MA9-AML cells may utilize exocytosis to export damaged organelles and debris to maintain cellular homeostasis.
Figure 8. The anti-leukemic activity of chloroquine is enhanced by exocytosis inhibition. (A) MA9 leukemia cells were treated with chloroquine at 5 μM for 2 h or at 25 μM for 6 h followed by TEM analysis. Scale bar: 2 μm. (B) Chloroquine and DMA combinatory treatment at the indicated dosages for 24 h followed by ANXA5 and 7-AAD staining for apoptosis analysis by flow cytometry. Results are mean ± SD, *** P < 0.001 (n = 6 repeats). (C) MA9 leukemia cells transduced with scramble or Rab27a shRNA were harvested after 48 h of puromycin selection for western blot analysis. Numbers represent the densitometry quantification of protein levels normalized to ACTB. (D) MA9 cells described in (C) were treated with chloroquine at 10 μM for 24 h followed by ANXA5 and 7-AAD staining for apoptotic analysis.
Discussion
To date, mounting evidence from both research and clinical trials has shown the success of targeting autophagy in various types of cancer. The potential benefits of this strategy are also being investigated in leukemia.Citation39,Citation40 In chronic myeloid leukemia (CML), autophagy is critical for BCR-ABL1-induced leukemogenesis, and autophagy-deficient CML cells undergo rapid cell cycle arrest and apoptosis.Citation31 In this study, we found that MA9-AML cells bear a high basal autophagy flux. However, inhibiting the canonical autophagy pathway through Atg5 deletion or suppressing both canonical and alternative pathways through Rb1cc1 deletion does not affect the growth and survival of MA9-AML cells. One recent study suggested that Atg5 homozygous deletion is lethal to Kmt2a-Mllt1/Enl leukemia,Citation19 which was opposite to what we observed in MA9-AML. The discrepancy could be because of the different subtypes of AML or the procedure of retroviral transduction in different genetic backgrounds. Another preliminary study found that Atg5 homozygous loss did not prolong the survival of Kmt2a-Mllt1 leukemia mice,Citation41 consistent with our observation in MA9-AML. In addition, we found that autophagy gene depletion does not improve the anti-leukemic effect of standard chemotherapy. A recent paper showed ATG7 suppression by shRNA in ATG7-high human AML cell lines could enhance chemotherapy sensitivity.Citation20 The different genetic backgrounds in AML subtypes, mouse vs human leukemia difference, off-target effects of shRNA methodology, and possible autophagy-independent function of ATG7 may contribute to the discrepancy with our results. Our findings suggest that targeting autophagy alone, or in combination with chemotherapy, will unlikely produce therapeutic benefits in MA9-AML. We also found that Atg5 deficiency did not affect normal survival and colony-forming ability of AE leukemic cells, suggesting the existence of autophagy-resistant AML subtypes other than MA9-AML. Therefore, individual subtypes of leukemia need to be carefully evaluated regarding the importance of autophagy and the potential targeting benefit. Recently, there have been several characterized cell lines including lung, prostate and KRAS-driven cancer lines that survive normally with either Atg5 or Atg7 deficiency in vitro.Citation42-Citation44 Here we report that autophagy is dispensable for AML cells not only in vitro, but also in vivo, further broadening our view on the role of autophagy in a specific type of blood cancer cell maintenance.
When investigating autophagy resistance mechanisms in AML, we found that leukemia cells with autophagy gene disruption were still competent in forming endolysosomes similar to wild-type leukemia cells. This observation suggests a functionally intact lysosomal degradation system to maintain homeostasis in AML cells and explains why leukemia cells are able to survive both in vitro and in vivo regardless of autophagy status. This interesting discovery indicates the existence of compensatory vesicular transport systems that carry debris to lysosomes for degradation and recycling. Further investigation into this compensatory machinery is worth pursuing, as it could provide new therapeutic targets in autophagy-resistant tumors.
Although autophagy gene disruption does not affect AML survival, the pharmacological autophagy inhibitor chloroquine shows an autophagy-independent anti-leukemic effect because it induces cell death in both wild-type and Atg5- or Rb1cc1-deleted MA9-AML cells. Recent reports have shown that adding chloroquine to chemotherapy regimens displays a promising antitumor effect in certain types of cancer.Citation13,Citation14,Citation45 However, the mechanism whereby chloroquine induces tumor cell death is unclear. Existing hypotheses include 1) neutralizing the pH in the solid tumor environment,Citation46 2) changing the pH in endosomes and reducing the sequestration of chemo-drugs in this organelle,Citation47 3) intercalating into DNA to cause DNA damage,Citation48 4) destabilizing lysosomal membrane and leading to mitochondria-related intrinsic apoptosis,Citation49 or 5) blocking the autophagy process.Citation50 Although the exact mechanism is still under investigation, the possibility exists that the antitumor mechanism could vary among different tumor types. Our data offer solid evidence that the killing of leukemia cells by chloroquine is autophagy-independent.
There are innate limitations of using chloroquine and its derivative hydroxychloroquine in cancer treatment, such as poor anticancer activity and inability to achieve effective drug concentration in vivo.Citation35,Citation36 We also encountered these limitations in both the mouse and human xenograft experiments. With our injection regimen of 50 mg/kg twice a day, the potentially achievable peak blood concentration is only between 10 and 15 μM.Citation34 Our colony assay results in Fig. S8A show that this concentration is not sufficient to suppress the colony-forming ability of MA9-AML cells in vitro. In addition, chloroquine injection did not lead to a detectable LC3-II accumulation, an observation we made in vitro at 10 μM (), providing supporting evidence that a standard chloroquine injection protocol may not reach a beneficial concentration in vivo . We think this is a possible explanation as to why we did not observe significant therapeutic benefits in vivo. One possible solution is to synthesize more potent chloroquine derivatives with less toxic effects. There is recent literature describing new derivatives under development, which are much more potent than chloroquine for tumor treatment in preclinical tests.Citation36
We find that active exocytosis upon chloroquine treatment also contributes to drug resistance in MA9-AML cells. Induction of exocytosis through inhibition of lysosomal degradation by chloroquine has previously been observed in other tissues.Citation51 Our results show that this phenomenon may also occur in leukemia cells. Chloroquine-induced vesicular exocytosis in AML cells occurs rapidly at a low drug dosage and increases in a dosage- and time-dependent manner. Addition of an exocytosis inhibitor or the knockdown of the exocytotic gene Rab27a greatly enhances the effect of chloroquine in inducing leukemia cell death. Collectively, these data suggest that exocytosis is one potential mechanism of chloroquine resistance in MA9-AML. This finding enriches our understanding of limited chloroquine efficacy in tumor treatment and offers a new drug combinatory strategy.
Materials and methods
Mice and transplantation
Atg5flox/flox, Rb1cc1flox/flox and MA9 knock-in mice have been described previously.Citation28,Citation52,Citation53 Atg5flox/floxMxCre+ mice were generated by crossing Atg5flox/flox with MxCre+ mice. In vivo disruption of the Atg5 gene was induced by intraperitoneal injection of polyI:C (GE Healthcare Life Sciences, 27–4732–01). Primers used for genotyping are listed in Table S3. All mice used were 6 to 12 wk of age unless otherwise indicated. Animal research was approved by the Institutional Animal Care and Use Committee at the Cincinnati Children's Hospital Research Foundation. BoyJ mice 5 to 8 wk of age obtained from the Comprehensive Mouse and Cancer Core at Cincinnati Children's Hospital Medical Center were used as mouse leukemia cell transplantation recipients. Recipient mice were lethally irradiated (7 Gy followed by 4.75 Gy) before intravenous injection of 1 million leukemia cells and 0.25 million supporting cells per mouse. Leukemia cells collected from the bone marrow of primary transplantation recipients were used for secondary transplantation. For primary human KMT2A-SEPT6 leukemia cell transplantation,Citation54 NRGS mice were preconditioned with a single dose of busulfan at 30 mg/kg intravenously, followed by intravenous injection of 1.25 million leukemia cells per mouse.
Cell culture
MA9 knock-in and retroviral-transduced leukemia cells were both cultured in Iscove's modified Dulbecco's medium (IMDM; HyClone Laboratories, SH30228.01) containing 10% fetal bovine serum (FBS; Atlanta biologicals, S12450), 1% penicillin-streptomycin (HyClone Laboratories, SV30010) and supplemented with 10 ng/mL murine IL-3 (Peprotech, 213–13), IL-6 (Peprotech, 213–16), GM-CSF (Peprotech, 315–03) and SCF (Peprotech, 250–03). The same medium was also used for wild-type mouse bone marrow cell culture. Primary human AML cells were cultured in IMDM containing 20% FBS, 1% penicillin-streptomycin, and supplemented with 10 ng/mL human SCF (Peprotech, 300–07), TPO (Perprotech, 300–18), FLT3L (Perprotech, 300–19), IL3/IL-3 (Peprotech, 200–03) and IL6/IL-6 (PeproTech, 200–06).
Low-density bone marrow cells
Whole bone marrow cells were flushed from the hind legs of mice. Red blood cells were lysed in BD Pharm Lyse Buffer (BD Bioscience, 555899) and washed twice with phosphate-buffered saline (PBS; HyClone Laboratories, SH30028.02). The remaining bone marrow cells were resuspended in 4 mL PBS and layered onto 4 mL of Histopaque-1083 (Sigma-Aldrich, 1083–1). Centrifugation was performed at 673 g for 30 min at room temperature. The low-density bone marrow cells were collected at the interface and were washed twice with PBS before culturing.
Retrovirus transduction
AE oncogene in a pMSCV-IRES-THY1/Thy1.1 backbone,Citation55 MA9 oncogene in a MSCV-eGFP backboneCitation56 and MSCV-CreERT2-puro (Addgene, 22776; deposited by Tyler Jacks laboratory) were used for retroviral transduction. Retrovirus production and infection were performed as described previously.Citation57 Lineage negative (Lin−) bone marrow cells used for transduction were selected using the Lineage Cell Depletion Kit (Miltenyi Biotec, 130–090–858) following the manufacturer's protocol. Diagnosis of AML was confirmed by both morphological and flow cytometry analysis.
Lentiviral short-hairpin RNA interference assay
Lentiviral constructs were purchased from Sigma-Aldrich. Mouse Rab27a1: TRCN 0000100577, Rab27a2: TRCN 0000100578. Viral supernatant was harvested from transfected HEK293T cells. Transduction of MA9 leukemia cells with viral supernatant was performed by spinoculation on retronectin (Takara Bio Inc. T100B)-coated plates. After puromycin (Gold Biotechnology, P-600–100) selection, cells were used for drug treatment. The remaining cells were used for western blot analysis to determine knockdown efficiency. We also tested Rab27b and found by both western blot and quantitative RT-PCR assays that its expression was at a very low level in MA9 leukemia cells.
Colony formation assays
Leukemia cells were cultured in 1 mL cytokine-supplemented MethoCult GF M3434 medium (STEMCELL Technologies, 03434) for 5 d before counting, unless indicated otherwise.
Starvation assays
Before starvation, MA9 leukemia cells were harvest and washed in PBS for 5 min X 3 times. Then cells were plated in the starvation media (IMDM supplemented with 1% FBS, 1% penicillin-streptomycin) at 1 million/mL for different time points followed by analyses.
Western blot assays
Cell lysis buffer for western blot contained 63 mM Tris, pH 6.8 (Research Products International,T60050), 2% SDS (Bio-Rad, 161–0302), 10% glycerol (Research Products International, G22020), 0.01% bromophenol blue (Bio-Rad, 161–0404), 10mM NaF (Sigma-Aldrich, s6521), 4mM dithiothreitol (DTT; ThermoFisher Scientific, 15508013), 0.2 mM sodium orthovanadate (Santa Cruz Biotechnology, sc-24948A),10 mM β-glycerophosphate (Calbiochem,35675), 1 mM PMSF (Santa Cruz Biotechnology, sc-24948A), 5% β-mercaptoethanol (Thermo Fisher, 60–24–2) and proteinase inhibitor cocktail (Santa Cruz Biotechnology; sc-24948A). Whole cell lysate was resolved on a 4% to 15% precast gel (Bio-Rad, 456–1086) and transferred to PVDF (EMD Millipore, IPFL00010) using the Bio-Rad Transblot Turbo® system. Blots were developed using the Odyssey infrared imager (LI-COR Biosciences).
Fluorescence and electron microscopy
For immunofluorescence microscopy, cells were seeded on retronectin-coated slides for at least 2 h. Fixation was performed in cold methanol (Fisher Scientific, A412–4) for 15 min at −20°C. Fixed cells were permeablilized with 0.2% Triton X-100 (Bio-Rad, 1610407) for 20 min and blocked in 5% goat serum (Thermo Fisher Scientific, 16210064) for 1 h. After blocking, slides were stained with primary antibodies overnight followed by a 1-h incubation with secondary antibodies. Images were taken on a Nikon C2 confocal microscope. For transmission electron microscopy (TEM), cells were fixed in fixation buffer (2% glutaraldehyde [Sigma-Aldrich, G5882], 2% paraformaldehyde [Electron Microscopy Sciences, 15710]) and sent to the Cincinnati Children's Hospital Medical Center Pathology Core for further processing. EM images were taken on a Hitachi 7650H microscope.
Flow cytometry
Cells were stained following the manufacturer's standard staining protocol. Flow cytometry analyses were performed on a FACS Canto II analyzer (BD Biosciences). Data were analyzed using BD FACSDiva software v8.0.1.
Drugs and reagents
Drugs include 4-hydroxytamoxifen (Sigma-Aldrich, H6278), bafilomycin A1 (Sigma-Aldrich, 88899–55–2), chloroquine (Sigma-Aldrich, C6628) doxorubicin (Pfizer, JF11C), cytarabine (Mylan Institutional, 7801167), and DMA (Santa Cruz Biotechnology, sc-202459). Primary antibodies include LC3A/B (Cell Signaling Technology, 4108), ATG5 (Cell Signaling Technology, 12994), SQSTM1/p62 (Cell Signaling Technology, 8025), p-TRP53 (Cell Signaling Technology, 9284), CDKN1A (Cell Signaling Technology, 2947), cleaved CASP3 (Cell Signaling Technology, 9661), BCL2L1 (Cell Signaling Technology, 2764), BCL2 (Cell Signaling Technology, 2870), γ-H2AFX (Cell Signaling Technology, 9718), RB1CC1/FIP200 (Proteintech Group, 17250–1-AP), mouse monoclonal anti-ACTB (Santa Cruz Biotechnology, sc-47778), RAB27A (Proteintech Group, 17817–1-AP) and LAMP1 (Abcam, ab25245). Flow cytometry antibodies and reagents include 7-AAD (BD Biosciences, 5168981E), THY1/thy1.1-PE (BD Biosciences, 551401), ITGAM/Mac-1-PE-Cy7 (BD Biosciences, 552850), c-Kit-APC (BD Biosciences, 553356), ANXA5/annexin V-Pacific blue (BioLegend, 640918) and ANXA5/annexin V binding buffer (BD Biosciences, 51–66121E). Other reagents include DAPI (4, 6 diamidino-2-phenylindole; Invitrogen, D1306), MitoTracker® Red (Life Technologies, M7512), CellROX® (Life Technologies, C10422), and CellTiter 96® AQueous One Solution Cell Proliferation Assay (MTS kit; Promega, G3580). Secondary antibodies for immunofluorescent staining including Alexa Flour 488 goat anti-rabbit IgG (Life Technologies, A11008), Alexa Flour 568 goat anti-rabbit IgG (Life Technologies, A11011), and Alexa Flour 568 goat anti-rat IgG (Life Technologies, A11077). Secondary antibodies for western blot include goat anti-rabbit 680 (LI-COR Biosciences, 926–68071), goat anti-Rabbit 800 (LI-COR Biosciences, 926–32211), goat anti-mouse 680 (LI-COR Biosciences, 929–68070), and goat anti-mouse 800 (LI-COR Biosciences, 926–32210).
Statistical analysis
All data are presented as mean ± standard deviation (SD). A Student t test was used for the comparison between 2 groups. One way ANOVA was used for multiple group comparison. Log-rank analysis was used for the Kaplan-Meier survival curve. Chi-square test was used for TEM data analysis. Analyses were performed with GraphPadPrism Software 6.0. P < 0.05 was considered as statistically significant. *, P < 0.05; **, P < 0.01; ***, P < 0.001.
Abbreviations
| 4-OHT | = | 4-hydroxytamoxifen |
| ACTB | = | actin β |
| AE | = | RUNX1/AML1-RUNX1T1/ETO |
| AML | = | acute myeloid leukemia |
| AraC | = | cytarabine |
| ATG | = | autophagy related |
| BA | = | bafilomycin A1 |
| BECN1 | = | Beclin 1 |
| CQ | = | chloroquine |
| DA | = | doxorubicin |
| DMA | = | 5-(N,N-dimethyl) amiloride HCl |
| RB1CC1/FIP200 | = | RB1-inducible coiled-coil 1 |
| GFP | = | green fluorescent protein |
| GABARAP | = | GABA type A receptor-associated protein |
| IMDM | = | Iscove's modified Dulbecco's medium |
| KMT2A/MLL | = | lysine (K)-specific methyltransferase 2A |
| LAMP1 | = | lysosomal-associated membrane protein 1 |
| LDBM | = | low-density bone marrow cells |
| MAP1LC3/LC3 | = | microtubule- associated protein 1 light chain 3 |
| MA9 | = | KMT2A/MLL-MLLT3/AF9 |
| MLLT3/AF9 | = | myeloid/lymphoid or mixed-lineage leukemia |
| translocated to | = | 3 |
| PIK3C3/Vps34 | = | phosphatidylinositol 3-kinase catalytic subunit type 3 |
| ROS | = | reactive oxygen species |
| RUNX1/AML1 | = | runt related transcription factor 1 |
| RUNX1T1/ETO | = | Runt-related transcription factor 1 |
| translocated to | = | 1 (cyclin D-related) |
| shRNA | = | short hairpin RNA |
| SQSTM1/p62 | = | sequestosome 1 |
| TEM | = | transmission electron microscopy |
| Tuni | = | tunicamycin |
| ULK1/2 | = | unc-51 like autophagy activating kinase 1/2. |
Disclosure of potential conflicts of interest
No potential conflicts of interest were disclosed.
1287652_Supplemental_Material.pdf
Download PDF (1,007.3 KB)Acknowledgments
We thank Xuan Zhou, and James Johnson for offering technical assistance, Drs. Marie-Dominique Filippi, Maria Czyzyk-Krzeska, Gang Huang and Daniel Starczynowski for helpful discussions. We also thank the Research Flow Cytometry Core, the Comprehensive Mouse and Cancer Core and the Pathology Core at Cincinnati Children's Hospital Medical Center for their technical support.
Funding
This study was funded in part by grants from the National Institutes of Health (R01 CA193350, R01 AG040118, R01 HL111192, and P30 DK090971).
Related Research Data
References
- Hara T, Takamura A, Kishi C, Iemura S, Natsume T, Guan JL, Mizushima N. FIP200, a ULK-interacting protein, is required for autophagosome formation in mammalian cells. J Cell Biol 2008; 181:497-510; PMID:18443221; http://dx.doi.org/10.1083/jcb.200712064
- Jung CH, Jun CB, Ro SH, Kim YM, Otto NM, Cao J, Kundu M, Kim DH. ULK-Atg13-FIP200 complexes mediate mTOR signaling to the autophagy machinery. Mol Biol Cell 2009; 20:1992-2003; PMID:19225151; http://dx.doi.org/10.1091/mbc.E08-12-1249
- Mercer CA, Kaliappan A, Dennis PB. A novel, human Atg13 binding protein, Atg101, interacts with ULK1 and is essential for macroautophagy. Autophagy 2009; 5:649-62; PMID:19287211; http://dx.doi.org/10.4161/auto.5.5.8249
- Mizushima N, Kuma A, Kobayashi Y, Yamamoto A, Matsubae M, Takao T, Natsume T, Ohsumi Y, Yoshimori T. Mouse Apg16L, a novel WD-repeat protein, targets to the autophagic isolation membrane with the Apg12-Apg5 conjugate. J Cell Sci 2003; 116:1679-88; PMID:12665549; http://dx.doi.org/10.1242/jcs.00381
- Kabeya Y, Mizushima N, Ueno T, Yamamoto A, Kirisako T, Noda T, Kominami E, Ohsumi Y, Yoshimori T. LC3, a mammalian homologue of yeast Apg8p, is localized in autophagosome membranes after processing. EMBO J 2000; 19:5720-8; PMID:11060023; http://dx.doi.org/10.1093/emboj/19.21.5720
- Nishida Y, Arakawa S, Fujitani K, Yamaguchi H, Mizuta T, Kanaseki T, Komatsu M, Otsu K, Tsujimoto Y, Shimizu S. Discovery of Atg5/Atg7-independent alternative macroautophagy. Nature 2009; 461:654-8; PMID:19794493; http://dx.doi.org/10.1038/nature08455
- Chittaranjan S, Bortnik S, Dragowska WH, Xu J, Abeysundara N, Leung A, Go NE, DeVorkin L, Weppler SA, Gelmon K, et al. Autophagy inhibition augments the anticancer effects of epirubicin treatment in anthracycline-sensitive and -resistant triple-negative breast cancer. Clin Cancer Res 2014; 20:3159-73; PMID:24721646; http://dx.doi.org/10.1158/1078-0432.CCR-13-2060
- Ma XH, Piao SF, Dey S, McAfee Q, Karakousis G, Villanueva J, Hart LS, Levi S, Hu J, Zhang G, et al. Targeting ER stress-induced autophagy overcomes BRAF inhibitor resistance in melanoma. J Clin Invest 2014; 124:1406-17; PMID: 24569374; http://dx.doi.org/10.1172/JCI70454
- Wang J, Wu GS. Role of autophagy in cisplatin resistance in ovarian cancer cells. J Biol Chem 2014; 289:17163-73; PMID:24794870; http://dx.doi.org/10.1074/jbc.M114.558288
- Vogl DT, Stadtmauer EA, Tan KS, Heitjan DF, Davis LE, Pontiggia L, Rangwala R, Piao S, Chang YC, Scott EC, et al. Combined autophagy and proteasome inhibition: a phase 1 trial of hydroxychloroquine and bortezomib in patients with relapsed/refractory myeloma. Autophagy 2014; 10:1380-90; PMID:24991834; http://dx.doi.org/10.4161/auto.29264
- Rangwala R, Chang YC, Hu J, Algazy KM, Evans TL, Fecher LA, Schuchter LM, Torigian DA, Panosian JT, Troxel AB, et al. Combined MTOR and autophagy inhibition: phase I trial of hydroxychloroquine and temsirolimus in patients with advanced solid tumors and melanoma. Autophagy 2014; 10:1391-402; PMID:24991838; http://dx.doi.org/10.4161/auto.29119
- Rosenfeld MR, Ye X, Supko JG, Desideri S, Grossman SA, Brem S, Mikkelson T, Wang D, Chang YC, Hu J, et al. A phase I/II trial of hydroxychloroquine in conjunction with radiation therapy and concurrent and adjuvant temozolomide in patients with newly diagnosed glioblastoma multiforme. Autophagy 2014; 10:1359-68; PMID:24991840; http://dx.doi.org/10.4161/auto.28984
- Sotelo J, Briceno E, Lopez-Gonzalez MA. Adding chloroquine to conventional treatment for glioblastoma multiforme: a randomized, double-blind, placebo-controlled trial. Ann Intern Med 2006; 144:337-43; PMID:16520474; http://dx.doi.org/10.7326/0003-4819-144-5-200603070-00008
- Briceno E, Calderon A, Sotelo J. Institutional experience with chloroquine as an adjuvant to the therapy for glioblastoma multiforme. Surg Neurol 2007; 67:388-91; PMID:17350410; http://dx.doi.org/10.1016/j.surneu.2006.08.080
- Levy JM, Thorburn A. Targeting autophagy during cancer therapy to improve clinical outcomes. Pharmacol Ther 2011; 131:130-41; PMID:21440002; http://dx.doi.org/10.1016/j.pharmthera.2011.03.009
- Willems L, Chapuis N, Puissant A, Maciel TT, Green AS, Jacque N, Vignon C, Park S, Guichard S, Herault O, et al. The dual mTORC1 and mTORC2 inhibitor AZD8055 has anti-tumor activity in acute myeloid leukemia. Leukemia 2012; 26:1195-202; PMID:22143671; http://dx.doi.org/10.1038/leu.2011.339
- Wei Y, Kadia T, Tong W, Zhang M, Jia Y, Yang H, Hu Y, Tambaro FP, Viallet J, O'Brien S, et al. The combination of a histone deacetylase inhibitor with the Bcl-2 homology domain-3 mimetic GX15-070 has synergistic antileukemia activity by activating both apoptosis and autophagy. Clin Cancer Res 2010; 16:3923-32; PMID:20538760; http://dx.doi.org/10.1158/1078-0432.CCR-10-0032
- Torgersen ML, Engedal N, Boe SO, Hokland P, Simonsen A. Targeting autophagy potentiates the apoptotic effect of histone deacetylase inhibitors in t(8;21) AML cells. Blood 2013; 122:2467-76; PMID:23970379; http://dx.doi.org/10.1182/blood-2013-05-500629
- Watson AS, Riffelmacher T, Stranks A, Williams O, De Boer J, Cain K, MacFarlane M, McGouran J, Kessler B, Khandwala S, et al. Autophagy limits proliferation and glycolytic metabolism in acute myeloid leukemia. Cell Death Discov 2015; 1: 15008. PMID:26568842; http://dx.doi.org/10.1038/cddiscovery.2015.8
- Piya S, Kornblau SM, Ruvolo VR, Mu H, Ruvolo PP, McQueen T, Davis RE, Hail N, Jr, Kantarjian H, Andreeff M, et al. Atg7 suppression enhances chemotherapeutic agent sensitivity and overcomes stroma-mediated chemoresistance in acute myeloid leukemia. Blood 2016; 128(9):1260-9; PMID:27268264
- Mortensen M, Soilleux EJ, Djordjevic G, Tripp R, Lutteropp M, Sadighi-Akha E, Stranks AJ, Glanville J, Knight S, Jacobsen SE, et al. The autophagy protein Atg7 is essential for hematopoietic stem cell maintenance. J Exp Med 2011; 208:455-67; PMID:21339326; http://dx.doi.org/10.1084/jem.20101145
- Liu F, Lee JY, Wei H, Tanabe O, Engel JD, Morrison SJ, Guan JL. FIP200 is required for the cell-autonomous maintenance of fetal hematopoietic stem cells. Blood 2010; 116:4806-14; PMID:20716775; http://dx.doi.org/10.1182/blood-2010-06-288589
- Warr MR, Binnewies M, Flach J, Reynaud D, Garg T, Malhotra R, Debnath J, Passegue E. FOXO3A directs a protective autophagy program in haematopoietic stem cells. Nature 2013; 494:323-7; PMID:23389440; http://dx.doi.org/10.1038/nature11895
- Mortensen M, Ferguson DJ, Edelmann M, Kessler B, Morten KJ, Komatsu M, Simon AK. Loss of autophagy in erythroid cells leads to defective removal of mitochondria and severe anemia in vivo. Proc Natl Acad Sci U S A 2010; 107:832-7; PMID:20080761; http://dx.doi.org/10.1073/pnas.0913170107
- Gomez-Puerto MC, Folkerts H, Wierenga AT, Schepers K, Schuringa JJ, Coffer PJ, Vellenga E. Autophagy proteins ATG5 and ATG7 are essential for the maintenance of human CD34 hematopoietic stem-progenitor cells. Stem Cells 2016; 34(6):1651-63
- Pui CH, Carroll WL, Meshinchi S, Arceci RJ. Biology, risk stratification, and therapy of pediatric acute leukemias: an update. J Clin Oncol 2011; 29:551-65; PMID:21220611; http://dx.doi.org/10.1200/JCO.2010.30.7405
- Kishi-Itakura C, Koyama-Honda I, Itakura E, Mizushima N. Ultrastructural analysis of autophagosome organization using mammalian autophagy-deficient cells. J Cell Sci 2014; 127:4089-102; PMID:25052093; http://dx.doi.org/10.1242/jcs.156034
- Hara T, Nakamura K, Matsui M, Yamamoto A, Nakahara Y, Suzuki-Migishima R, Yokoyama M, Mishima K, Saito I, Okano H, et al. Suppression of basal autophagy in neural cells causes neurodegenerative disease in mice. Nature 2006; 441:885-9; PMID:16625204; http://dx.doi.org/10.1038/nature04724
- Tal MC, Sasai M, Lee HK, Yordy B, Shadel GS, Iwasaki A. Absence of autophagy results in reactive oxygen species-dependent amplification of RLR signaling. Proc Natl Acad Sci U S A 2009; 106:2770-5; PMID:19196953; http://dx.doi.org/10.1073/pnas.0807694106
- Miyoshi H, Kozu T, Shimizu K, Enomoto K, Maseki N, Kaneko Y, Kamada N, Ohki M. The t(8;21) translocation in acute myeloid leukemia results in production of an AML1-MTG8 fusion transcript. EMBO J 1993; 12:2715-21; PMID:8334990
- Altman BJ, Jacobs SR, Mason EF, Michalek RD, MacIntyre AN, Coloff JL, Ilkayeva O, Jia W, He YW, Rathmell JC. Autophagy is essential to suppress cell stress and to allow BCR-Abl-mediated leukemogenesis. Oncogene 2011; 30:1855-67; PMID:21151168; http://dx.doi.org/10.1038/onc.2010.561
- Maes H, Kuchnio A, Peric A, Moens S, Nys K, De Bock K, Quaegebeur A, Schoors S, Georgiadou M, Wouters J, et al. Tumor vessel normalization by chloroquine independent of autophagy. Cancer Cell 2014; 26:190-206; PMID:25117709; http://dx.doi.org/10.1016/j.ccr.2014.06.025
- Maycotte P, Aryal S, Cummings CT, Thorburn J, Morgan MJ, Thorburn A. Chloroquine sensitizes breast cancer cells to chemotherapy independent of autophagy. Autophagy 2012; 8:200-12; PMID:22252008; http://dx.doi.org/10.4161/auto.8.2.18554
- Cambie G, Verdier F, Gaudebout C, Clavier F, Ginsburg H. The pharmacokinetics of chloroquine in healthy and Plasmodium chabaudi-infected mice: implications for chronotherapy. Parasite 1994; 1:219-26; PMID:9140488; http://dx.doi.org/10.1051/parasite/1994013219
- Rosenfeld MR, Grossman SA, Brem S, Mikkelsen T, Wang D, Piao S, Davis LE, O'Dwyer PJ, Amaravadi RK. Pharmacokinetic analysis and pharmacodynamic evidence of autophagy inhibition in patients with newly diagnosed glioblastoma treated on a phase I trial of hydroxychloroquine in combination with adjuvant temozolomide and radiation (ABTC 0603). J Clin Oncol (Meeting Abstracts) 2010; 28:3086
- McAfee Q, Zhang Z, Samanta A, Levi SM, Ma XH, Piao S, Lynch JP, Uehara T, Sepulveda AR, Davis LE, et al. Autophagy inhibitor Lys05 has single-agent antitumor activity and reproduces the phenotype of a genetic autophagy deficiency. Proc Natl Acad Sci U S A 2012; 109:8253-8; PMID:22566612; http://dx.doi.org/10.1073/pnas.1118193109
- Zhang L, Zhang S, Yao J, Lowery FJ, Zhang Q, Huang WC, Li P, Li M, Wang X, Zhang C, et al. Microenvironment-induced PTEN loss by exosomal microRNA primes brain metastasis outgrowth. Nature 2015; 527:100-4; PMID:26479035; http://dx.doi.org/10.1038/nature15376
- Ostrowski M, Carmo NB, Krumeich S, Fanget I, Raposo G, Savina A, Moita CF, Schauer K, Hume AN, Freitas RP, et al. Rab27a and Rab27b control different steps of the exosome secretion pathway. Nat Cell Biol 2010; 12:19-30; sup pp 1-13; PMID:19966785; http://dx.doi.org/10.1038/ncb2000
- Sehgal AR, Konig H, Johnson DE, Tang D, Amaravadi RK, Boyiadzis M, Lotze MT. You eat what you are: autophagy inhibition as a therapeutic strategy in leukemia. Leukemia 2015; 29:517-25; PMID:25541151; http://dx.doi.org/10.1038/leu.2014.349
- Evangelisti C, Evangelisti C, Chiarini F, Lonetti A, Buontempo F, Neri LM, McCubrey JA, Martelli AM. Autophagy in acute leukemias: a double-edged sword with important therapeutic implications. Biochim Biophys Acta 2015; 1853:14-26; PMID:25284725; http://dx.doi.org/10.1016/j.bbamcr.2014.09.023
- Sumitomo Y, Koya J, Kataoka K, Tsuruta-Kishino T, Morita K, Sato T, Kurokawa M. Enhanced autophagy promotes survival of peripheral blast cells from murine acute myeloid leukemia. Blood 2014; 124:2339
- Mandelbaum J, Rollins N, Shah P, Bowman D, Lee JY, Tayber O, Bernard H, LeRoy P, Li P, Koenig E, et al. Identification of a lung cancer cell line deficient in atg7-dependent autophagy. Autophagy 2015: June 19 (Epub ahead of print).; PMID:26090719
- Ouyang DY, Xu LH, He XH, Zhang YT, Zeng LH, Cai JY, Ren S. Autophagy is differentially induced in prostate cancer LNCaP, DU145 and PC-3 cells via distinct splicing profiles of ATG5. Autophagy 2013; 9:20-32; PMID:23075929; http://dx.doi.org/10.4161/auto.22397
- Eng CH, Wang Z, Tkach D, Toral-Barza L, Ugwonali S, Liu S, Fitzgerald SL, George E, Frias E, Cochran N, et al. Macroautophagy is dispensable for growth of KRAS mutant tumors and chloroquine efficacy. Proc Natl Acad Sci U S A 2016; 113:182-7; PMID:26677873; http://dx.doi.org/10.1073/pnas.1515617113
- Solomon VR, Lee H. Chloroquine and its analogs: a new promise of an old drug for effective and safe cancer therapies. Eur J Pharmacol 2009; 625:220-33; PMID:19836374; http://dx.doi.org/10.1016/j.ejphar.2009.06.063
- Jensen PB, Sorensen BS, Sehested M, Grue P, Demant EJ, Hansen HH. Targeting the cytotoxicity of topoisomerase II-directed epipodophyllotoxins to tumor cells in acidic environments. Cancer Res 1994; 54:2959-63; PMID:8187081
- Lee CM, Tannock IF. Inhibition of endosomal sequestration of basic anticancer drugs: influence on cytotoxicity and tissue penetration. Br J Cancer 2006; 94:863-9; PMID:16495919; http://dx.doi.org/10.1038/sj.bjc.6603010
- Zhou Q, McCracken MA, Strobl JS. Control of mammary tumor cell growth in vitro by novel cell differentiation and apoptosis agents. Breast Cancer Res Treat 2002; 75:107-17; PMID:12243503; http://dx.doi.org/10.1023/A:1019698807564
- Boya P, Gonzalez-Polo RA, Poncet D, Andreau K, Vieira HL, Roumier T, Perfettini JL, Kroemer G. Mitochondrial membrane permeabilization is a critical step of lysosome-initiated apoptosis induced by hydroxychloroquine. Oncogene 2003; 22:3927-36; PMID:12813466; http://dx.doi.org/10.1038/sj.onc.1206622
- Amaravadi RK, Yu D, Lum JJ, Bui T, Christophorou MA, Evan GI, Thomas-Tikhonenko A, Thompson CB. Autophagy inhibition enhances therapy-induced apoptosis in a Myc-induced model of lymphoma. J Clin Invest 2007; 117:326-36; PMID:17235397; http://dx.doi.org/10.1172/JCI28833
- Peters S, Reinthal E, Blitgen-Heinecke P, Bartz-Schmidt KU, Schraermeyer U. Inhibition of lysosomal degradation in retinal pigment epithelium cells induces exocytosis of phagocytic residual material at the basolateral plasma membrane. Ophthalmic Res 2006; 38:83-8; PMID:16352920; http://dx.doi.org/10.1159/000090268
- Gan B, Peng X, Nagy T, Alcaraz A, Gu H, Guan JL. Role of FIP200 in cardiac and liver development and its regulation of TNFalpha and TSC-mTOR signaling pathways. J Cell Biol 2006; 175:121-33; PMID:17015619; http://dx.doi.org/10.1083/jcb.200604129
- Kumar AR, Hudson WA, Chen W, Nishiuchi R, Yao Q, Kersey JH. Hoxa9 influences the phenotype but not the incidence of Mll-AF9 fusion gene leukemia. Blood 2004; 103:1823-8; PMID:14615372; http://dx.doi.org/10.1182/blood-2003-07-2582
- Goyama S, Schibler J, Cunningham L, Zhang Y, Rao Y, Nishimoto N, Nakagawa M, Olsson A, Wunderlich M, Link KA, et al. Transcription factor RUNX1 promotes survival of acute myeloid leukemia cells. J Clin Invest 2013; 123:3876-88; PMID:23979164; http://dx.doi.org/10.1172/JCI68557
- Krejci O, Wunderlich M, Geiger H, Chou FS, Schleimer D, Jansen M, Andreassen PR, Mulloy JC. p53 signaling in response to increased DNA damage sensitizes AML1-ETO cells to stress-induced death. Blood 2008; 111:2190-9; PMID:17975013; http://dx.doi.org/10.1182/blood-2007-06-093682
- Wei J, Wunderlich M, Fox C, Alvarez S, Cigudosa JC, Wilhelm JS, Zheng Y, Cancelas JA, Gu Y, Jansen M, et al. Microenvironment determines lineage fate in a human model of MLL-AF9 leukemia. Cancer Cell 2008; 13:483-95; PMID:18538732; http://dx.doi.org/10.1016/j.ccr.2008.04.020
- Roychoudhury J, Clark JP, Gracia-Maldonado G, Unnisa Z, Wunderlich M, Link KA, Dasgupta N, Aronow B, Huang G, Mulloy JC, et al. MEIS1 regulates an HLF-oxidative stress axis in MLL-fusion gene leukemia. Blood 2015; 125:2544-52; PMID:25740828; http://dx.doi.org/10.1182/blood-2014-09-599258