
ABSTRACT
Conditional knockout mice for Atg9a, specifically in brain tissue, were generated to understand the roles of ATG9A in the neural tissue cells. The mice were born normally, but half of them died within one wk, and none lived beyond 4 wk of age. SQSTM1/p62 and NBR1, receptor proteins for selective autophagy, together with ubiquitin, accumulated in Atg9a-deficient neurosoma at postnatal d 15 (P15), indicating an inhibition of autophagy, whereas these proteins were significantly decreased at P28, as evidenced by immunohistochemistry, electron microscopy and western blot. Conversely, degenerative changes such as spongiosis of nerve fiber tracts proceeded in axons and their terminals that were occupied with aberrant membrane structures and amorphous materials at P28, although no clear-cut degenerative change was detected in neuronal cell bodies. Different from autophagy, diffusion tensor magnetic resonance imaging and histological observations revealed Atg9a-deficiency-induced dysgenesis of the corpus callosum and anterior commissure. As for the neurite extensions of primary cultured neurons, the neurite outgrowth after 3 d culturing was significantly impaired in primary neurons from atg9a-KO mouse brains, but not in those from atg7-KO and atg16l1-KO brains. Moreover, this tendency was also confirmed in Atg9a-knockdown neurons under an atg7-KO background, indicating the role of ATG9A in the regulation of neurite outgrowth that is independent of autophagy. These results suggest that Atg9a deficiency causes progressive degeneration in the axons and their terminals, but not in neuronal cell bodies, where the degradations of SQSTM1/p62 and NBR1 were insufficiently suppressed. Moreover, the deletion of Atg9a impaired nerve fiber tract formation.
Introduction
Macroautophagy (hereafter referred to as autophagy) is a lysosome-mediated intracellular bulk or selective degradation system to remove macromolecules and organelles. Autophagy has an essential role in the maintenance of cellular metabolism.Citation1-5 The Atg proteins involved in autophagosome formation consist of several functional units: Atg1 kinase and its regulators, the PtdIns3K complex, Atg9, the Atg2-Atg18 complex, and 2 ubiquitin-like conjugation systems.Citation6 In these functional units, the 2 ubiquitin-like conjugation systems (E1 and E2) of Atg12 and Atg8 work at the later or maturation stages of autophagosome formation. Atg12 is activated by Atg7 (E1) and conjugated to Atg5 by Atg10 (E2), while Atg7 (E1), Atg3 (E2) and Atg5 that forms a complex together with Atg12 and Atg16 (E3) are essential for the Atg8–phosphatyidylethanolamine conjugation system.Citation6 Knockout mouse models for Atg7, Atg3, Atg5 and Atg16l1 die soon after birth because of the neonatal energy depletion.Citation7-10 Moreover, deficiency of Atg7 specifically in the liver accumulates SQSTM1/p62 (hereafter referred to as SQSTM1) in the cytoplasm of hepatocytes that has binding sites for MAP1LC3 (hereafter referred to as LC3) and ubiquitin,Citation8,11 indicating that SQSTM1 itself is a substrate of autophagy and is taken up into autophagosomes by linking both ubiquitin conjugating with target molecules and LC3 localizing on the phagophore. Like SQSTM1, many other proteins have binding regions with ubiquitin and LC3 and work as receptor proteins of selective autophagy.Citation12 When Atg7 or Atg5 is deleted specifically in mouse central nervous system (CNS) tissue, SQSTM1 and ubiquitin accumulate in neuronal soma and abnormal membranous structures also accumulate in axon terminals, resulting in neuron death, and abnormal limb reflexes.Citation13-16 These manifestations indicate that the suppression of autophagy in CNS tissue causes neurodegeneration.
Atg9 is the only transmembrane protein among autophagy-related proteins, and it is thought to work at the initial stage of autophagosome formation.Citation17 There are 2 genes, Atg9a and Atg9b, that are mammalian orthologs of yeast ATG9, and the protein products of these genes are functional. ATG9A is generally expressed in mammalian tissue cells, but expression of ATG9B is limited to the placenta and pituitary gland.Citation18 Like knockout mice for Atg7 and Atg5, those for Atg9a die within one d after birth,Citation19 although atg9a-conventional knockout mice become embryonic-lethal after crossing with C57B6 mice.Citation20 It has been shown that the degradation of SQSTM1 and long-lived proteins are impaired in mouse embryonic fibroblasts deficient in Atg9a.Citation19 Moreover, ATG9A localizes on the trans-Golgi network and on early, late or recycling endosomes under the basal conditions, while ATG9A vesicles translocate to autophagosome-forming sites under starvation conditions,Citation21-25 which play an important role in the early stage of autophagosome formation.Citation26,27
Our previous study reveals that ATG9A protein is localized throughout neurons including somatodendrites, axons and axonal terminals.Citation28 However, the precise roles of ATG9A in neurons remain largely unknown. To further investigate the function of ATG9A, we generated Atg9a-flox mice (Atg9aF/F) and crossed them with transgenic mice expressing Cre recombinase under the control of the Nes promoter (Atg9aF/F: Nes-Cre, CKO) to produce a CNS-specific, conditional knockout model. We found that ATG9A is involved in the maintenance of homeostasis in the axons and in their terminals in CNS neurons.
Results
Generation of Atg9aF/F:Nes-Cre (atg9a-CKO) mice and their symptoms
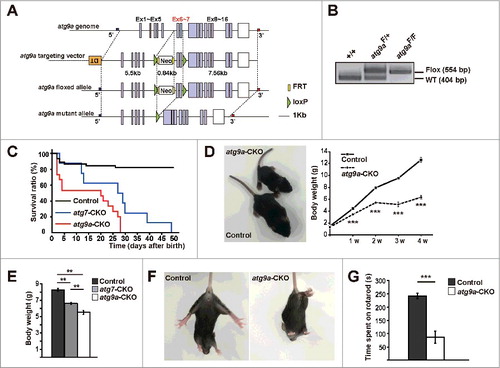
To further examine the roles of ATG9A in neurons, we generated knockout mice for Atg9a specifically in CNS tissue (Atg9aF/F:Nes-Cre mice, atg9a -CKO) (). We confirmed that 2 distinguishable bands of wild-type (WT) (404 bp) and flox (554 bp) alleles were detected by PCR analyses, while protein bands immunopositive for ATG9A largely disappeared in atg9a-CKO brains ( and ). Although atg9a conventional knockout mice die within one d after birth or are embryonic lethal,Citation19,20 atg9a-CKO mice were born in the expected Mendelian ratio. About half of them died, however, within one wk after birth (). Even when they survived, the mice were much smaller in size, compared with their floxed control littermates (Atg9aF/+ or Atg9aF/F Cre-/- mice) and Atg7F/F:Nes-Cre (atg7-CKO) mice ( and ), and died at 4 wk of age (). They experienced severe convulsions, locomotor ataxia and abnormal limb-clasping reflexes. Severe convulsion and locomotor ataxia became distinct at 2 wk of age, whereas obvious abnormal limb-clasping reflexes were not detected until 4 wk after birth because of severe convulsions ( and Movies S1 to 3). To examine coordinated movement, atg9a-CKO mice were tested by the rotarod performance and found that the length of time that the atg9a-CKO mice could stay on the rotating rod was significantly shorter than that in floxed control littermates (). According to these results, atg9a-CKO mice showed similar phenotypes to those detected in atg7-CKO mice, but they exhibited growth retardation that was even more severe, and they died at earlier stages.
Figure 1. Generation and phenotypes of mice with atg9a conditional KO specific for CNS tissue. (A) Schematic representation of wild-type, flox and mutant alleles of Atg9a gene. The green triangles denote loxP sequences. (B) PCR analyses of genomic DNA extracted from wild-type, Atg9aF/+ and Atg9aF/F mice tails. (C) The survival curve of atg9a-CKO (Atg9aF/F: Nes-Cre), atg7-CKO (Atg7F/F: Nes-Cre) and floxed control mice (littermates for atg9a-CKO mice and those for atg7-CKO mice without Cre recombinase expression) after the Kaplan-Meier method. The numbers of mice used were 45 for littermate floxed control and 15 for atg9a-CKO mice. (D) Representative pictures of floxed control (Atg9aF/+ Cre-/-) (larger one) and atg9a-CKO (smaller one) mice at P15 (left). Changes in body weight of atg9a-CKO mice and their floxed control littermate mice until 4 wk after birth. Results are expressed as mean ± SEM (n ≥ 5, at each postnatal d after birth) (right). Statistical analyses were performed using the Student t test. (E) A comparison of body weight between floxed control, atg7-CKO and atg9a-CKO mice at 2 wk after birth. Results are expressed as mean ± SEM (n ≥ 8, at each postnatal d after birth). Statistical analyses were performed using one-way analysis of variance (ANOVA) followed by the Tukey-Kramer post hoc test. (F) Normal (floxed control) and abnormal limb-clasping reflexes in floxed control and atg9a-CKO mice at P28. (G) A rotarod performance test. The bar graph shows the length of time that atg9a-CKO (white bar) and floxed control (black bar) mice could stay on the rotating rod. Results are expressed as mean ± SEM n = 6 in floxed control and 3 in atg9a-CKO mice at P21. ** P < 0.01, *** P < 0.001. Statistical analyses were performed using the Student t test.
Impairment of autophagy in neurons
Immunohistochemical analyses revealed that dot-like immunoreactivity for ubiquitin, SQSTM1 and NBR1 accumulated in neurons of the deep cerebellar nucleus (DCN) in atg9a-CKO mice at P15, and they colocalized with each other in the neurons (). Results from electron microscopy showed that numerous large inclusions containing fine fibrous structures were tightly surrounded by a partially rough-surfaced endoplasmic reticulum (ER) with a cytoplasmic surface attached by ribosomes. Such ER-membranes often extended into fibrous inclusions and, in some cases, formed vesicles (). Fibrous inclusions without ER-association were similar to those detected in atg7-CKO mouse neurons, and so-called ubiquitin aggregates.Citation8 In fact, immunoelectron microscopic observations using cryo-thin sections reveled that gold particles indicating ubiquitin were deposited on the fibrous inclusion (Fig. S1A).
Figure 2. Accumulation of ubiquitin, SQSTM1 and NBR1 in atg9a-CKO mouse brains. (A) Immunofluorescence for SQSTM1, ubiquitin and NBR1 in neurons of DCN in atg9a-CKO mice at P15. White arrows indicate colocalization of positive signals for these proteins. Scale bars: 20 μm. (B) Electron micrographs of a DCN neuron in an atg9a-CKO mouse brain at P15. The square in the upper panel is enlarged in the lower panel. Asterisks in both figures indicate an ubiquitin aggregate that is encircled by ER. Scale bars: 1 μm. (C) Immunostaining of ubiquitin, SQSTM1 and NBR1 in the cerebrum cortexes of floxed control, atg7-CKO and atg9a-CKO mice at 2 and 4 wk of age. Scale bar: 20 µm. (D) Western blot analyses of ubiquitin, SQSTM1, NBR1, ATG7, ATG9A, and MAP1LC3A/B in brain lysates from floxed control, atg7-CKO and atg9a-CKO mice at 2 and 4 wk of age. Immunostaining for actin is used for an internal control. (E) Quantification of each protein band of SQSTM1 and NBR1. Results are expressed as mean ± SEM. * P < 0.05, ** P < 0.01, ns, not significant, n = 3 for each. Statistical analyses were performed using the Student t test.
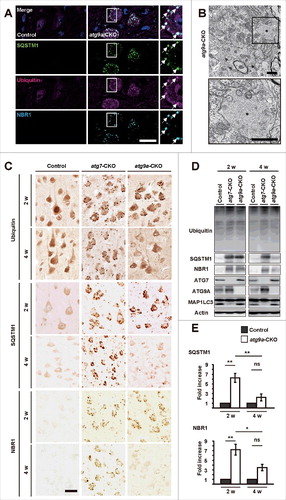
Dot-like immunoreactivity for ubiquitin, SQSTM1 and NBR1 appeared abundant in atg9a-CKO cerebral cortical neurons at 2 wk of age, but were decreased in both size and number at 4 wk of age (). Accumulated inclusions did not change in atg7-CKO neurons. Drastic changes in the accumulation of ubiquitin aggregates were also detected in the neurons of hippocampus, thalamus, hypothalamus and pons at 2 and 4 wk of age (Fig. S2 to 4). These immunocytochemical data for SQSTM1 and NBR1 were confirmed by western blot analysis (), which showed that protein amounts of SQSTM1 and NBR1 were significantly increased in brain lysates from atg9a-CKO mice at 2 wk of age compared with those from floxed control mice (), which was similar to those of atg7-CKO mice. Protein amounts of both SQSTM1 and NBR1 were decreased in brain lysates from atg9a-CKO mice at 4 wk of age, but such a reduction was not found in brain lysates from atg7-CKO mice. Moreover, a reduction in ubiquitinated proteins was also found in atg9a-CKO brain lysates of mice between 2 and 4 wk of age, although no clear-cut difference was detected in atg7-CKO and floxed control brain lysates between 2 and 4 wk of age (). Furthermore, the conversion of LC3-I to LC3-II occurred in atg9a-CKO brains, as evidenced by western blot (). Interestingly, immunoreactivity for LC3 in atg9a-CKO DCN neurons was detected in puncta immunopositive for SQSTM1 and NBR1 (Fig. S1B). Ubiquitin aggregates with an ER-association were detected, but both the size and incidence were much smaller in atg9a-CKO neurons than in atg7-CKO neurons (Fig. S2 and S5A to D). In addition, atg9a-CKO neurons in DCN, in some cases, contained autophagosome-like structures at 4 wk of age (Fig. S5E and F). Although degenerative changes were not clearly detected in neuronal cell bodies of atg9a-CKO mouse brains, the issue of whether neuronal cell death occurs in the cerebral, thalamic and hippocampal regions of floxed control and atg9a-CKO brains were examined at P15 and also at P28 with staining of TUNEL. The result showed that the number of neurons positively stained with TUNEL was very small in brain sections of cerebral cortical, thalamic and hippocampal regions, and it did not significantly differ between floxed control and atg9a-CKO mouse brains at P15 and also at P28 (Fig. S6A and B).
These data suggest that although ATG9A is essential for the execution of autophagy and the loss of ATG9A caused the accumulation of ubiquitin aggregates until 2 wk of age, it is possible to assume that the autophagic degradation pathway for ubiquitin, SQSTM1 and NBR1 may be executed, to some extent, in the perikaryal region of atg9a-CKO neurons after 2 wk of age.
Axonal degeneration of Purkinje cells in the cerebellum
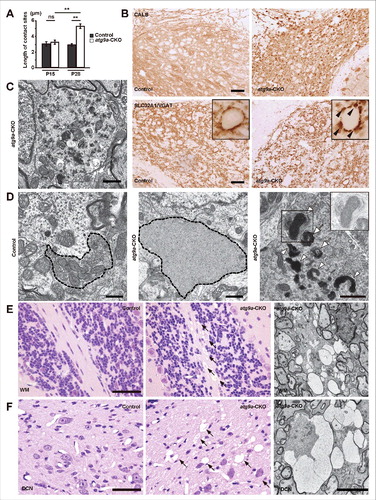
Since autophagy defects by deletion of the Atg5, Atg7, Rb1cc1/Fip200 or Wdr45/Wipi4 gene cause axonal swelling with an accumulation of abnormal membranes in Purkinje cells,Citation13-16,29-31 the present study investigated changes in the axons and their terminals of Purkinje cells in atg9a-CKO mice. When examined by immunostaining of CALB (calbindin), a marker for Purkinje cells, and SLC32A1/VGAT, a marker for the axon terminals of GABAergic neurons, CALB-positive axonal spheroids appeared, to some extent, and SLC32A1/VGAT-positive axon terminals became slightly larger in the DCN of atg9a-CKO mice at 2 wk of age (Fig. S7A and B). This tendency was also confirmed by electron microscopy (Fig. S7C and D), but when the mean length of contact sites with neurons in the DCN was measured, it did not differ from the mean length of floxed control axon terminals (). At 4 wk of age, CALB-positive axonal spheroids appeared abundant and became larger in size, while SLC32A1/VGAT-positive axon terminals became larger than those at 2 wk of age (). Enlarged spheroids or axons frequently appeared in the DCN and contained numerous aberrant membrane or amorphous structures with double-membrane vesicles and mitochondria that sometimes became dense in the matrix (), while similar aberrant membrane structures and amorphous structures often occupied the axon terminals (). The mean contact length of atg9a-CKO axon terminals with DCN neurons was much larger than that of the floxed control axon terminals ().
Figure 3. Morphological changes in Purkinje cell axons and their terminals. (A) The bar graph shows the lengths of the contacting zones of the axon terminals of Purkinje cells with DCN neurons in floxed control and atg9a-CKO mice at P15 and P28. Results are expressed as mean ± SEM. (n = 10 to 15 axon terminals of each). ** P < 0.01. Statistical analyses were performed using one-way analysis of variance (ANOVA) followed by the Tukey-Kramer post hoc test. (B) Immunoreactivity for CALB and SLC32A1/VGAT in the DCN of atg9a-CKO mice at P28. Insets show enlarged axon terminals with positive staining of SLC32A1/VGAT (arrowheads). Scale bar: 50 μm. (C, D) Electron micrographs of a spheroid in the DCN of an atg9a-CKO mouse (C) and axon terminals of the floxed control and atg9a-CKO mice (D) at P28. A spheroid with thin layers of myelin is occupied with various profiles of vesicles and vacuoles (C), while a synaptic region in the floxed control DCN and a large synaptic region with an amorphous structure or degenerating mitochondria in the atg9a-CKO DCN are shown (D). Degenerating mitochondria with electron dense materials are demonstrated and aberrant membrane structures are detected near these mitochondria (white arrowheads). Some structures are encircled by double membranes (white arrows). Insets show the squared portions, in which mitochondria with low contrast are demonstrated. Scale bar: 1 μm. (E, F) Axonal spongiform changes in the white matter (E) and in the DCN (F) of the cerebellum in an atg9a-CKO mouse. HE staining of the white matter of a floxed control and an atg9a-CKO mouse cerebellum (E) and that of the DCN of floxed control and atg9a-CKO mouse cerebellum (F). Electron micrographs showing large swollen axons with high electron dense materials in the white matter (E, right) and DCN (F, right). Scale bars: 50 μm for light microscopy in (E and F) and 5 μm for electron microscopy in (E and F).
As for immunoreactivity for ubiquitin, it was diffuse and weak in these swollen axons and axon terminals of Purkinje cells, but aggregate-like intense signals were not detected in these axonal regions (Fig. S7E and F). By electron microscopy observations, ubiquitin aggregate-like structures as shown in were not detected in axons and their terminals of atg9a-CKO brains.
Because axons and their terminals in the DCN of atg9a-CKO mice at 4 wk of age were degenerative, we further examined Purkinje cell bodies and found changes in the Golgi apparatus. When stained with GOLGA2/GM130, a marker for cis-Golgi apparatus, GOLGA2/GM130-positive immunoreactivity took a round form at the perinuclear region of the Purkinje cells at 4 wk of age, but it appeared flat in Purkinje cells from floxed control littermate brains of atg9a-CKO mice and atg7-CKO brains at 4 wk of age, as well as floxed control littermate brains of atg9a-CKO mice, and atg7-CKO and atg9a-CKO brains at 2 wk of age (Fig. S8). Although clear-cut degenerative changes in Purkinje cell bodies were not detected at this stage, axonal spongiform changes were also detected in the white matter and DCN of the cerebellum ( and ). By electron microscopy, large swollen axons with thin myelin were detected in the white matter and DCN, along with slightly high electron dense materials ( and ). Moreover, axonal spongiform changes were also detected in the thalamus, cerebral cortex and spinal cord of atg9a-CKO neuronal tissues at 4 wk of age (Fig. S9A to C). Electron microscopy also showed large swollen axons occupied by amorphous substances in the thalamic region (Fig. S9D). As stated above, progressive structural alterations were detected in axons and their terminals of atg9a-CKO mouse brains, no clear-cut degenerative changes were observed in the neuronal cell bodies.
These results indicate that severe degenerative changes in axons proceeded in atg9a-CKO brains, although accumulation of ubiquitin, SQSTM1 and NBR1 decreased in the neuronal cell bodies of these brains.
Dysgenesis of the corpus callosum and anterior commissure
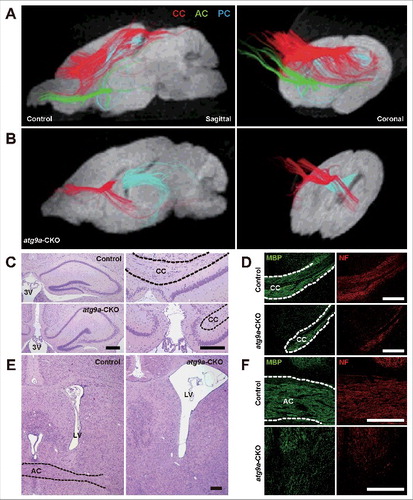
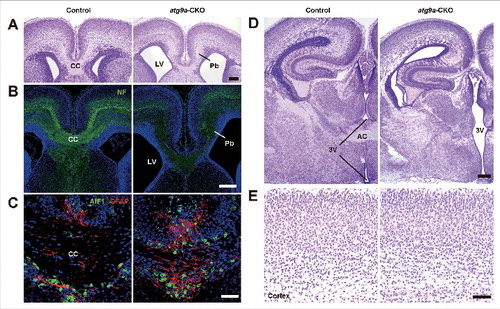
Histological observations of brains of atg9a-CKO mice at 2 and 4 wk of age showed callosal dysgenesis. We therefore analyzed various white matter tracts in atg9a-CKO brains at 3 wk of age by diffusion tensor magnetic resonance (DTM) imaging. As shown in and , crossing nerve fibers were detected in the midline of the corpus callosum in the floxed control mouse brains, but such nerve fibers were massively decreased in the anterior portion of the corpus callosum of atg9a-CKO brains and completely lost in the posterior portion. Beneath the anterior portion of the corpus callosum, the crossing nerve fibers of the anterior commissure were observed in the floxed control brains, but no crossing fibers were detected in the corresponding regions of atg9a-CKO brains ( and ). Unlike the anterior commissures, abundant nerve fibers were observed as the posterior commissures in both floxed control and atg9a-CKO mouse brains ( and ). To confirm the impairment of nerve fiber extension, histological examinations of floxed control, atg7-CKO and atg9a-CKO brains were performed using coronal sections stained with hematoxylin-eosin (HE). Crossing nerve fibers in the middle portion of the corpus callosum were distinctly detected in coronal sections from the anterior to the posterior portions of the cerebrum in the floxed control brains, although the middle portion of the corpus callosum was not formed and the third ventricular space was continuous to the subdural space of the cerebral longitudinal fissure ( and ). Moreover, the place where the anterior commissure passed in the floxed control brains showed no nerve fibers in atg9a-CKO brains ( and ). By immunohistochemistry for myelin basic protein (MBP) and neurofilaments (SMI31), similar defects in nerve fiber tracts were observed in atg9a-CKO brains ( and ). Crossing nerve fibers in the corpus callosum and anterior commissure were discerned in the atg7-CKO brains at P28 (Fig. S10A to D). These results suggest that ATG9A plays important roles not only in the autophagosome formation but also in neuronal circuit formation.
Figure 4. Dysgenesis of the corpus callosum and anterior commissures. (A, B) Diffusion tensor tractography of the corpus callosum (CC; red), anterior commissures (AC; green) and posterior commissures (PC; blue) in floxed control (A) and atg9a-CKO (B) mouse brains at P21. Sagittal direction (left) and coronal direction (right). (C to F) Intact and dysgenetic figures of the corpus callosum (C, D) and anterior commissures (E, F) from floxed control and atg9a-CKO mice at P28. HE staining (C, E) and immunofluorescent staining of myelin basic protein and phosphorylated neurofilaments (NF) (D, F). Black and white broken lines indicate the respective nerve fibers. LV, lateral ventricle; 3V, third ventricle. Scale bar: 200 μm.
To further examine the impairment of nerve fiber extensions in the developing cerebrum, histological approaches were applied to brain tissues from atg9a-CKO mice and floxed control littermate mice at embryonic d 18 (E18). As shown in and , nerve fibers formed the corpus callosum by crossing in the middle portion of floxed control mouse brains, as evidenced by HE staining and immunostaining for neurofilaments. However, crossing nerve fibers were not detected in the middle portion of the expected corpus callosum in the atg9a-CKO brains, but the longitudinal callosal fascicles (Probst bundles) were detected, and these presented a failure of the callosally-projecting neurons to extend axons across the midline ( and ). Instead of crossing fibers in the midline, GFAP-positive astrocytes occupied the middle portion (). Posterior to this portion of the brains, the developing corpus callosum was not formed and the third ventricular space was continuous to the subdural space of the longitudinal fissure in the atg9a-CKO brains (). Moreover, the anterior commissures were formed in the middle portion of the third ventricle of the floxed control mouse brains at E18, whereas no communication was detected in the expected portions where the third ventricular space was continuous to the basal portion of the atg9a-CKO brains (). Although a dysgenesis of neuronal tract formation was detected in atg9a-CKO developing brains at E18, cerebral cortical layers were distinctly formed in these brains (). These results indicate that dysgenesis of the corpus callosum and anterior commissure occur in atg9a-CKO brains even at E18.
Figure 5. Dysgenesis of the corpus callosum and anterior commissures in the developing brains. (A to C) Developing corpus callosum (CC) of a floxed control brain and Probst bundles (Pb) of an atg9a-CKO brain at E18. HE (A) and immunofluorescent staining of phosphorylated neurofilaments (NF) (B) and GFAP-positive astroglial cells and AIF1/IBA1-positive microglial cells (C). LV indicates lateral ventricle, and Pb indicates Probst bundle. (D) Developing anterior commissures (AC) of a floxed control brain and no crossing nerve fibers in the respective region of an atg9a-CKO brain at E18. 3V, third ventricle. (E) Hematoxylin-eosin staining images of developing cerebral cortexes in floxed control and atg9a-CKO brains at E18. Scale bars: 200 μm (A, B, D) and 50 μm (C, E).
Impairment of the neurite extension of primary cultured cortical neurons
Since the dysgenesis of neuronal tract formation occurred in atg9a-CKO brains, axonal extension was examined in the cultures of primary cerebral cortical neurons (PCN) obtained from control littermate brains of each KO mouse, and atg7-, atg16l1-, and atg9a-knockout (KO) mouse brains at E14.5. PCNs transfected with the GFP expression vector were cultured for 3 d (DIV) and compared with PCNs obtained from each of littermate control brains, and atg9a-, atg7- and atg16l1-KO mouse brains for degrees of neurite elongation. Neurites from each of control littermate PCNs extended straight, while those from atg7- and atg16l1-KO PCNs were similar to those from control littermate neurites. Different from control littermate neurons, neurites from atg9a-KO PCNs did not elongate and extend straight (), while they often coiled in one place at 7 DIV (). Neurite growth was compared between control littermate and knockout PCNs of each pair at 3 DIV; the longest neurite in atg9a-KO PCNs was significantly shorter than that from control littermate PCNs, but the longest neurites in other pairs of PCNs did not differ between control littermate and KO-PCNs ().
Figure 6. Impaired neurite extension of primary cultured cortical neurons. (A) Representative pictures of primary cultured cortical neurons obtained from control littermates of each knockout mouse embryo (control), atg9a-, atg7- and atg16l1-conventional KO mouse embryos at E14.5. Each PCN was transfected with a GFP expression vector at 1 DIV and observed at 3 DIV. (B) Profiles of extending axons of PCNs obtained from each of control littermate embryos and atg9a-KO mouse embryos at E14.5. Each PCN was transfected with a GFP expression vector at 3 DIV and observed at 7 DIV. Scale bar: 50 μm. (C) Quantification of the longest neurites of PCNs in A. Results are expressed as mean ± SEM n = 20 to 74 neurons of each. * P < 0.05, ** P < 0.01, ns, not significant. Statistical analyses were performed using one-way analysis of variance (ANOVA) followed by the Tukey-Kramer post hoc test. (D) Western blot analyses of ATG9A in lysates of WT MEFs transfected with si-RNA probes (control and Atg9a [#1 to 3]). Immunostaining for actin is used for an internal control (left). Quantification of a protein band of ATG9A. Results are expressed as mean ± SEM. ** P < 0.01, (n = 3 for each) (right). Statistical analyses were performed using one-way analysis of variance (ANOVA) followed by the Tukey-Kramer post hoc test. (E) Representative pictures of primary cultured cortical neurons transfected with GFP expression vector and control or Atg9a si-RNA probe (control and Atg9a [#3]) obtained from WT embryos and atg7-conventional KO mouse embryos at E14.5. Each PCN was transfected at 1 DIV, and fixed, and measured at 4 DIV after immunostaining for GFP. (F) Quantification of the longest neurites of PCNs in E. Results are expressed as mean ± SEM n = 20 to 24 neurons of each. ** P < 0.01, ns, not significant. Statistical analyses were performed using one-way analysis of variance (ANOVA) followed by the Tukey-Kramer post hoc test.
![Figure 6. Impaired neurite extension of primary cultured cortical neurons. (A) Representative pictures of primary cultured cortical neurons obtained from control littermates of each knockout mouse embryo (control), atg9a-, atg7- and atg16l1-conventional KO mouse embryos at E14.5. Each PCN was transfected with a GFP expression vector at 1 DIV and observed at 3 DIV. (B) Profiles of extending axons of PCNs obtained from each of control littermate embryos and atg9a-KO mouse embryos at E14.5. Each PCN was transfected with a GFP expression vector at 3 DIV and observed at 7 DIV. Scale bar: 50 μm. (C) Quantification of the longest neurites of PCNs in A. Results are expressed as mean ± SEM n = 20 to 74 neurons of each. * P < 0.05, ** P < 0.01, ns, not significant. Statistical analyses were performed using one-way analysis of variance (ANOVA) followed by the Tukey-Kramer post hoc test. (D) Western blot analyses of ATG9A in lysates of WT MEFs transfected with si-RNA probes (control and Atg9a [#1 to 3]). Immunostaining for actin is used for an internal control (left). Quantification of a protein band of ATG9A. Results are expressed as mean ± SEM. ** P < 0.01, (n = 3 for each) (right). Statistical analyses were performed using one-way analysis of variance (ANOVA) followed by the Tukey-Kramer post hoc test. (E) Representative pictures of primary cultured cortical neurons transfected with GFP expression vector and control or Atg9a si-RNA probe (control and Atg9a [#3]) obtained from WT embryos and atg7-conventional KO mouse embryos at E14.5. Each PCN was transfected at 1 DIV, and fixed, and measured at 4 DIV after immunostaining for GFP. (F) Quantification of the longest neurites of PCNs in E. Results are expressed as mean ± SEM n = 20 to 24 neurons of each. ** P < 0.01, ns, not significant. Statistical analyses were performed using one-way analysis of variance (ANOVA) followed by the Tukey-Kramer post hoc test.](/cms/asset/87d93cf7-f7cf-4e27-8004-4633088ab2b3/kaup_a_1314897_f0006_oc.jpg)
To examine whether suppression of neurite elongations are attributed to the inhibition of autophagy or an ATG9A-proper role independent of autophagy, the neurite length of Atg9a-knockdown PCNs that were obtained from the cerebral cortex of atg7-KO mouse embryos at E14.5 was measured at 4 DIV. The suppression ratio of ATG9A expression by 3 kinds of siRNA probes was examined by using mouse embryonic fibroblasts (MEFs), and the ratio of each siRNA probe to the control siRNA probe was similar between each probes and about 40% (). One of these siRNA probes (Atg9a#1 to 3) was introduced to PCNs obtained from WT or atg7-KO mice at 1 DIV, and the length of the longest neurites was measured at 4 DIV. Similar to the result of atg9a-KO PCNs, the neurite outgrowth was impaired in Atg9a-knockdown PCNs (). Moreover, the length of the longest neurites was significantly shorter in Atg9a-knockdown PCNs than in WT and atg7-KO PCNs, both of which showed similar length (). These results suggest that roles of ATG9A are deeply associated not only with autophagy but also with neurite outgrowth independent of autophagy.
Discussion
atg9a-KO mice die within 24 h of birth because of impaired autophagy, or the mice are embryonic lethal.Citation19,20 The atg9a-KO mice used in the present study were backcrossed with C57B6J over several generations and all of backcrossed mice became embryonic lethal and died around E15. We therefore generated Atg9aF/F mice and produced its KO mice specifically in CNS tissue. Using these atg9a-CKO mice, we demonstrated the following 5 points: 1) The mice were born in the Mendelian ratio, but half of them died within one wk. They showed characteristics that included growth retardation, convulsion, and abnormal limb-clasping reflexes, which culminated in death until 4 wk of age. 2) Ubiquitin, SQSTM1 and NBR1 showed prolific accumulation in neurons by 2 wk of age, but these accumulating aggregates drastically decreased at 4 wk of age. 3) Contradictory alterations were detected in decreases of accumulated receptor proteins and severe degeneration of axons and their terminals at 4 wk of age. 4) Dysgenesis of nerve fiber tracts was detected both in the corpus callosum and anterior commissures in brains at P21 of atg9a-CKO mice, as evidenced by DTM imaging. 5) Primary cultured cerebral cortical neurons (PCNs) did not extend axons straight, but coiled in one spot on the culture dishes, while neurite outgrowth of atg7-KO PCNs were also impaired when Atg9a was knocked down by siRNA.
ATG7, ATG3, ATG5 and ATG16L1 are involved in the C-terminal lipidation of MAP1LC3, while the loss of each of these genes suppresses autophagy at the later or maturation stage of autophagosome formation, which causes a scarcity of amino acids that results in individual death within 24 h.Citation7-10 To further understand the precise roles of gene products of ATG7 and ATG5 in CNS tissue, CKO mice with deletion of the corresponding genes were specifically generated in CNS tissue and caused growth retardation.Citation13,15 Different from atg9a-CKO mice, these CKO-mice showed mild neurological phenotypes including a longer life span. Rb1cc1/Fip200, a mammalian ortholog of yeast ATG17, is involved in autophagosome formation at the initial stage by forming a complex with ULK1, ATG13 and ATG101 in mammalian cells.Citation32 rb1cc1-CKO mice have shown more severe phenotypes than those of atg5- or atg7-CKO mice and much similar phenotypes to those of atg9a-CKO mice. Although the life span of rb1cc1-CKO mice is longer than atg9a-CKO mice, neurological phenotypes are very similar. In particular, severe spongiform degeneration is discerned in the white matter of these 2 types of CKO mice, although large axon terminals with amorphous materials in atg9a-CKO mice were not detected in rb1cc-CKO mice.Citation30 These results indicate that like Rb1cc1, deletion of Atg9A in CNS tissue, that works in the upper stream of autophagosome formation will show neurological phenotypes that are more severe than those of Atg7 or Atg5, which are involved in autophagosome formation at a later or maturation stage. Although neurological phenotypes of atg9a-CKO mice were degenerative and similar to those of rb1cc1-CKO mice, those of atg9a-CKO mice were distinctly different from those of rb1cc1-CKO-mice in the following points; in atg9a-CKO brains, 1) massive neuronal cell death examined with TUNEL staining was not discerned in various brain regions at P15 and also at P28, and 2) dysgenesis of the corpus callosum and anterior commissure was detected. In particular, it remains largely unknown how impairment of nerve fiber connections affects severe degenerative changes in axons and their terminals of atg9a-CKO neurons.
Until recently, deletion of essential genes for autophagy resulted in accumulation of ubiquitin aggregates, which contained adaptor or receptor proteins for selective autophagy, SQSTM1 and NBR1. These proteins are used for indicators of autophagy defects that include not only starvation but also various pathological stresses such as neurodegenerative diseases and numerous other disorders.Citation11,33,34 SQSTM1 is known to accumulate progressively in neurons of CNS-specific CKO mice of various Atg's that work in either the early or late stages of autophagosome formation.Citation14,16 In the present study, SQSTM1 and NBR1 accumulated in atg9a-CKO neurons at 2 wk of age, but drastically decreased in them at 4 wk of age, as evidenced by analyses of immunostaining, electron microscopy and western blot. Since cell death occurred in a very small in number in atg9a-CKO mouse brains at P15 and also at P28 when examined with TUNEL staining, the decreases in these receptor proteins were not attributed to massive loss of neurons in atg9a-CKO brains after 2 wk of age. Moreover, ubiquitin was present in axons and their terminals of atg9a-CKO brains, but no aggregate was discerned in them when examined by immunocytochemistry and electron microscopy. Taken together, the fact that the amount of ubiquitin aggregates decreased in atg9a-CKO neuronal cell bodies after 2 wk of age indicates that the autophagic degradation pathway for ubiquitin, SQSTM1 and NBR1 may be executed, to some extent, in the perikaryal region of atg9a-CKO neurons after 2 wk of age. However, since SQSTM1 is also a target substrate of the ubiquitin proteasome pathway,Citation35 we cannot deny the possibility that the decrease in amounts of the receptor proteins is attributed to degradation by the proteasome. Moreover, it remains largely unknown whether a deep association of ER with ubiquitin aggregates, autophagosome-like structures, and positive puncta for MAP1LC3 that were colocalized with those for ubiquitin, SQSTM1 and NBR1 are correlated with the degradation processes of ubiquitin aggregates.
The present study showed contradictory results concerning the decreased accumulation of SQSTM1 and NBR1 in neuronal cell bodies and progressive degeneration of axons and their terminals. At some point, the defects in autophagy-related genes show the manifestations of phenotypes such as axonal degeneration and neuron death.Citation13,15,30,31 Deficiency of Atg5 or Atg7 induces axonal degeneration and accumulation of ubiquitin aggregates in the neurosoma, resulting in neuron death, as shown by positive TUNEL staining. In addition to spongiform axonal degeneration, the deletion of Rb1cc1 has induced the neuronal loss of Purkinje cells and granule cells. In that study, degenerative changes in the cytoplasm were detected in SQSTM1-positive inclusions and abnormal mitochondria in Purkinje cells. These studies indicate that degenerative changes occur in parallel in both cell bodies, and axons and their terminals. As stated above, clear-cut degenerative changes were not detected in neuronal cell bodies of atg9a-CKO mouse brains when analyzed with light and electron microscopy, and TUNEL staining. These findings were distinct from those of axons and their terminals, in which severe degeneration such as spongiosis and spheroids were discerned. From these results, it seems likely that severe axonal degeneration impairs neuronal function, leading to individual death. In other words, Atg9a deficiency caused axon-specific lesions.
Probst bundles that appear in embryonic brains with the agenesis of the corpus callosum were detected in the embryonic brains of atg9a-CKO mice at E18. Until recently, there has been no report of the dysgenesis of nerve fiber tracts such as the corpus callosum and anterior commissures due to a deficiency in autophagy-related genes. Different from autophagy-related genes, Mapk8ip3/JIP3- or Map1b-deficient mice show an agenesis of the corpus callosum and severe growth retardation.Citation36-38 It is, therefore, reasonable to assume that this phenotype of dysgenesis of the corpus callosum and anterior commissure is not the role of ATG9A concerning autophagosome formation. In fact, PCNs obtained from atg9a-KO mouse brains at E14.5 could not extend their axons straight and coiled them in one place, while neurite extension of atg7-KO PCNs were also impaired when Atg9a was knocked down by siRNA, indicating that the regulation of neurite outgrowth was independent of autophagy. Knockdown of ULK1/2, mammalian protein orthologs of yeast Atg1, in primary cultured dorsal ganglion neurons obtained from E12.5 mouse embryos causes impairment of axonal extension due to the suppression of the endocytosis of NGF.Citation39 Since no trophic factors were used for the culturing of PCNs, axonal extension of PCNs is not attributed to the endocytosis of trophic factors. Moreover, it remains unknown whether ATG9A-positive vesicles are essential for membrane traffic to supply membranes for extending axons. Further studies are required to understand the relationship between the impairment of axonal extension and the dysgenesis of the corpus callosum and anterior commissures.
Collectively, our present study demonstrated contradictory results concerning decreases in the accumulated receptor proteins in neuronal cell bodies and the severe degeneration of axons and their terminals at 4 wk of age. Although dysgenesis of the nerve fiber tracts may differ from the role of ATG9A in autophagosome formation, ATG9A plays an essential role in the maintenance of homeostasis in axons. That is, Atg9a deficiency causes axon-specific lesions.
Materials and methods
Animals
Atg9a targeting vector was constructed by flacking exons 6 to 7 of Atg9a by 2 loxP sequences. Atg9aFlox/Flox (Atg9aF/F) mice were crossed with Nes-Cre transgenic mice (Jackson Laboratories) to produce Atg9aF/F: Nes-Cre (atg9a-CKO) mice. Atg9aF/F mice were produced by homologous recombinants using the C57BL/6N ES cell line RENKA. Atg7Flox/Flox (Atg7F/F) mice were bred with Nes-Cre transgenic mice to produce Atg7F/F: Nes-Cre (atg7-CKO) mice, and Atg9a, Atg7 and Atg16l1 heterozygous knockout (KO) mice were intercrossed to produce atg9a-, atg7- and atg16l1-KO mice, as described previously.Citation7,8,19 All of these conventional KO mice were backcrossed onto a genetic background of C57BL6, and used in the present study.
The procedures involving animal care and sample preparation were approved by the Animal Experimental Committee of the Juntendo University Graduate School of Medicine, and were performed in accordance with the NIH guidelines and regulations and guidelines for the care and use of laboratory animals at the Juntendo University Graduate School of Medicine.
The present study used mice expressing Atg7F/+, Atg9a F/+ or Atg7F/F, Atg9a F/F without expressing Cre recombinase as floxed controls.
Genotype analyses by PCR
To determine the genotypes of these lines, genomic DNA was prepared from mice tails and analyzed by Thermal Cycler for polymerase chain reaction (C1000 Touch, BIO-RAD, CA, USA). The following primer sets were used for genotyping to distinguish between wild-type and Atg9a flox alleles. These primers amplify 404 bp and 554 bp fragments from wild-type and Atg9a flox allele, respectively.
Fw: 5′-GGATGATATGTATTCCTGAG −3′,
Rv: 5′-TCCTGACCTGCTGTTCCAGTTCAG-3′
Survival periods
Survival periods of atg9a-CKO mice, atg7-CKO mice and their littermate floxed control (for each of atg9a-CKO and atg7-CKO) mice were monitored until all of them died.
Rotarod performance test
Motor coordination of floxed control and atg9a-CKO mice was determined by a rotarod performance test, as reported previously with some modifications.Citation40 Briefly, the mice were placed on a rotating rod that was constantly accelerated to 50 r.p.m. for 5min, and the time spent on the rod was measured. If mice were stayed on the rod over 5 min, the time of 300 sec was recorded. Moreover, normal and abnormal movements or reflexes such as convulsion, locomotor ataxia, and limb clasping reflexes of floxed control and atg9a-CKO mice were recorded at P15 and also at P28 by movies (Movies S1–3).
Antibodies
The following antibodies were used in the present study: rabbit anti-ATG9A,Citation28 guinea pig anti-SQSTM1 (C-terminal; Progen, GP62-C), rabbit anti-SQSTM1 (MBL, PM045), mouse anti-NBR1 (Abcam, ab55474), rabbit anti-LC3A/B (Cell Signaling Technology, 4108), mouse anti-GOLGA2/GM130 (BD Biosciences, 610822), mouse anti-ACTB/ß-actin (Sigma-Aldrich, A5441), rabbit anti-ubiquitin (Dako, Z0450), mouse anti-ubiquitin (P4D1; Santa Cruz Biotechnology, sc-8017), mouse anti-GFAP (Sigma-Aldrich, G3893), rabbit anti-AIF1/Iba1 (Wako Pure Chemical Industries, 019–19741), goat anti-VGAT (Frontier Institute, VGAT-Go-Af620), goat anti-CALB/calbindin (Frontier Institute, Calbindin-Go-Af1040), rat anti-myelin basic protein (AbD Serotec, MCA409), mouse anti-NEFH/Neurofilament heavy (clone SMI31; BioLegend, 80163), rabbit anti-ATG7 (Cell Signaling Technology, 8558), and goat anti-GFP (Frontier Institute, GFP-Go-Af1480–1).
Sample preparations for biochemical analyses
Deeply anesthetized mice were transcardially perfused with solulact (Terumo, TP-AB05NR) for blood removal. The whole brains were rapidly dissected and frozen in liquid nitrogen, and stored at −80°C until used. Each brain was homogenized in 5-volumes of 1 × RIPA buffer (50 mM Tris-HCl pH 7.4, 150 mM NaCl, 1 mM EDTA, 0.1% SDS [Nacalai Tesque, 08933–05] and 1% NP40 [Nacalai Tesque, 23640–94]) with protease inhibitor cocktail (Nacalai Tesque, 25955) and phosphatase inhibitor cocktail (Nacalai Tesque, 07574–61). Homogenates were centrifuged at 15,000 g for 15 min at 4°C, and the resultant supernatants were collected. The protein concentrations were measured using the BCA protein assay system (Thermo Fisher Scientific, 23225).
Immunoblot analysis
Immunoblots were performed as described previously.Citation41 Equal amount of the lysates was subjected to SDS-PAGE, and transferred to a PVDF membrane (Immobilon-P; Millipore, IPVH07850) and then blocked with 5% nonfat dry milk in TBST (20mM Tris-HCl, pH 7.6 [Nacalai Tesque, 35434–21], 137 mM NaCl [Nacalai Tesque, 31320–05], 0.05% Tween 20 [Nacalai Tesque, 35624–15]) for 30 min at room temperature. Membranes were incubated with primary antibodies at 4°C overnight. After washing with TBST, the membranes were incubated with HRP-labeled secondary antibodies (Jackson ImmunoResearch, 111–035–144 [rabbit], 315–035–045 [mouse], 106–035–003 [guinea pig] and 305–035–003 [goat]) for 1 h at room temperature. Immunoreactivity was determined using an Enhanced Chemiluminescent kit (Millipore, WBKLS0500). The intensity of each protein band was scanned using a LAS-4000 scanner (Fuji Photo Film., Tokyo, Japan) and quantified using Multi Gauge V3.0 software (Fuji Photo Film).
Sampling procedures for morphological analyses
Sample preparation for light and electron microscopy was performed as described previously.Citation42 Deeply anesthetized mice were fixed by cardiac perfusion with 4% paraformaldehyde in 0.1 M phosphate buffer (0.1M NaH2PO4 [Nacalai Tesque, 31718–15], 0.1M Na2HPO4 [Nacalai Tesque, 31723–35], pH 7.4) for light microscopy. Tissues were postfixed with the same fixative for 2 h, and embedded in paraffin or OCT-compound (Tissue-Tek, 4583). For electron microscopy, deeply anesthetized mice were transcardially perfused with 2% glutaraldehyde (Nacalai Tesque, 17003–05), −2% paraformaldehyde (Millipore, 1.04005.1000) in 0.1 M phosphate buffer, and postfixed in the same fixative at 4°C overnight.
Immunohistochemistry for light microscopy
Deparaffinized or frozen sections, or cultured cells were immunostained according to a method described previously.Citation42 For immunofluorescence analyses, tissue sections were subjected to antigen retrieval using the microwave method (in 0.01M citrate buffer [Nacalai Tesque, 09109–85] for 10 min at 105°C). After blocking with TNB buffer (PerkinElmer, FP1012), sections were incubated with primary antibodies at 4°C overnight, followed by 1 h of incubation with fluorescently labeled secondary antibodies (Alexa Fluor 488-; Jackson ImmunoResearch, 706–545–148 [guinea pig], Molecular Probes, A-31573 [rabbit], A-21208 [rat], A-21202 [mouse], Cy3; Jackson ImmunoResearch, 711–165–152 [rabbit], 715–165–151 [mouse], 705–165–147 [goat], Cy5; Jackson ImmunoResearch, 715–175–151 [mouse]). Samples were viewed with a confocal laser scanning microscope (FV1000; Olympus., Tokyo, Japan) after counterstaining with 4′–6′-diamindino-2-phenylindole (DAPI; Invitrogen, D21490). For immunohistochemical analyses, the sections were treated with 0.3% H2O2 (Wako Pure Chemical Industries, 081–04215) in methanol for 20 min, and blocked with TNB buffer for 30 min, followed by incubation with primary antibodies at 4°C overnight. Then, sections were incubated with anti-rabbit (Vector laboratory, MP-7401), -mouse (Vector laboratory, MP-7422) or -goat (Vector laboratory, MP-7405) IgG secondary antibody reagent containing micropolymers coupled with either active peroxidase (ImmPRESS) or anti-guinea pig biotinylated secondary antibody (Vectastain ABC kit; Vector laboratory, PK-4007) for 1 h at room temperature. Staining for peroxidase was performed with 0.0125% 3,3′-diaminobenzidine tetrahydrochloride (DAB) (Wako Pure Chemical Industries, 34900903) and 0.003% H2O2 in 0.05 M Tris-HCl buffer (pH 7.6) for 5 min. Digital Images of immunostained sections were exposed using a standard light microscope (BX50 Olympus, Tokyo, Japan).
TUNEL staining
Paraffin or frozen sections of floxed control and atg9a-CKO brains were stained for TUNEL according to a modified method.Citation43 Briefly, the sections treated with proteinase K (Nacalai Tesque, 29442–85) were incubated with 150 U/ml terminal deoxynucleotidyl transferase (TdT; Promega, M1871) and 10 nmol/ml Biotin-16-UTP (Roche, 11093070910) in TdT buffer (100 mM sodium cacodylate, pH 7.0, 1 mM cobalt chloride, 50 g/ml gelatin) at 37°C for 1 h. They were further incubated with peroxidase-conjugated streptavidin (Vector Laboratories, SA-5014) for 20 min, while the DAB reaction was performed by the same manner as described above. Positively stained nuclei for TUNEL were counted in 8 fields under a light microscope at 400 x and the fields were randomly selected in each of the cerebral cortex, hippocampus and thalamus of the both floxed control and atg9a-CKO brains at P15 and also at P28. The number counted was averaged in each region of brains and calculated statistically using one-way analysis of variance (ANOVA) followed by the Tukey-Kramer post hoc test.
Transmission electron microscopy
Fixed samples for electron microscopy were postfixed with 1% OsO4 (Merck Millipore, 1.24505.0001) for 2 h, followed by dehydration with graded ethanol solutions and QY-1 (NISSHIN EM, 310–1), and embedded in Epon812 (TAAB, T026). Ultrathin sections were cut at 70 nm using an ultramicrotome (UC6 or 7; Leica Microsystems., Wetzlar, Germany), stained with 2% uranyl acetate for 30 min and lead citrate (1% lead acetate [TAAB, L021], 1% lead citrate [TAAB, L018], 1% lead nitrate [TAAB, L019], 2% sodium citrate [Wako Pure Chemical Industries, 191–01785]) for 4 min. They were then examined with an HT7700 electron microscope (Hitachi., Tokyo, Japan).
Cultures of primary cerebral cortical neurons and plasmid transfection
Primary cerebral cortical neurons were prepared from the cerebral cortex at E14.5, based on a method reported previously.Citation41 The transfection of GFP plasmids (pAcGFP-C1; Clontech, 632470) was performed using Lipofectamine 2000 (Invitrogen, 11668–019), while that of si-RNA probes was performed as described previously.Citation41 Briefly, PCNs and MEFs were transfected with nontargeting unlabeled si-RNA (Mission si-RNA Universal Negative Control; Sigma, SIC-001) or oligonucleotides targeting Atg9a (Sigma, Mm Atg9a 2192 [#1], 2194 [#2] and 2195 [#3]) using Lipofectamine RNAi-MAX™ (Invitrogen, 13778–150) according to the manufacturer's instructions. PCNs were transfected with these regents at 1 DIV, while at the next d, the medium was changed to the normal Neurobasal medium (Gibco, 21103–049), and then the PCNs were further cultured for 48 h (until 4 DIV). As stated above, at 3 or 4 DIV, the PCNs were fixed with 4% paraformaldehyde and stained for GFP. PCNs were randomly photographed in each sample and the longest neurite of over 20 PCNs in each sample was measured. The mean and standard errors of the mean were calculated using data from each sample.
Sampling procedures for MRI
Sample preparation for MRI was performed as described previously.Citation44,45 Deeply anesthetized mice were fixed by cardiac perfusion with 4% paraformaldehyde in 0.1 M phosphate buffer (pH 7.4), and brains were carefully dissected and postfixed in the same fixative for one wk at 4°C. Brains were then embedded in 1% agarose (Nacalai Tesque, 02468–95) for MRI. MRI images were acquired using a 7T animal MRI system (MRI system, Agilent Technologies Inc., CA, USA). Diffusion tensor tractography (DTT) was performed as described previously.Citation46 The FA threshold for tracking was set under 0.18, and the stop length was set at 160 steps. The bending angle of the tract was not allowed to exceed 45°.
Statistical analysis
Statistical analyses were performed using the Student t test or one-way analysis of variance (ANOVA) followed by the Tukey-Kramer post hoc test. The data were expressed as the mean ± standard error of the mean (SEM), and P-values <0.05 were considered statistically significant.
Abbreviations
| AC | = | anterior commissure |
| CALB | = | calbindin |
| CC | = | corpus callosum |
| CKO | = | conditional knockout |
| CNS | = | central nervous system |
| DCN | = | deep cerebellar nuclei |
| DIV | = | ds in vitro |
| DTM | = | diffusion tensor magnetic resonance |
| ER | = | endoplasmic reticulum |
| GFAP | = | glial fibrillary acid protein |
| GFP | = | green fluorescent protein |
| GOLGA2/GM130 | = | golgin A2 |
| HE | = | hematoxylin eosin |
| LV | = | lateral ventricle |
| MAPK8IP3/JIP3 | = | mitogen-activated protein kinase 8 interacting protein 3/JNK-interacting protein 3 |
| MAP1B | = | microtubule-associated protein 1B |
| MAP1LC3/LC3 | = | microtubule-associated protein 1 light chain 3 |
| NBR1 | = | neighbor of BRCA1 gene 1 |
| Pb | = | Probst bundle |
| PC | = | posterior commissure |
| PCN | = | primary cerebral cortical neuron |
| PtdIns3K | = | phosphatidylinositol 3-kinase |
| RB1CC1/Fip200 | = | RB1 inducible coiled-coil 1 |
| SLC32A1/VGAT | = | solute carrier family 32 member 1 |
| SQSTM1 | = | sequestosome 1 |
| TUNEL | = | TdT-mediated dUTP nick-end labeling |
| ULK1 | = | unc-51 like kinase 1 |
| WDR45/WIPI | = | WD repeat domain 45 |
| WM | = | white matter |
Disclosure of potential conflicts of interest
No potential conflicts of interest were disclosed.
KAUP_A_1310360_Supplementary_Materials.zip
Download Zip (87.9 MB)Acknowledgments
We thank Mr. Kouhei Tsuruta and Dr. Kouji Kamagata for the MRI analyses, and Dr. Manabu Abe, Dr. Meiko Kawamura and Ms. Rie Natsume for the generation and breeding of atg9a-conditional knockout (CKO) mice, and Ms. Ayaki Iyoda and Mr. Yoshimitsu Kobayashi for the genotyping of mutant mice and preparation of the tissue sections, respectively.
Additional information
Funding
Related Research Data
References
- Uchiyama Y, Shibata M, Koike M, Yoshimura K, Sasaki M. Autophagy-physiology and pathophysiology. Histochem Cell Biol 2008; 129:407-20; PMID:18320203; https://doi.org/10.1007/s00418-008-0406-y
- Mochida K, Oikawa Y, Kimura Y, Kirisako H, Hirano H, Ohsumi Y, Nakatogawa H. Receptor-mediated selective autophagy degrades the endoplasmic reticulum and the nucleus. Nature 2015; 522:359-62; PMID:26040717; https://doi.org/10.1038/nature14506
- Okamoto K. Organellophagy: eliminating cellular building blocks via selective autophagy. J Cell Biol 2014; 205:435-45; PMID:24862571; https://doi.org/10.1083/jcb.201402054
- Mizushima N, Levine B, Cuervo AM, Klionsky DJ. Autophagy fights disease through cellular self-digestion. Nature 2008; 451:1069-75; PMID:18305538; https://doi.org/10.1038/nature06639
- Khaminets A, Heinrich T, Mari M, Grumati P, Huebner AK, Akutsu M, Liebmann L, Stolz A, Nietzsche S, Koch N, et al. Regulation of endoplasmic reticulum turnover by selective autophagy. Nature 2015; 522:354-8; PMID:26040720; https://doi.org/10.1038/nature14498
- Nakatogawa H, Suzuki K, Kamada Y, Ohsumi Y. Dynamics and diversity in autophagy mechanisms: lessons from yeast. Nat Rev Mol Cell Biol 2009; 10:458-67; PMID:19491929; https://doi.org/10.1038/nrm2708
- Saitoh T, Fujita N, Jang MH, Uematsu S, Yang BG, Satoh T, Omori H, Noda T, Yamamoto N, Komatsu M, et al. Loss of the autophagy protein Atg16L1 enhances endotoxin-induced IL-1beta production. Nature 2008; 456:264-8; PMID:18849965; https://doi.org/10.1038/nature07383
- Komatsu M, Waguri S, Ueno T, Iwata J, Murata S, Tanida I, Ezaki J, Mizushima N, Ohsumi Y, Uchiyama Y, et al. Impairment of starvation-induced and constitutive autophagy in Atg7-deficient mice. J Cell Biol 2005; 169:425-34; PMID:15866887; https://doi.org/10.1083/jcb.200412022
- Sou YS, Waguri S, Iwata J, Ueno T, Fujimura T, Hara T, Sawada N, Yamada A, Mizushima N, Uchiyama Y, et al. The Atg8 conjugation system is indispensable for proper development of autophagic isolation membranes in mice. Mol Biol Cell 2008; 19:4762-75; PMID:18768753; https://doi.org/10.1091/mbc.E08-03-0309
- Kuma A, Hatano M, Matsui M, Yamamoto A, Nakaya H, Yoshimori T, Ohsumi Y, Tokuhisa T, Mizushima N. The role of autophagy during the early neonatal starvation period. Nature 2004; 432:1032-6; PMID:15525940; https://doi.org/10.1038/nature03029
- Komatsu M, Waguri S, Koike M, Sou YS, Ueno T, Hara T, Mizushima N, Iwata J, Ezaki J, Murata S, et al. Homeostatic levels of p62 control cytoplasmic inclusion body formation in autophagy-deficient mice. Cell 2007; 131:1149-63; PMID:18083104; https://doi.org/10.1016/j.cell.2007.10.035
- Birgisdottir Å, Lamark T, Johansen T. The LIR motif - crucial for selective autophagy. J Cell Sci 2013; 126:3237-47; PMID:23908376
- Komatsu M, Waguri S, Chiba T, Murata S, Iwata J, Tanida I, Ueno T, Koike M, Uchiyama Y, Kominami E, et al. Loss of autophagy in the central nervous system causes neurodegeneration in mice. Nature 2006; 441:880-4; PMID:16625205; https://doi.org/10.1038/nature04723
- Komatsu M, Wang QJ, Holstein GR, Friedrich VL, Iwata J, Kominami E, Chait BT, Tanaka K, Yue Z. Essential role for autophagy protein Atg7 in the maintenance of axonal homeostasis and the prevention of axonal degeneration. Proc Natl Acad Sci U S A 2007; 104:14489-94; PMID:17726112; https://doi.org/10.1073/pnas.0701311104
- Hara T, Nakamura K, Matsui M, Yamamoto A, Nakahara Y, Suzuki-Migishima R, Yokoyama M, Mishima K, Saito I, Okano H, et al. Suppression of basal autophagy in neural cells causes neurodegenerative disease in mice. Nature 2006; 441:885-9; PMID:16625204; https://doi.org/10.1038/nature04724
- Nishiyama J, Miura E, Mizushima N, Watanabe M, Yuzaki M. Aberrant membranes and double-membrane structures accumulate in the axons of Atg5-null Purkinje cells before neuronal death. Autophagy 2007; 3:591-6; PMID:17912025; https://doi.org/10.4161/auto.4964
- Yamamoto H, Kakuta S, Watanabe TM, Kitamura A, Sekito T, Kondo-Kakuta C, Ichikawa R, Kinjo M, Ohsumi Y. Atg9 vesicles are an important membrane source during early steps of autophagosome formation. J Cell Biol 2012; 198:219-33; PMID:22826123; https://doi.org/10.1083/jcb.201202061
- Yamada T, Carson AR, Caniggia I, Umebayashi K, Yoshimori T, Nakabayashi K, Scherer SW. Endothelial nitric-oxide synthase antisense (NOS3AS) gene encodes an autophagy-related protein (APG9-like2) highly expressed in trophoblast. J Biol Chem 2005; 280:18283-90; PMID:15755735; https://doi.org/10.1074/jbc.M413957200
- Saitoh T, Fujita N, Hayashi T, Takahara K, Satoh T, Lee H, Matsunaga K, Kageyama S, Omori H, Noda T, et al. Atg9a controls dsDNA-driven dynamic translocation of STING and the innate immune response. Proc Natl Acad Sci U S A 2009; 106:20842-6; PMID:19926846; https://doi.org/10.1073/pnas.0911267106
- Kojima T, Yamada T, Akaishi R, Furuta I, Saitoh T, Nakabayashi K, Nakayama KI, Nakayama K, Akira S, Minakami H. Role of the Atg9a gene in intrauterine growth and survival of fetal mice. Reprod Biol 2015; 15:131-8; PMID:26370455; https://doi.org/10.1016/j.repbio.2015.05.001
- Young AR, Chan EY, Hu XW, Köchl R, Crawshaw SG, High S, Hailey DW, Lippincott-Schwartz J, Tooze SA. Starvation and ULK1-dependent cycling of mammalian Atg9 between the TGN and endosomes. J Cell Sci 2006; 119:3888-900; PMID:16940348; https://doi.org/10.1242/jcs.03172
- Webber JL, Young AR, Tooze SA. Atg9 trafficking in Mammalian cells. Autophagy 2007; 3:54-6; PMID:17102588; https://doi.org/10.4161/auto.3419
- Longatti A, Tooze SA. Recycling endosomes contribute to autophagosome formation. Autophagy 2012; 8:1682-3; PMID:22874560; https://doi.org/10.4161/auto.21486
- Takahashi Y, Meyerkord CL, Hori T, Runkle K, Fox TE, Kester M, Loughran TP, Wang HG. Bif-1 regulates Atg9 trafficking by mediating the fission of Golgi membranes during autophagy. Autophagy 2011; 7:61-73; PMID:21068542; https://doi.org/10.4161/auto.7.1.14015
- Orsi A, Razi M, Dooley HC, Robinson D, Weston AE, Collinson LM, Tooze SA. Dynamic and transient interactions of Atg9 with autophagosomes, but not membrane integration, are required for autophagy. Mol Biol Cell 2012; 23:1860-73; PMID:22456507; https://doi.org/10.1091/mbc.E11-09-0746
- Suzuki SW, Yamamoto H, Oikawa Y, Kondo-Kakuta C, Kimura Y, Hirano H, Ohsumi Y. Atg13 HORMA domain recruits Atg9 vesicles during autophagosome formation. Proc Natl Acad Sci U S A 2015; 112:3350-5; PMID:25737544; https://doi.org/10.1073/pnas.1421092112
- Noda T, Kim J, Huang WP, Baba M, Tokunaga C, Ohsumi Y, Klionsky DJ. Apg9p/Cvt7p is an integral membrane protein required for transport vesicle formation in the Cvt and autophagy pathways. J Cell Biol 2000; 148:465-80; PMID:10662773; https://doi.org/10.1083/jcb.148.3.465
- Tamura H, Shibata M, Koike M, Sasaki M, Uchiyama Y. Atg9A protein, an autophagy-related membrane protein, is localized in the neurons of mouse brains. J Histochem Cytochem 2010; 58:443-53; PMID:20124090; https://doi.org/10.1369/jhc.2010.955690
- Yue Z, Wang QJ, Komatsu M. Neuronal autophagy: going the distance to the axon. Autophagy 2008; 4:94-6; PMID:18000396; https://doi.org/10.4161/auto.5202
- Liang CC, Wang C, Peng X, Gan B, Guan JL. Neural-specific deletion of FIP200 leads to cerebellar degeneration caused by increased neuronal death and axon degeneration. J Biol Chem 2010; 285:3499-509; PMID:19940130; https://doi.org/10.1074/jbc.M109.072389
- Zhao YG, Sun L, Miao G, Ji C, Zhao H, Sun H, Miao L, Yoshii SR, Mizushima N, Wang X, et al. The autophagy gene Wdr45/Wipi4 regulates learning and memory function and axonal homeostasis. Autophagy 2015; 11:881-90; PMID:26000824; https://doi.org/10.1080/15548627.2015.1047127
- Hosokawa N, Hara T, Kaizuka T, Kishi C, Takamura A, Miura Y, Iemura S, Natsume T, Takehana K, Yamada N, et al. Nutrient-dependent mTORC1 association with the ULK1-Atg13-FIP200 complex required for autophagy. Mol Biol Cell 2009; 20:1981-91; PMID:19211835; https://doi.org/10.1091/mbc.E08-12-1248
- Bjørkøy G, Lamark T, Brech A, Outzen H, Perander M, Overvatn A, Stenmark H, Johansen T. p62/SQSTM1 forms protein aggregates degraded by autophagy and has a protective effect on huntingtin-induced cell death. J Cell Biol 2005; 171:603-14; PMID:16286508; https://doi.org/10.1083/jcb.200507002
- Kirkin V, Lamark T, Sou YS, Bjørkøy G, Nunn JL, Bruun JA, Shvets E, McEwan DG, Clausen TH, Wild P, et al. A role for NBR1 in autophagosomal degradation of ubiquitinated substrates. Mol Cell 2009; 33:505-16; PMID:19250911; https://doi.org/10.1016/j.molcel.2009.01.020
- Seibenhener ML, Babu JR, Geetha T, Wong HC, Krishna NR, Wooten MW. Sequestosome 1/p62 is a polyubiquitin chain binding protein involved in ubiquitin proteasome degradation. Mol Cell Biol 2004; 24:8055-68; PMID:15340068; https://doi.org/10.1128/MCB.24.18.8055-8068.2004
- Meixner A, Haverkamp S, Wässle H, Führer S, Thalhammer J, Kropf N, Bittner RE, Lassmann H, Wiche G, Propst F. MAP1B is required for axon guidance and Is involved in the development of the central and peripheral nervous system. J Cell Biol 2000; 151:1169-78; PMID:11121433; https://doi.org/10.1083/jcb.151.6.1169
- Kelkar N, Delmotte MH, Weston CR, Barrett T, Sheppard BJ, Flavell RA, Davis RJ. Morphogenesis of the telencephalic commissure requires scaffold protein JNK-interacting protein 3 (JIP3). Proc Natl Acad Sci U S A 2003; 100:9843-8; PMID:12897243; https://doi.org/10.1073/pnas.1733944100
- Ha HY, Cho IH, Lee KW, Song JY, Kim KS, Yu YM, Lee JK, Song JS, Yang SD, Shin HS, et al. The axon guidance defect of the telencephalic commissures of the JSAP1-deficient brain was partially rescued by the transgenic expression of JIP1. Dev Biol 2005; 277:184-99; PMID:15572149; https://doi.org/10.1016/j.ydbio.2004.09.019
- Zhou X, Babu JR, da Silva S, Shu Q, Graef IA, Oliver T, Tomoda T, Tani T, Wooten MW, Wang F. Unc-51-like kinase 1/2-mediated endocytic processes regulate filopodia extension and branching of sensory axons. Proc Natl Acad Sci U S A 2007; 104:5842-7; PMID:17389358; https://doi.org/10.1073/pnas.0701402104
- Oyama G, Yoshimi K, Natori S, Chikaoka Y, Ren YR, Funayama M, Shimo Y, Takahashi R, Nakazato T, Kitazawa S, et al. Impaired in vivo dopamine release in parkin knockout mice. Brain Res 2010; 1352:214-22; PMID:20620130; https://doi.org/10.1016/j.brainres.2010.06.065
- Nanao T, Koike M, Yamaguchi J, Sasaki M, Uchiyama Y. Cellular localization and tissue distribution of endogenous DFCP1 protein. Biomed Res 2015; 36:121-33; PMID:25876663; https://doi.org/10.2220/biomedres.36.121
- Koike M, Shibata M, Tadakoshi M, Gotoh K, Komatsu M, Waguri S, Kawahara N, Kuida K, Nagata S, Kominami E, et al. Inhibition of autophagy prevents hippocampal pyramidal neuron death after hypoxic-ischemic injury. Am J Pathol 2008; 172:454-69; PMID:18187572; https://doi.org/10.2353/ajpath.2008.070876
- Nitatori T, Sato N, Waguri S, Karasawa Y, Araki H, Shibanai K, Kominami E, Uchiyama Y. Delayed neuronal death in the CA1 pyramidal cell layer of the gerbil hippocampus following transient ischemia is apoptosis. J Neurosci 1995; 15:1001-11; PMID:7869078
- Kamagata K, Hatano T, Okuzumi A, Motoi Y, Abe O, Shimoji K, Kamiya K, Suzuki M, Hori M, Kumamaru KK, et al. Neurite orientation dispersion and density imaging in the substantia nigra in idiopathic Parkinson disease. Eur Radiol 2015; 26(8):2567-77
- Kerever A, Kamagata K, Yokosawa S, Otake Y, Ochi H, Yamada T, Hori M, Kamiya K, Nishikori A, Aoki S, et al. See-through Brains and Diffusion Tensor MRI Clarified Fiber Connections: A Preliminary Microstructural Study in a Mouse with Callosal Agenesis. Magn Reson Med Sci 2015; 14:159-62; PMID:25833270; https://doi.org/10.2463/mrms.2014-0142
- Mori Y, Shiota T, Jones M, Wanitkun S, Irvine T, Li X, Delabays A, Pandian NG, Sahn DJ. Three-dimensional reconstruction of the color Doppler-imaged vena contracta for quantifying aortic regurgitation: studies in a chronic animal model. Circulation 1999; 99:1611-7; PMID:10096939; https://doi.org/10.1161/01.CIR.99.12.1611