
ABSTRACT
Oxidative stress activates macroautophagy/autophagy and contributes to atherogenesis via lipophagic flux, a form of lipid removal by autophagy. However, it is not known exactly how endogenous antioxidant enzymes are involved in lipophagic flux. Here, we demonstrate that the antioxidant PRDX1 (peroxiredoxin 1) has a crucial role in the maintenance of lipophagic flux in macrophages. PRDX1 is more highly expressed than other antioxidant enzymes in monocytes and macrophages. We determined that Prdx1 deficiency induced excessive oxidative stress and impaired maintenance of autophagic flux in macrophages. Prdx1-deficient macrophages had higher intracellular cholesterol mass and lower cholesterol efflux compared with wild type. This perturbation in cholesterol homeostasis was due to impaired lipophagic cholesterol hydrolysis caused by excessive oxidative stress, resulting in the inhibition of free cholesterol formation and the reduction of NR1H3 (nuclear receptor subfamily 1, group H, member 3) activity. Notably, impairment of both lipophagic flux and cholesterol efflux was restored by the 2-Cys PRDX-mimics ebselen and gliotoxin. Consistent with this observation, apoe −/− mice transplanted with bone marrow from prdx1−/−apoe−/− mice had increased plaque formation compared with apoe−/− BM-transplanted recipients. This study reveals that PRDX1 is crucial to regulating lipophagic flux and maintaining macrophage cholesterol homeostasis against oxidative stress. We suggest that PRDX1-dependent control of oxidative stress may provide a strategy for treating atherosclerosis and autophagy-related human diseases.
Introduction
Autophagy is a catabolic pathway that uses the lysosomal apparatus for degradation or recycling of cytoplasmic organelles and aggregated proteins.Citation1,2 Recent reports have revealed that acquired defects in autophagy exacerbate atherosclerosis, which suggests an anti-atherogenic function of autophagy.Citation3,4 In particular, lipophagy, the autophagic removal of lipids, contributes to macrophage cholesterol efflux and is closely linked to atherosclerosis.Citation5 Autophagy is highly inducible and can be triggered by environmental stressors, including oxidative stress caused by reactive oxygen species (ROS).Citation6 In addition to causing cell damage and death, ROS mediate diverse cellular signaling pathways.Citation7,8 As a secondary messenger, hydrogen peroxide (H2O2) controls normal physiology and disease progression on the cellular and organ levels in cancer, neurodegenerative diseases, and cardiovascular diseases.Citation9,10 Thus, oxidative stress induces autophagy and concurrently regulates intracellular signaling by reversibly oxidizing essential signaling components.Citation11,12 To regulate the concentration of ROS, cells and tissues have developed enzymatic systems including peroxiredoxins (PRDXs). However, whether an antioxidant enzyme can contribute to ROS stress-induced autophagic flux in the pathogenesis of atherosclerosis has not been studied yet.
PRDXs are a family of small, antioxidant proteins that constitute a potent defense system for maintaining redox balance by converting hydrogen peroxide to water.Citation13 The 6 mammalian PRDXs (PRDX1 to PRDX6) are distributed in intracellular compartments and are abundantly expressed.Citation14 PRDX1 is expressed in the cytosol of cells and was first identified as a 23-kDa stress-induced macrophage protein produced in murine peritoneal macrophages exposed to oxidative stress.Citation15,16 Prdx1-deficient mice show an increased frequency of multiple malignant cancers.Citation17 One report has suggested that laminar shear stress induces PRDX1 upregulation in endothelial cells.Citation18 Moreover, PRDX1 protects against chronic inflammation and atherosclerosis by protecting against excessive endothelial activation.Citation19 Our previous study demonstrates that Prdx2 deficiency exacerbates atherosclerosis by activation of cellular adhesion molecules on the endothelial cells.Citation20 In this study, we confirmed that Prdx1 is predominantly expressed and plays an important role in monocytes/macrophages.
Macrophages play an essential role throughout the entire pathogenesis of atherosclerosis.Citation21 Macrophage foam cell formation caused by uncontrolled cholesterol efflux is a typical marker of atherosclerosis. Recent studies have revealed that a novel pathway involving autophagy regulation in macrophages contributes to atherosclerosis.Citation22,23 Therefore, we focused on identifying the specific antioxidant enzyme responsible for modulating autophagy as part of in vivo atherosclerotic signaling pathways in macrophages. Here, we report that the ROS scavenger PRDX1 is strongly expressed, in murine peritoneal macrophages exposed to oxidative stress. We found that Prdx1 deficiency in macrophages led to increased susceptibility to oxidative stress and suppressed the clearance of modified LDL as a result of impaired lipophagic flux, thereby promoting atherosclerosis in apoe−/− mice. In addition, PRDX1 mimetics could rescue the impaired lipophagic efflux induced by excessive oxidative stress. Our data reveal a novel relationship of lipophagic flux and atherosclerosis by PRDX1 that controls the regulation of H2O2 following lipid stimulation in macrophages.
Results
Prdx1 deficiency causes defective autophagic flux in macrophages
To investigate the role of antioxidant enzymes in the autophagic pathways of macrophages, we first compared the expression levels of the genes encoding various antioxidant enzymes, including Prdx1, Gpx1 (glutathione peroxidase 1), and Cat (catalase), in primary peritoneal macrophages. At the mRNA level, Prdx1 was more highly expressed than other antioxidant enzymes in macrophages (), and PRDX1 protein expression was higher in macrophages than in other cell types involved in atherosclerosis, namely endothelial and smooth muscle cells, or in whole tissues (). Moreover, Prdx1 was expressed at higher levels in myeloid cells than in other immune cells (Fig. S1 with ImmGen database).Citation24
Figure 1. Prdx1 deficiency causes defective autophagic flux in macrophages. (A) Quantitative real-time PCR was performed to quantify mRNA levels of various antioxidant enzymes in primary peritoneal macrophages from C57BL/6J mice (n = 10). Data are normalized to Actb expression. (B) Immunoblots probing for the PRDX1 to PRDX4 protein were performed on protein lysates from mouse aortic endothelial cells (MAEC), peritoneal macrophages (Mφ), bone marrow-derived macrophages (BMDM), vascular smooth muscle cells (VSMC), aortic tissue, and heart tissue from C57BL/6J mice (n = 5). Lysates (15 μg) and indicated amounts of recombinant PRDX1 were loaded onto SDS-PAGE gels. (C) Fluorescence confocal microscopy images of CM-H2DCFDA-stained H2O2 expression in oxLDL-stimulated Mφs. Peritoneal Mφs were isolated from Prdx1+/+ and prdx1−/− mice (n = 3 per group), incubated with or without 50 μg/ml oxLDL for 30 min, and stained with CM-H2DCFDA. Quantitative data in the graph represent relative mean fluorescence intensity (MFI). Scale bar: 100 μm. (D) Fluorescence confocal microscopy images of CM-H2DCFDA-stained H2O2 expression in oxLDL-stimulated GFPtg-LC3 prdx1−/− Mφs. GFPtg-LC3 prdx1−/− Mφs were treated with PRDX1-expressing adenovirus (Ad-PRDX1) or control (Ad-con), incubated with or without 50 μg/ml oxLDL, and stained with CM-H2DCFDA (1μM). Scale bar: 10 μm. (E) Fluorescence confocal microscopy images of GFP-LC3. Mφs were isolated from mice of the indicated genotype (n = 3 per group) and incubated with or without 50 μg/ml oxLDL for 30 min. Green fluorescence indicates LC3 expression in Mφ. Quantitative data in the graph represent MFI. Scale bar: 10 μm. (F) Fluorescence confocal microscopy images of GFP-LC3 in GFPtg-LC3 prdx1−/− Mφ-treated Ad-PRDX1 or Ad-con. Scale bar: 10 μm. (G) Immunoblot analysis of autophagy proteins in Mφ from Prdx1+/+ or prdx1−/− mice incubated with or without 50 μg/ml oxLDL. Quantitative data represent the fold-change after normalizing protein band intensity to GAPDH. (H) Immunoblot analysis of autophagy proteins in prdx1−/− Mφ treated as in (F). Quantitative data represent the fold change after normalizing protein band intensity to GAPDH. (I) Mφ from Prdx1+/+ or prdx1−/− mice treated with Ad-mCherry-GFP-LC3. Cells were fixed and analyzed by immunofluorescence microscopy. Scale bar: 5 μm. Quantitative data represent the percentages of (mCherry+ GFP−) dots/total (mCherry+ GFP+) dots (n > 20 cells from 3 independent experiments). **, P < 0.01. Each experiment was performed 3 times, and all graphs are representative of 3 separate experiments. *P < 0.05, P < 0.01, ***P < 0.001, by the Mann-Whitney test. Data represent the mean ± SEM.
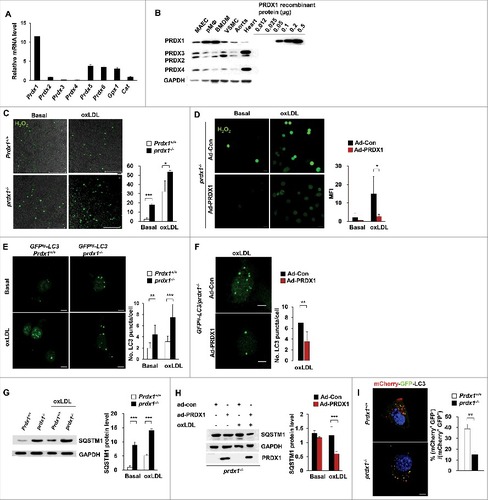
To test the hypothesis that Prdx1 is crucial to the regulation of oxidative stress in macrophages, we measured the intracellular H2O2 level in peritoneal macrophages from wild-type and prdx1−/− mice, both with or without oxidized LDL (oxLDL), which mediates pro-inflammatory signals in atherosclerosis. As expected, prdx1−/− peritoneal macrophages had higher levels of cellular H2O2 than did wild-type macrophages under both basal and inflammatory conditions (as described in [CM-H2DCFDA] and Fig. S2 [Peroxy Orange 1]). To test whether restoration of PRDX1 could ameliorate the H2O2 level, we treated prdx1−/− macrophages with either PRDX1-expressing (Ad-PRDX1) or control adenoviruses (Ad-control) and verified the activity of Ad-PRDX1 in the prdx1−/− macrophages (Fig. S3). Treatment with Ad-PRDX1, but not Ad-control, reduced the cellular H2O2 level in the prdx1−/− macrophages under both basal and oxLDL-treated conditions. These results indicate that PRDX1 is critically involved in the elimination of H2O2 from pro-atherogenic macrophages ().
To verify the effect of excessive H2O2 on autophagic flux in macrophages, autophagy pathways were monitored in Prdx1-deficient macrophages. Peritoneal macrophages were isolated from 2 groups of mice carrying the gene for the green fluorescent protein (GFP)- MAP1LC3B/LC3B (microtubule-associated protein 1 light chain 3 β), both with and without the Prdx1 gene, and assayed for the puncta of GFP-LC3 during the early stages of autophagy. Compared to the control, Prdx1-deficient macrophages displayed a more punctate pattern of fluorescence under both the glucose-starved and oxLDL-treated conditions (). Also, treatment with Ad-PRDX1 reduced the puncta of GFP-LC3 in GFPtg-LC3 prdx1−/− peritoneal macrophages under oxLDL-treated conditions ().
To analyze quantitative differences in autophagic flux in Prdx1 deficiency, we measured autophagy-related protein levels in Prdx1-deficient macrophages. SQSTM1/p62 (sequestosome 1), which shuttles intracellular protein aggregates into phagophores (the precursors to autophagosomes) for degradation, is also a useful marker of autophagic status.Citation25-Citation27 Therefore, we assessed levels of SQSTM1 in wild-type and prdx1−/− murine peritoneal macrophages that were incubated with or without oxLDL. Surprisingly, SQSTM1 protein levels were significantly increased in Prdx1-deficient macrophages under oxLDL-treated conditions compared with wild-type macrophages (). Furthermore, treatment with Ad-PRDX1 rescued the level of SQSTM1 protein in prdx1−/− murine peritoneal macrophages under oxLDL-treated conditions (). The process of autophagic flux is inversely correlated with SQSTM1 level, such that defective autophagic flux is accompanied by accumulation of SQSTM1 protein. To further verify that Prdx1 deficiency impairs autophagic flux, we used mCherry-GFP tandem fluorescent-tagged LC3 adenovirus.Citation28,29 mCherry+ GFP+-LC3 dots represent autophagosomes or their precursors, whereas mCherry+ GFP− dots indicate autolysosomes, because GFP fluorescence is attenuated by lysosomal acidic pH and hydrolases in autolysosomes. In Prdx1-deficient macrophages, the percentage of autolysosomes (mCherry+ GFP−-LC3 dots) to that of autophagosomes (mCherry+ GFP+-LC3 dots) obviously decreased (), confirming that autophagic flux was hampered by Prdx1 deficiency. Collectively, these data provide evidence that Prdx1 deficiency increases the production of excessive oxidative stress and impairs the later stage of autophagic flux in macrophages.
Prdx1 deficiency inhibits acidic cholesterol lipolysis in macrophages
Lipophagy, a type of autophagy, is an important acidic cholesterol hydrolysis pathway by which cytoplasmic lipid droplet (LD)-associated cholesteryl ester (CE) is delivered to lysosomes.Citation5,30 Inhibition of cholesterol hydrolysis promotes excessive CE accumulation in macrophages, thereby resulting in the formation of foam cells. Therefore, we hypothesized that oxidative stress resulting from Prdx1 deficiency can inhibit autophagic cholesterol hydrolysis in macrophages. To test the cholesterol efflux capacity of macrophages, we first measured the mass of both total cholesterol and CE in wild-type and Prdx1-deficient murine peritoneal macrophages. Lipid-loaded macrophages were incubated with APOA1 in the presence of modified LDL, and then an ACAT (acetyl-Coenzyme A acetyltransferase) inhibitor (ACATi) was added to prevent the re-esterification of hydrolyzed CE.Citation31 We found significant increases in total cholesterol and CE mass in Prdx1-deficient macrophages relative to wild-type cells (). Furthermore, the ratio of cholesterol hydrolysis in Prdx1-deficient macrophages was lower than in wild-type macrophages (). Next, we evaluated which CE hydrolysis pathway was suppressed in Prdx1-deficient macrophages using pathway-specific pharmacological inhibitors. Paraoxon (which inhibits neutral hydrolysis)Citation32 led to an increase in CE mass in both wild-type and Prdx1-deficient macrophages, whereas chloroquine (which inhibits acidic hydrolysis) increased the CE mass in wild-type, but not in Prdx1-deficient, macrophages (). Collectively, these results indicate that Prdx1-deficient macrophages are unable to hydrolyze cholesterol as efficiently as wild-type macrophages due to impaired acidic CE hydrolysis.
Figure 2. Prdx1 deficiency inhibits acidic cholesterol lipolysis in macrophages. (A) Following incubation with oxLDL (50 μg/ml) for 30 h, the levels of total cholesterol and cholesteryl ester (CE) were measured in peritoneal Mφs using a cholesterol quantification kit. Variations in cholesterol are expressed as fold change relative to the control. (B) CE hydrolysis was calculated as follows: % hydrolysis = (CEi – CEf)/(CEi)*100, where CEi represents the CE mass immediately after oxLDL loading, and CEf represents the CE mass after the cells were incubated for 30 h. (C) Peritoneal Mφs were incubated with oxLDL for 30 h, and CE content was determined in the presence or absence of the indicated reagents (100 μM paraoxon, 30 μM chloroquine). (D) Isolated peritoneal Mφs from the indicated mice were treated with oxLDL for 6 h. Nuclear and cytoplasmic extracts were prepared, and NR1H3 was detected by immunoblotting. Quantitative data of nuclear NR1H3 represent the fold change after normalizing protein band intensity to LMNB (lamin B). (E) mRNA levels of Abca1 and Abcg1 in Prdx1+/+ and prdx1−/− murine peritoneal Mφs after treatment with modified LDL (50 μg/ml), as determined by quantitative real-time PCR. (F) Isolated Mφs were incubated for 30 h in media containing modified LDL (50 μg/mL) with 3H-cholesterol (5 μCi/mL), and cholesterol efflux was determined in the presence of human recombinant APOA1 (10 μg/mL) or mouse serum (2%) for 6 h. Efflux is expressed as a percentage of 3H-cholesterol in medium to 3H-cholesterol in medium+3H-cholesterol in cells. P < 0.05, **P < 0.01, and ***P < 0.001, by the Mann-Whitney test. All experiments were performed 3 times, and all graphs are representative of 3 separate experiments (A, B, C and D, n = 15 per group; E and F, n = 10 per group). Data represent the mean ± SEM.
NR1H3 (nuclear receptor subfamily 1, group H, member 3) is an important regulator of cholesterol and fatty acid metabolism in macrophages.Citation33 Macrophage uptake of oxLDL leads to increased cellular concentrations of oxysterols generated from free cholesterol, the physiological ligand of NR1H3.Citation34 Oxysterols activate NR1H3-RXR (retinoid X receptor) heterodimers, resulting in increased transcription of target genes,Citation35 including those encoding APOE, ABCA1 [ATP-binding cassette, sub-family G [ABC1], member 1), and ABCG1 (ATP-binding cassette, sub-family G [WHITE], member 1). Therefore, we examined the activation of NR1H3 and its target genes in wild-type and Prdx1-deficient macrophages. Nuclear NR1H3 was increased with oxLDL in wild-type control macrophages. However, the nuclear translocation of NR1H3 was reduced in both the basal and oxLDL-treated Prdx1-deficient macrophages (). Furthermore, we observed significantly lower mRNA expression of Nr1h3 targets, such as Abca1 and Abcg1, in Prdx1-deficient macrophages than in wild-type macrophages after treatment with modified LDL (). ABC transporters have recently been reported to play a role in regulating the efflux of cellular cholesterol and phospholipids to specific lipid acceptors (e.g., HDL or APOA1) in the media.Citation36,37 We next analyzed the cholesterol efflux from wild-type and prdx1−/− macrophages preloaded with [3H]-cholesterol using APOA1 or mouse serum as a carrier. Cholesterol efflux was significantly reduced in macrophages from prdx1−/− mice using both carriers (). These results suggest that PRDX1 plays a pivotal role in cholesterol efflux in macrophages.
2-Cys PRDX-mimics rescue impaired lipophagic flux and cholesterol efflux in macrophages
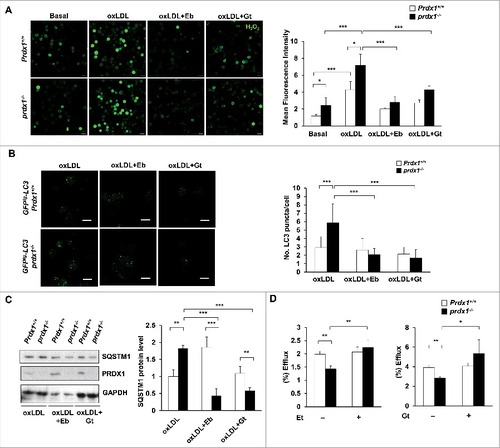
The antioxidant ebselen (Eb) and the immunosuppressive mycotoxin gliotoxin (Gt) are both capable of counteracting hydrogen peroxide by mimicking antioxidant protein activity.Citation38,39 We used these synthetic antioxidants to ascertain whether normalizing the endogenous H2O2 level could rescue impaired lipophagy in Prdx1-deficient macrophages. Measurement of intracellular H2O2 level () and GFP-LC3 fluorescence analysis revealed that Eb and Gt potently reduced H2O2 level and decreased the puncta number of GFP-LC3 and the subsequent activation of GFP-LC3 fluorescence in Prdx1-deficient macrophages induced by oxLDL (). Furthermore, immunoblot analysis revealed that Eb and Gt also suppressed SQSTM1 accumulation in oxLDL-treated Prdx1-deficient macrophages (). Importantly, incubation of macrophages with Eb and Gt effectively recovered cholesterol efflux in prdx1−/− macrophages (). Collectively, these results confirm that the impaired lipophagic flux in Prdx1-deficient macrophages is associated with the increase in oxidative stress.
Figure 3. 2-Cys PRDX-mimics rescue impaired lipophagic flux and cholesterol efflux in macrophages. (A) Fluorescence confocal microscopy images of CM-H2DCFDA-stained H2O2 expression in oxLDL-stimulated Mφs. Peritoneal Mφs were isolated from Prdx1+/+ and prdx1−/− mice, pretreated with 10 μM ebselen (Eb) or 20 nM gliotoxin (Gt) for 1 h, incubated with or without 50 μg/ml oxLDL for 30 min, and stained with 5 μM CM-H2DCFDA (n = 3 per group). Quantitative data in the graph represent relative mean fluorescence intensity (MFI). Scale bar: 10 μm. (B) Mφs were isolated from mice of the indicated genotype (n = 3 per group) and treated as in (A). Green fluorescence indicates LC3 expression in Mφs. Quantitative data in the graph represent MFI. Scale bar: 10 μm. (C) Immunoblot analysis of SQSTM1 in Mφs from Prdx1+/+ or prdx1−/− mice, treated as in (A). Quantitative data represent the fold change after normalizing SQSTM1 band intensity to GAPDH. (D) Cholesterol efflux was measured in macrophages that were incubated in media containing oxLDL with 3H-cholesterol (5 μCi/mL) for 30 h and then pretreated with Eb (10 μM) or Gt (20 nM) for 1 h in the presence of APOA1 (10 μg/mL). *P < 0.05, **P < 0.01, and ***P < 0.001, by the Mann-Whitney test. Each experiment was performed 3 times, and all graphs are representative of 3 separate experiments. Data represent the mean ± SEM.
Prdx1 deficiency increases macrophage foam cells in atherosclerotic plaques
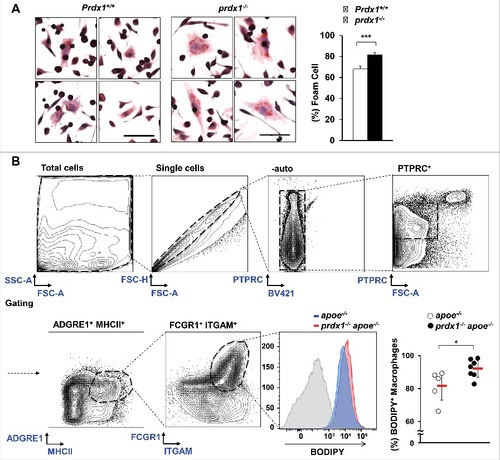
To elucidate whether the impaired lipophagic flux caused by oxidative stress in Prdx1-deficient macrophages affects macrophage function, we first examined the lipoprotein uptake ability of macrophages. Peritoneal macrophages were isolated from wild-type and prdx1−/− mice, incubated with oxLDL, and then stained with Oil Red O solution. We found that Prdx1-deficient macrophages uptake more oxLDL and increase storage of neutral lipids within the cell compared with wild-type macrophages (). Therefore, we decided to examine whether Prdx1 deficiency affects foam cell formation using macrophages isolated from atherosclerotic plaques. First, apoe−/− and prdx1−/−apoe−/− mice were fed a high-fat diet for 10 wk, and then their aortas were isolated and dissociated with an enzyme mixture. Next, aortic cells were incubated with BODIPY (a commonly used fluorescent neutral-lipid dye) and stained with various immune cell-specific antibodies to identify macrophage foam cells. Flow cytometry analysis showed that aortic macrophage foam cell number and percentage were higher in prdx1−/−apoe−/− mice than in apoe−/− mice (). These results indicate that Prdx1-deficiency contributes to macrophage foam cell formation.
Figure 4. Prdx1 deficiency increases foam cell formation. (A) Comparison of in vitro foam cells from peritoneal Mφs from Prdx1+/+ and prdx1−/− mice in response to 50 μg/ml oxLDL (n = 3 per group). Mφs were stained with Oil Red O solution, and the percentage of foam cells was calculated in total cells in the field. Scale bar: 50 μm. (B) Flow cytometry of foam cells isolated from whole aortas (from the aortic sinus to the femoral aorta) from apoe−/− and prdx1−/−apoe−/− mice fed an atherogenic diet for 10 wk (n = 5 per group). Aortic macrophages were isolated from apoe−/− and prdx1−/−apoe−/− mice following incubation with 10 μg/ml BODIPY. Staining with an isotype control Ab is shown (gray histogram). Quantitative data represent percentage of BODIPY+ macrophages per PTPRC/CD45+ cells. *P < 0.05, ***P < 0.001, by the Mann-Whitney test. Each experiment was performed 3 times, and all graphs are representative of 3 separate experiments. Data represent the mean ± SEM.
Prdx1 deficiency induces lipophagy dysfunction in atherosclerotic plaques
Expanding on previous observations,Citation19 atherosclerotic plaque formation was increased in prdx1−/−apoe−/− mice compared with their apoe−/− counterparts when fed either a high-fat diet (Fig. S4A and S4B) or a normal chow diet (Fig. S4C and S4D). Also, immunofluorescent staining showed a significant increase in macrophage infiltration in prdx1−/−apoe−/− mice compared with apoe−/− mice (Fig. S4E).
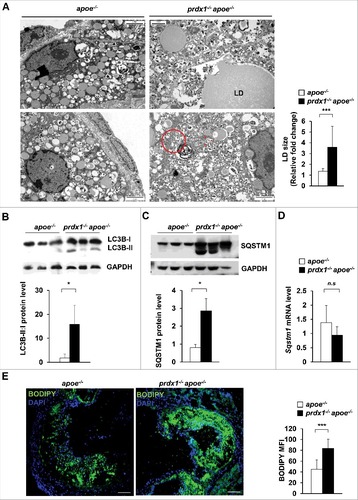
To assess the efficacy of the lipophagic process, we analyzed the lipids within lipophagic vacuoles in atherosclerotic aortic macrophages from apoe−/− mice and prdx1−/−apoe−/− mice using electron microscopy. Micrographs of atherosclerotic aortas from prdx1−/−apoe−/− mice showed an increased size of lipid-containing vesicles (LD) and the destruction of macrophage foam cells (red triangle) (). Additionally, lipophagic vacuoles surrounded by double membranes were more abundant in these samples than in those from apoe−/− mice. Furthermore, atherosclerotic aortas from prdx1−/−apoe−/− mice had the characteristic residual material of a lysosomal degradation product, which consists of a double-membrane vesicle containing partially undegraded intracellular material (, red circle). To monitor in vivo lipophagic flux in Prdx1 deficiency, we measured autophagy-related protein levels in atherosclerotic plaques from aortas of apoe−/− or prdx1−/−apoe−/− mice fed a high-fat diet. The atherosclerotic aortic lysates from prdx1−/−apoe−/− mice showed higher expression of LC3-II than those from apoe−/− mice (). Also, we assessed the SQSTM1 level in aortic lysates from apoe−/− or prdx1−/−apoe−/− mice on an atherogenic diet. The SQSTM1 protein level was dramatically increased in aortas from prdx1−/−apoe−/− mice compared with apoe−/− mice (). In contrast, the expression levels of Sqstm1 mRNA were the same between the 2 groups of mice (). These results indicate that Prdx1 deficiency induces SQSTM1 accumulation through defective lipophagic flux in atherosclerotic plaque.
Figure 5. Prdx1 deficiency induces lipophagy dysfunction in atherosclerotic plaques. (A) Electron microscopy showing the number and size of cytoplasmic lipid droplets (LD) and residual bodies (red circle) in apoe−/− and prdx1−/−apoe−/− mice (n = 3 per group). Quantitative data (below) represent the relative LD size. Scale bar: 2 μm. Immunoblot analyses of LC3B (B) and SQSTM1 (C) expression in extracts from the aortas of apoe−/− and prdx1−/−apoe−/− mice fed an atherogenic diet for 10 wk. GAPDH was used as a loading control. Quantitative data represent the fold change after normalizing LC3B-II:LC3B-I and SQSTM1 band intensity to GAPDH. (D) mRNA levels of Sqstm1 in the aortas of apoe−/− and prdx1−/−apoe−/− mice as determined by quantitative real-time PCR (B, C and D, n = 5 per group). (E) Confocal microscopy images of BODIPY-stained aortic sinuses from apoe−/− and prdx1−/−apoe−/− mice fed an atherogenic diet for 10 wk (n = 8–12 per group). Quantitative data represent relative mean fluorescence intensity (MFI). Scale bar: 100 μm. *P < 0.05, ***P < 0.001, by the Mann-Whitney test. Data represent the mean ± SEM.
Lipid accumulation is a hallmark of atherosclerotic plaques,Citation40 and persistently undissolved LDs lead to lipophagy dysfunction in macrophages, causing the lipid to remain trapped in the lysosomal compartment. We used BODIPY to measure the neutral lipid stored area in atherosclerotic plaques from the aortic sinus of apoe−/− or prdx1−/−apoe−/− mice fed a high-fat diet. In addition to increased plaque formation, neutral lipid area (as determined by microscopy) was increased in the atherosclerotic plaques of prdx1−/−apoe−/− mice (). Altogether, these observations suggest that lipid turnover is decreased in Prdx1-deficient macrophages within plaques, and that excessive oxidative stress disturbs lipophagic flux in an atherogenic state.
Impaired lipophagic flux in Prdx1-deficient hematopoietic cells exacerbates plaque formation in apoe−/− mice
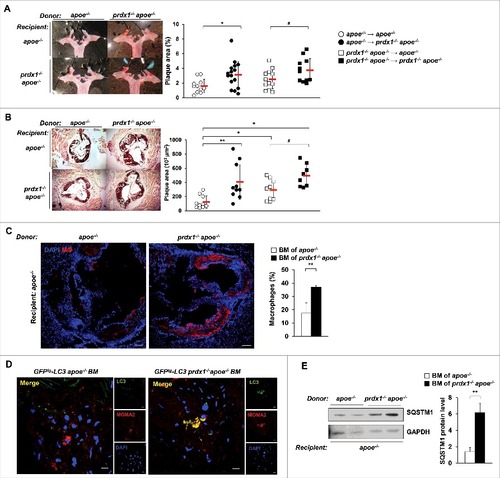
To assess the contribution of lipophagic flux impairment in Prdx1-deficient macrophages to the atherosclerotic pathology of these mice, we transferred bone marrow (BM) cells obtained from apoe−/− or prdx1−/−apoe−/− mice into lethally-irradiated apoe−/− or prdx1−/−apoe−/− recipient mice. Four wk after transplantation, the mice were fed a high-fat diet for 10 wk. hematoxylin and eosin staining showed that apoe−/− mice transplanted with BM cells from prdx1−/−apoe−/− mice formed significantly more atherosclerotic plaques than did apoe−/− BM-transplanted apoe−/− mice (Fig. S5). The same trend was observed in BM-reconstituted prdx1−/−apoe−/− mice. Consistent with the increased plaque area, neutral lipid content (as assessed by Oil Red O staining) was also increased in BM cells of prdx1−/−apoe−/− transplanted apoe−/− mice compared with apoe−/− BM-transplanted apoe−/− mice ( and ). Furthermore, the plaques of apoe−/− mice transplanted with Prdx1-deficient BM cells (prdx1−/−apoe−/− or GFPtg -LC3 prdx1−/−apoe−/− ) had greater numbers of lesional macrophages () and LC3 colocalized macrophages () than those transplanted with BM cells from apoe−/− or GFPtg -LC3 apoe−/− mice. Finally, the level of SQSTM1 protein was dramatically increased in aortas from apoe−/− mice transplanted with BM cells from prdx1−/−apoe−/− mice compared with apoe−/− BM-transplanted apoe−/− mice (). In conclusion, these data show that deficiency of Prdx1 in hematopoietic cells, but not in vascular tissues, is sufficient to accelerate lipophagic impairment and atherosclerotic plaque formation.
Figure 6. Impaired lipophagic flux in Prdx1-deficient haematopoietic cells exacerbates plaque formation in apoe−/− mice. Bone marrow (BM) from apoe−/− or prdx1−/−apoe−/− mice was transplanted into apoe−/− or prdx1−/−apoe−/− recipients. Four weeks after transplantation, mice were fed an atherogenic diet for 10 wk. Representative images of Oil Red O staining of aortas (A) and aortic sinuses (B) from apoe−/− and prdx1−/− apoe−/− recipient mice transplanted with apoe−/− or prdx1−/−apoe−/− BM (n = 11–16 per group). Quantitative data represent plaque percentage (%) or size. (C) Representative immunostaining images of the macrophage marker CD68 in apoe −/− recipient mice transplanted with BM from apoe−/− or prdx1−/−apoe−/− donors (n = 10 per group). CD68 is shown in red and nuclei in blue. Scale bars: 100 μm. Quantitative data in the graph represent the percentage of the total plaque area that was positively stained. (D) Representative confocal microscopy images of plaques from apoe−/− mice transplanted with BM cells from GFPtg-LC3 apoe−/− or GFPtg-LC3 prdx1−/−apoe−/− mice (n = 3 per group). LC3 is shown in green, macrophages in red, and nuclei in blue. Scale bar: 10 μm. (E) Immunoblot analysis of SQSTM1 expression in extracts from the aortas of apoe −/− recipient mice transplanted with BM from apoe−/− or prdx1−/−apoe−/− donors. Quantitative data represent the fold change after normalizing LC3B-II, LC3B-I and SQSTM1 band intensity to GAPDH. *P < 0.05 and **P < 0.01 versus apoe −/− recipient mice transplanted with apoe−/− BM; # P < 0.05 versus prdx1−/−apoe−/− recipient mice transplanted with apoe−/− BM, by the Mann-Whitney test. Data represent the mean ± SEM.
Discussion
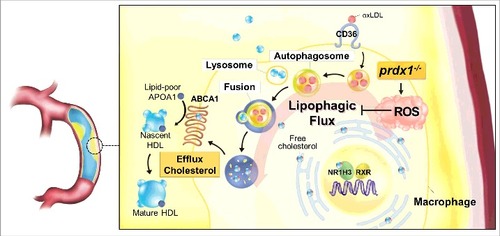
This study demonstrates that the underlying mechanism of excessive oxidative stress in Prdx1-deficient macrophages is increased foam cell formation caused by impaired lipophagy. Furthermore, our study confirms that lipophagy is important for the control of atherosclerosis in vivo. The links between lipophagic flux, oxidative stress, and atherogenesis are summarized in .
Figure 7. Model for the function of Prdx1 in the lipophagic flux of macrophages. PRDX1 is the most highly expressed antioxidant enzyme in macrophages, and it is highly effective at eliminating H2O2 in monocytes and macrophages. Prdx1 deficiency in macrophages inhibits lipophagic flux and reduces acidic cholesterol hydrolysis. Overall, PRDX1 maintains lipophagic flux by scavenging ROS H2O2 in monocytes and macrophages. HDL, high-density lipoprotein; VLDL, very low-density lipoprotein.
Prdx1 deficiency causes an increase of H2O2 ROS in macrophages. H2O2 ROS causes cellular stress and activates apoptosis, the elimination of which are presumably better for cells. Consequently, an incremental increase of H2O2 ROS within cells induces autophagy activation for cell survival.Citation41 To date, however, the autophagic flux in response to H2O2 ROS remains largely elusive and poorly understood. Herein, we demonstrate that Prdx1-deficient macrophages exposed to oxLDL undergo a lipophagic flux impairment characterized by accumulation of SQSTM1, which has been reported as a known marker of defective autophagy.Citation42 Furthermore, we show that an increase of CE accumulation correlates with an inhibition of acidic lipolysis in normal macrophages, whereas Prdx1-deficient macrophages did not change their CE mass under conditions of chloroquine treatment. Thus, the data presented here suggest that oxidative stress caused by Prdx1 deficiency results in the accumulation of CE within macrophages and foam cell formation, and suggest that PRDX1 and H2O2 ROS could be actively involved in the regulation of lipophagic flux by participating in autolysosome formation.
Some autophagy components have a characteristic hydrophobicity, which plays a role in forming the autophagosome. For example, LC3-II has stronger hydrophobicity than LC3-I, because LC3-II is combined with the phosphatidylethanolamine group.Citation43 Furthermore SQSTM1, Atg19 and Atg32 have a specific motif for binding to the conserved hydrophobic pockets on LC3/Atg8.Citation44 Although the hydrophobic nature of these components can be changed to hydrophilic and water-soluble by oxidation in the presence of the H2O2 ROS,Citation45 the mechanisms by which PRDX1 is involved in the autophagic flux dysfunction still remain unclear. Therefore, considering the complex roles of oxidative stress in the regulation of autophagy, it would be important to further elucidate the key step that is impaired by the Prdx1 deficiency-induced oxidative stress with regard to lipophagic flux.
Lipophagy, the selective lipophagic degradation of LDs, has been observed in various cell types.Citation6,46,47,48 Additionally, recent studies have shown that impaired lipophagy can exacerbate atherosclerosis.Citation49 Lipophagic regulation of cholesterol homeostasis is a new concept that has important implications for cardiovascular disease.Citation50 Although several studies have used cell type-specific knockouts or heterozygosity of autophagy-related (Atg) genes, autophagy-deficient states in mice are expected to have disparate phenotypes from cellular autophagic processes in normal states. That is, previous studies did not consider the autophagic flux in the steady state. In contrast, our study shows that the lipophagic process during atherosclerosis appears to be independent of any Atg deficiency and indicates that oxidative stress suppresses lipophagic flux in response to modified LDL. We found that specifically lipophagy is induced in response to atherogenic lipoprotein loading; thus, the acidic lipophagic pathway for CE hydrolysis in LDL is the one that clearly is triggered by oxidative stress. Our observation supports the previously verified role of autophagy in cholesterol efflux, a process that that also involves activation of NR1H3 and its downstream target ABCA1.Citation35,51 A recent report showed that autophagy-mediated efflux is closely linked to ABCA1 and is involved with NR1H3, limiting the expression of ABCA1 in autophagy-defective conditions.Citation5 Moreover, it was not possible to rescue cholesterol efflux in Lalistat 1-treated and Atg5-deficient macrophages using an NR1H3 activator (T0901317). Prdx1-deficient macrophages fail to activate the Nr1h3 nuclear expression in response to reducing of free cholesterol under these lipophagic flux-limiting conditions. Thus, these results suggest that increased oxidative stress in the absence of PRDX1 expression reduced cholesterol efflux in macrophages, a process that seemed to be dependent on NR1H3 activation.
Accumulating evidence demonstrates that autophagy plays an important role in inhibiting inflammation and apoptosis, and in promoting efferocytosis and cholesterol efflux. These results suggest the defect in autophagy can influence the progression of several chronic diseases, such as atherosclerosis. In this study, we show for the first time that PRDX1 is the most effective antioxidant enzyme, which maintains the in vivo lipophagic flux against inducible oxidative stress within atherosclerotic macrophages. PRDX1 was first discovered as a 23-kDa stress protein in macrophages,Citation15 and we showed that macrophages had the highest level of PRDX1 expression of all cells occurring in atherosclerotic plaques. Prdx1 deficiency can lead to dysfunctional lipophagy, accumulation of SQSTM1 and increased atherosclerotic plaques in Apoe-deficient mice. Furthermore, bone marrow transplantation experiments demonstrated that PRDX1 is expressed in hematopoietic cells to protect susceptible Apoe-deficient mice from atherosclerosis. We did not observe a significant increase in atherosclerotic pathology in mice that had Prdx1 deficiency in only nonhematopoietic cells. Therefore, the increased levels of endothelial SELP/P-selectin, soluble SELP, and VWF (Von Willebrand factor) previously found in the plasma of Prdx1-deficient mice could be an effect of the inflammatory state caused by whole body Prdx1-deficiency.Citation19
To block intracellular H2O2 in an attempt to recover impaired lipophagy, we used the synthetic antioxidants ebselen and gliotoxin, which are effective at scavenging intracellular H2O2 in vitro and in vivo through 2-Cys PRDX-like mechanisms. The results of this study showed for the first time that ebselen and gliotoxin effectively rescue the impairment of autophagy that is associated with Prdx1 deficiency, which indicates that oxidative stress may influence cholesterol efflux in macrophages by regulating lipophagy. Collectively, understanding the interactions between antioxidant mimics and lipophagy should be considered in atherosclerosis to explore the effects of oxidative stress and autophagy-related disease.
In conclusion, the data presented here show that PRDX1 is essential in maintaining lipophagic flux and cholesterol homeostasis. Our results shed light on the undiscovered links between lipophagic flux, oxidative stress, and the antioxidant PRDX1 in macrophages. Additionally, these results also suggest that 2-Cys PRDX-mimics, such as ebselen and gliotoxin, might be useful for treating atherosclerosis and defective lipophagy-related diseases.
Materials and methods
Experimental animals
To generate prdx1−/−apoe−/− mice, GFPtg-LC3 prdx1−/− mice, and GFPtg-LC3 prdx1−/−apoe−/− mice, prdx1−/− mice were crossed with either apoe−/− mice or GFPtg-LC3 mice.Citation52 All prdx1−/−apoe−/−, GFPtg-LC3 prdx1−/− , and GFPtg-LC3 prdx1−/−apoe−/− strains were C57BL/6J congenic lines backcrossed more than 10 times with C57BL/6J mice. We used male mice for all experiments. Mice were housed in a specific pathogen-free system, maintained on a 12-h light/dark cycle, and kept at 22–23°C with water ad libitum. All animal study protocols were approved by the Institutional Animal Care and Usage Committee (IACUC No. 2012–01–052) of Ewha Womans University.
Primary peritoneal macrophage culture
Peritoneal macrophages were obtained from the peritoneal cavity at 3 d after mice were injected with 4% thioglycollate broth (Fluka, 70157).Citation3,23,30 The cells obtained were washed with phosphate-buffered saline (PBS; 137 mM NaCl, 2.7 mM KCl, 10 mM Na2HPO4, 2 mM KH2PO4, pH 7.4), centrifuged at 400 g for 5 min, and suspended in Dulbecco's modified Eagle's medium (DMEM; Hyclone, SH30243.01) containing 10% heat-inactivated fetal bovine serum (Hyclone, SH30919.03), 100 units/ml penicillin (Gibco, 15140–122), and 2 mM L-glutamine (Gibco, 25030–081). Cells were cultured at 37°C under a 5% CO2 atmosphere. Two h later, non-adherent cells were removed by washing with PBS, and adherent macrophages were used for subsequent experiments.
Cellular hydrogen peroxide staining
Isolated peritoneal macrophages were plated on a confocal dish (SPL Life Sciences, 20350) and stimulated with 50 μg/ml oxLDL (Alfa Aesar, J65591) for 30 min. Next, cells were washed with Hank's balanced salt solution (WelGENE, LB003–02), incubated with 10 μM CM-H2DCFDA (Molecular Probes, C6827) in DMEM for 30 min, and imaged. For experiments with the H2O2-specific probe Peroxy Orange 1 (PO1; Tocris Bioscience, 4944), peritoneal macrophages were incubated with 5 μM PO1 for 40 min at 37°C, mixed with 50 μg/ml oxLDL for 20 min, and then imaged. The cells were then kept in an incubator (37°C, 5% CO2) during the course of all experiments and imaged by confocal microscopy (Carl Zeiss, Jena, Germany; LSM 780).
Adenovirus transduction and fluorescence microscopy
For PRDX1-expressing adenovirus transduction, peritoneal macrophages were plated on a confocal dish, incubated with Ad-Con or Ad-PRDX1 (2 × 10⁹ plaque-forming units [pfu]) for 24 h, stimulated by oxLDL and then imaged with an LSM 780 confocal microscope. For Ad-mCherry-GFP-LC3 transduction, peritoneal macrophages were plated on coverslips, incubated with Ad-mCherry-GFP-LC3 (2 × 10⁹ pfu) for 24 h, and then stimulated with oxLDL. Cells were fixed with 4% paraformaldehyde in PBS at 4°C, coverslips were mounted onto slides using mounting medium for fluorescence with DAPI (Thermo Fisher Scientific, H-1200) and imaged with an LSM 780 confocal microscope. Percentages of colocalization are shown as (mCherry+ GFP−) dots/total (mCherry+ GFP+) dots quantified by the imageJ program.Citation27
Aortic single-cell preparation and flow cytometry analysis
Aortic single cells were prepared using described previously methods.Citation53 Briefly, after careful removal of perivascular fat using microscissors under a dissecting microscope, single-cell suspensions from whole aortic segments were prepared by incubation with an enzyme mixture containing 675 U/ml collagenase I (C0130), 187.5 U/ml collagenase XI (C7657), 90 U/ml hyaluronidase (H3884), and 90 U/ml DNase (DN25) (all obtained from Sigma Aldrich) in Hank’s balanced salt solution with calcium and magnesium for 90 min at 37°C with gentle shaking. To analyze surface markers on macrophages, cell suspensions from the aortas of mice were incubated with perCP anti-mouse PTPRC/CD45 (BioLegend, 103129), brilliant violet 605 anti-mouse ADGRE1/F4/80 (BioLegend, 123133), APC/Cy7 anti-mouse MHC class II (I-A/I-E) (BioLegend, 107627), APC anti-mouse/human ITGAM/CD11b (BioLegend, 101211), PE anti-mouse FCGR1/CD64/FCγRI (BioLegend, 139303) and BODIPY (Molecular Probes, D3922). We used a FACS BD LSRFORTESSA flow cytometer and analyzed the data with Cell Quest Pro software (BD Biosciences).
Immunohistochemistry and fluorescence microscopy
For staining of macrophages within atherosclerotic plaques, BODIPY and rat anti-CD68 (AbD Serotec, MCA1957) primary antibodies were used. After incubation with primary antibodies, Alexa Fluor 594-labeled anti-rat secondary antibodies (Invitrogen, A21471) were used to visualize the antigens. DAPI was used to label the nuclei (Sigma Aldrich, D9542). Negative control tissues were prepared in a similar manner using rat IgG isotype control antibodies (Santa Cruz Biotechnology, sc-2026). Samples were analyzed using an LSM Image Examiner (Carl Zeiss, Jena, Germany; LSM780).
Cellular lipid staining
For ex vivo assessment of macrophage cholesterol accumulation, peritoneal macrophages were isolated from Prdx1+/+ and prdx1−/− mice, plated, and stimulated with 50 μg/ml oxLDL for 48 h. Cells were stained with Oil Red O solution (Sigma Aldrich, O0625) for 1 h and then briefly washed with PBS. Macrophages with more than 10 lipid droplets were defined as foam cells and the percentage of foam cells was calculated in the total cell field.
Quantitative real-time PCR analysis
Total RNA was isolated using Isol-RNA Lysis reagent (5 PRIME, 2302700), suspended in diethylpyrocarbonate (Sigma Aldrich, D5758)-treated water, and stored at −80°C. cDNA was synthesized with the RevertAid first strand cDNA synthesis kit (Thermo Fisher Scientific, K1622). Quantitative real-time PCR was performed using the KAPA SYBR® FAST Master Mix (Kapa Biosystems, KK4602) with a 7700 sequence detector (Applied Biosystems). Calculations were performed using a comparative method (2−CT) with Actb as the internal control. The primers are listed in Table S1.
Immunoblot analysis
To isolate proteins, samples were lysed in RIPA buffer (50 mM Tris-HCl, pH 7.4, 150 mM NaCl, 0.1% SDS (Sigma Aldrich, L3771), 1% NP-40 (Sigma Aldrich, NP-40S), 0.25% sodium deoxycholate (Sigma Aldrich, D6750), 1 mM EDTA, 1 mM sodium fluoride, 1 mM Na3VO4) with a protease inhibitor cocktail (Roche Life Science, 11 697 498 001). For immunoblot analysis, proteins were electrophoresed on SDS-polyacrylamide gels and transferred onto PVDF membranes. The membranes were blocked with 4% skim milk (BD Difco, 232100) in Tris-buffered saline (TBS; 50 mM Tris-Cl, 150 mM NaCl, pH 7.5) containing 0.5% Tween-20 (Sigma Aldrich, P1379; TBST) and subsequently incubated with anti-PRDX1 (Abcam, ab41906), anti-PRDX2 (AbFrontier, LF-PA0007), anti-PRDX3 (AbFrontier, LF-PA0030), anti-PRDX4 (AbFrontier, LF-PA0009), anti-NR1H3/LXRα (Abcam, ab41902), anti-LC3B (Cell Signaling Technology, 2775), anti-SQSTM1/p62 (Abcam, ab56416), anti-CD36 (Santa Cruz Biotechnology, sc-9154), anti-LMNB/laminB (Santa Cruz Biotechnology, sc-6217) and anti-GAPDH (Santa Cruz Biothechnology, sc-25778) primary antibody and horseradish peroxidase-conjugated secondary antibody (Millipore, AP106P, AP124P and AP124P). Immunoreactive bands were detected with ECL™ western blotting reagents (GE Healthcare Life Sciences, RPN2106).
Cellular cholesterol measurement
The Cholesterol Quantitation Kit (BioVision, K603–100) was used to determine the cellular masses of cholesterol and cholesteryl ester (CE). Peritoneal macrophages from Prdx1+/+ and prdx1−/− mice were incubated for 30 h in medium containing 50 μg/mL of modified lipoproteins and 10 μg/mL ACATi (Sandoz, 58–035; Sigma Aldrich, S9318). Variations in CE are expressed as percent hydrolysis or as fold change relative to the control, and CE hydrolysis was calculated as follows: % hydrolysis = (CEi – CEf)/(CEi)*100, where CEi represents the CE mass immediately after oxLDL loading, and CEf represents the CE mass after the cells were incubated for 30 h.
Cholesterol efflux assay
Peritoneal macrophages from Prdx1+/+ and prdx1−/− mice were incubated for 30 h in media containing 50 μg/mL of modified lipoproteins (Alfa Aesar, J65591) that had been pre-incubated with 5 μCi/mL3H-cholesterol (GE Healthcare Life Sciences, TRK330). Cells were washed and equilibrated overnight in 0.2% fetal bovine serum-containing DMEM medium, and cholesterol efflux was determined in the presence or absence of 50 μg/mL human recombinant APOA1/APOA-I (Sigma Aldrich, A0722) or mouse serum (2%; Sigma Aldrich, M5905) in FBS-free media with the indicated reagent (100 μM paraoxon [Sigma Aldrich, 36186], or 30 μM chloroquine [Sigma Aldrich, C6628]) for 24 h. Efflux is expressed as a percentage of 3H-cholesterol in the medium to 3H-cholesterol in the medium+3H-cholesterol in the cells.
Electron microscopy
After removal from the mice, aortas were fixed with glutaraldehyde, then tissue from atherosclerotic regions of the aortic arch was cut into blocks of 1 mm3 and post-fixed with 1% osmium tetroxide (Sigma Aldrich, 75632) in phosphate buffer (0.2 M, pH 7.4) for 2 h. Samples were then dehydrated in a graded ethanol series and embedded in poly/Bed-812 resin (Polysciences, 08792–1). Semi-thin sections were stained with toluidine blue and examined by light microscopy. Ultrathin sections were stained with uranyl acetate and lead citrate and photographed with a transmission electron microscope (HITACHI H-7650).
Atherosclerotic lesion analysis
For atherosclerotic lesion formation experiments, 8-wk-old mice were fed a normal chow diet for 20 wk or a high-fat diet (20% fat, 0.15% cholesterol; Research Diets, D12079B) for 10 weeks. Mice were fasted for 4 h and anesthetized with 0.6 ml of 1.2% avertin (Sigma Aldrich, T48402) per 25 g body weight. The hearts and aortas were then perfused with PBS through the left ventricle. The hearts were embedded in OCT compound (Sakura Finetek, 4583) and frozen on dry ice. The aortas were dissected from the proximal ascending aorta to the bifurcation of the iliac artery, and adventitial fat was removed. For en face analysis, the aortas were split longitudinally, pinned onto flat, black silicone plates, and fixed overnight in 10% formaldehyde in PBS. Fixed aortas were stained with Oil Red O solution for 16 h, briefly washed with PBS, and digitally photographed at a fixed magnification (Carl Zeiss, Jena, Germany, Axio Zoom.V16). Total aortic areas and lesion areas were calculated using the AxioVision program. For analyzing aortic sinus plaque lesions, cryosectioning was performed. Each 10-μm-thick section was stained with Oil Red O and Hematoxylin and Eosin staining for quantification of atherosclerosis, and the images were photographed using an Axiovert 200 (Carl Zeiss, Jena, Germany).
Bone marrow transplantation
The apoe−/−, prdx1−/−apoe−/−, GFPtg-LC3 apoe−/− , and GFPtg-LC3 prdx1−/−apoe−/− donor mice were killed using carbon dioxide, and the femurs and tibia were dissected. Sterile PBS was used to flush the marrow from each bone, after which the marrow was pooled. MACS LD columns (Miltenyi Biotec, 130–042–901) conjugated with CD5 (Ly-1) MicroBeads (Miltenyi Biotec, 130–049–301) were used to deplete mature T cells from the BM. Four-wk-old apoe−/− and prdx1−/− apoe−/− recipient mice were lethally irradiated using gamma rays (2 × 5 Gy, 4 h apart). BM cells (1 × 10⁶) from donor mice suspended in 100 μl of sterile PBS were administered intravenously to each irradiated mouse. After transplantation, the mice were fed a normal chow diet for 4 wk, then a high-fat diet for 10 wk before en face and aortic sinus assays.
Statistical analysis
All data displayed in the text and figures are expressed as mean ± SEM. The n numbers are indicated for each experiment in the figure legends. Comparison between 2 groups was analyzed using the Mann-Whitney U test. Statistical significance was determined with P values < 0.05.
Abbreviations
| ABCA1 | = | ATP-binding cassette, sub-family A (ABC1), member 1; |
| ABCG1 | = | ATP-binding cassette, sub-family G (WHITE), member 1; |
| APOE | = | apolipoprotein E; |
| ATG | = | autophagy related; |
| BM | = | bone marrow; |
| CE | = | cholesteryl ester; |
| Eb | = | ebselen; |
| GFP | = | green fluorescent protein; |
| Gt | = | gliotoxin; |
| H2O2 | = | hydrogen peroxide; |
| LD | = | lipid droplet; |
| Mφ | = | macrophages; |
| MAP1LC3B/LC3B | = | microtubule-associated protein 1 light chain 3 β; |
| MFI | = | mean fluorescence intensity; |
| NR1H3/LXRα | = | nuclear receptor subfamily 1, group H, member 3; |
| oxLDL | = | oxidized low density lipoprotein; |
| Pfu | = | plaque-forming units; |
| PRDX1 | = | peroxiredoxin 1; |
| ROS | = | reactive oxygen species; |
| SQSTM1/p62 | = | sequestosome 1 |
Disclosure of potential conflicts of interest
There were no potential conflicts of interest to be disclosed.
Supplemental_Material.zip
Download Zip (1.6 MB)Acknowledgment
We would like to thank Dr. J-S Kim (University of Florida) for kindly providing Ad-mCherry-GFP-LC3.
Funding
This work was supported by a National Research Foundation of Korea (NRF) grant funded by the Korean government (No. 2012R1A5A1048236 and MEST; No. 2010–0019866, 2010–0020878, 2012R1A3A2026454 and 2012R1A6A3A04040206) and by grants HL055798 and HL088093 (Y.I.M) from the US. National Institutes of Health.
Additional information
Funding
Related Research Data
References
- Levine B, Klionsky DJ. Development by self-digestion: molecular mechanisms and biological functions of autophagy. Dev Cell 2004; 6:463-77; PMID:15068787; https://doi.org/10.1016/S1534-5807(04)00099-1
- Mizushima N, Ohsumi Y, Yoshimori T. Autophagosome formation in mammalian cells. Cell Struct Funct 2002; 27:421-9; PMID:12576635; https://doi.org/10.1247/csf.27.421
- Razani B, Feng C, Coleman T, Emanuel R, Wen H, Hwang S, Ting JP, Virgin HW, Kastan MB, Semenkovich CF. Autophagy links inflammasomes to atherosclerotic progression. Cell Metab 2012; 15:534-44; PMID:22440612; https://doi.org/10.1016/j.cmet.2012.02.011
- Bonilla DL, Bhattacharya A, Sha Y, Xu Y, Xiang Q, Kan A, Jagannath C, Komatsu M, Eissa NT. Autophagy regulates phagocytosis by modulating the expression of scavenger receptors. Immunity 2013; 39:537-47; PMID:24035364; https://doi.org/10.1016/j.immuni.2013.08.026
- Ouimet M, Franklin V, Mak E, Liao X, Tabas I, Marcel YL. Autophagy regulates cholesterol efflux from macrophage foam cells via lysosomal acid lipase. Cell Metab 2011; 13:655-67; PMID:21641547; https://doi.org/10.1016/j.cmet.2011.03.023
- Levine B, Mizushima N, Virgin HW. Autophagy in immunity and inflammation. Nature 2011; 469:323-35; PMID:21248839; https://doi.org/10.1038/nature09782
- Woo HA, Yim SH, Shin DH, Kang D, Yu DY, Rhee SG. Inactivation of peroxiredoxin I by phosphorylation allows localized H(2)O(2) accumulation for cell signaling. Cell 2010; 140:517-28; PMID:20178744; https://doi.org/10.1016/j.cell.2010.01.009
- Morrell CN. Reactive oxygen species: finding the right balance. Circ Res 2008; 103:571-2; PMID:18796643; https://doi.org/10.1161/CIRCRESAHA.108.184325
- Rhee SG, Bae YS, Lee SR, Kwon J. Hydrogen peroxide: a key messenger that modulates protein phosphorylation through cysteine oxidation. Sci STKE 2000; 2000:pe1; PMID:11752613
- Rhee SG. Cell signaling. H2O2, a necessary evil for cell signaling. Science 2006; 312:1882-3; PMID:16809515; https://doi.org/10.1126/science.1130481
- Rhee SG. Redox signaling: hydrogen peroxide as intracellular messenger. Exp Mol Med 1999; 31:53-9; https://doi.org/10.1038/emm.1999.9
- Rhee SG. Measuring H2O2 produced in response to cell surface receptor activation. Nat Chem Biol 2007; 3:244-6; PMID:17438545; https://doi.org/10.1038/nchembio0507-244
- Rhee SG, Kang SW, Jeong W, Chang TS, Yang KS, Woo HA. Intracellular messenger function of hydrogen peroxide and its regulation by peroxiredoxins. Curr Opin Cell Biol 2005; 17:183-9; PMID:15780595; https://doi.org/10.1016/j.ceb.2005.02.004
- Wood ZA, Schroder E, Robin Harris J, Poole LB. Structure, mechanism and regulation of peroxiredoxins. Trends Biochem Sci 2003; 28:32-40; PMID:12517450; https://doi.org/10.1016/S0968-0004(02)00003-8
- Ishii T, Yamada M, Sato H, Matsue M, Taketani S, Nakayama K, Sugita Y, Bannai S. Cloning and characterization of a 23-kDa stress-induced mouse peritoneal macrophage protein. J Biol Chem 1993; 268:18633-6; PMID:8360158
- Yamaguchi M, Sato H, Bannai S. Induction of stress proteins in mouse peritoneal macrophages by oxidized low-density lipoprotein. Biochem Biophys Res Commun 1993; 193:1198-201; PMID:8323542; https://doi.org/10.1006/bbrc.1993.1752
- Neumann CA, Krause DS, Carman CV, Das S, Dubey DP, Abraham JL, Bronson RT, Fujiwara Y, Orkin SH, Van Etten RA. Essential role for the peroxiredoxin Prdx1 in erythrocyte antioxidant defence and tumour suppression. Nature 2003; 424:561-5; PMID:12891360; https://doi.org/10.1038/nature01819
- Mowbray AL, Kang DH, Rhee SG, Kang SW, Jo H. Laminar shear stress up-regulates peroxiredoxins (PRX) in endothelial cells: PRX 1 as a mechanosensitive antioxidant. J Biol Chem 2008; 283:1622-7; PMID:18024958; https://doi.org/10.1074/jbc.M707985200
- Kisucka J, Chauhan AK, Patten IS, Yesilaltay A, Neumann C, Van Etten RA, Krieger M, Wagner DD. Peroxiredoxin1 prevents excessive endothelial activation and early atherosclerosis. Circ Res 2008; 103:598-605; PMID:18689572; https://doi.org/10.1161/CIRCRESAHA.108.174870
- Park JG, Yoo JY, Jeong SJ, Choi JH, Lee MR, Lee MN, Hwa Lee J, Kim HC, Jo H, Yu DY, et al. Peroxiredoxin 2 deficiency exacerbates atherosclerosis in apolipoprotein E-deficient mice. Circ Res 2011; 109:739-49; PMID:21835911; https://doi.org/10.1161/CIRCRESAHA.111.245530
- Moore KJ, Tabas I. Macrophages in the pathogenesis of atherosclerosis. Cell 2011; 145:341-55; PMID:21529710; https://doi.org/10.1016/j.cell.2011.04.005
- Ouimet M. Autophagy in obesity and atherosclerosis: Interrelationships between cholesterol homeostasis, lipoprotein metabolism and autophagy in macrophages and other systems. Biochim Et Biophys Acta 2013; 1831:1124-33; PMID:23545567; https://doi.org/10.1016/j.bbalip.2013.03.007
- Ouimet M, Marcel YL. Regulation of lipid droplet cholesterol efflux from macrophage foam cells. Arterioscler Thromb Vasc Biol 2012; 32:575-81; PMID:22207731; https://doi.org/10.1161/ATVBAHA.111.240705
- Gautier EL, Shay T, Miller J, Greter M, Jakubzick C, Ivanov S, Helft J, Chow A, Elpek KG, Gordonov S, et al. Gene-expression profiles and transcriptional regulatory pathways that underlie the identity and diversity of mouse tissue macrophages. Nat Immunol 2012; 13:1118-28; PMID:23023392; https://doi.org/10.1038/ni.2419
- Bateman KE, Catton PA, Pennock PW, Kruth SA. 0-7-21 radiation therapy for the palliation of advanced cancer in dogs. J Vet Intern Med 1994; 8:394-9; PMID:7533838; https://doi.org/10.1111/j.1939-1676.1994.tb03257.x
- Mathew R, Karp CM, Beaudoin B, Vuong N, Chen G, Chen HY, Bray K, Reddy A, Bhanot G, Gelinas C, et al. Autophagy suppresses tumorigenesis through elimination of p62. Cell 2009; 137:1062-75; PMID:19524509; https://doi.org/10.1016/j.cell.2009.03.048
- Komatsu M, Waguri S, Koike M, Sou YS, Ueno T, Hara T, Mizushima N, Iwata J, Ezaki J, Murata S, et al. Homeostatic levels of p62 control cytoplasmic inclusion body formation in autophagy-deficient mice. Cell 2007; 131:1149-63; PMID:18083104; https://doi.org/10.1016/j.cell.2007.10.035
- Wang JH, Ahn IS, Fischer TD, Byeon JI, Dunn WA, Jr, Behrns KE, Leeuwenburgh C, Kim JS. Autophagy suppresses age-dependent ischemia and reperfusion injury in livers of mice. Gastroenterology 2011; 141:2188-99 e6; https://doi.org/10.1053/j.gastro.2011.08.005
- Biel TG, Lee S, Flores-Toro JA, Dean JW, Go KL, Lee MH, Law BK, Law ME, Dunn WA, Jr, Zendejas I, et al. Sirtuin 1 suppresses mitochondrial dysfunction of ischemic mouse livers in a mitofusin 2-dependent manner. Cell Death Differ 2016; 23:279-90; PMID:26184910; https://doi.org/10.1038/cdd.2015.96
- Singh R, Kaushik S, Wang Y, Xiang Y, Novak I, Komatsu M, Tanaka K, Cuervo AM, Czaja MJ. Autophagy regulates lipid metabolism. Nature 2009; 458:1131-5; PMID:19339967; https://doi.org/10.1038/nature07976
- Brown MS, Ho YK, Goldstein JL. The cholesteryl ester cycle in macrophage foam cells. Continual hydrolysis and re-esterification of cytoplasmic cholesteryl esters. J Biol Chem 1980; 255:9344-52; PMID:7410428
- Wei E, Gao W, Lehner R. Attenuation of adipocyte triacylglycerol hydrolase activity decreases basal fatty acid efflux. J Biol Chem 2007; 282:8027-35; PMID:17237500; https://doi.org/10.1074/jbc.M605789200
- Calkin AC, Tontonoz P. Transcriptional integration of metabolism by the nuclear sterol-activated receptors LXR and FXR. Nat Rev Mol Cell Biol 2012; 13:213-24; PMID:22414897
- Janowski BA, Grogan MJ, Jones SA, Wisely GB, Kliewer SA, Corey EJ, Mangelsdorf DJ. Structural requirements of ligands for the oxysterol liver X receptors LXRalpha and LXRbeta. Proc Natl Acad Sci U S A 1999; 96:266-71; PMID:9874807; https://doi.org/10.1073/pnas.96.1.266
- Venkateswaran A, Laffitte BA, Joseph SB, Mak PA, Wilpitz DC, Edwards PA, Tontonoz P. Control of cellular cholesterol efflux by the nuclear oxysterol receptor LXR alpha. Proc Natl Acad Sci U S A 2000; 97:12097-102; PMID:11035776; https://doi.org/10.1073/pnas.200367697
- Lawn RM, Wade DP, Garvin MR, Wang X, Schwartz K, Porter JG, Seilhamer JJ, Vaughan AM, Oram JF. The Tangier disease gene product ABC1 controls the cellular apolipoprotein-mediated lipid removal pathway. J Clin Invest 1999; 104:R25-31; PMID:10525055; https://doi.org/10.1172/JCI8119
- Orso E, Broccardo C, Kaminski WE, Bottcher A, Liebisch G, Drobnik W, Gotz A, Chambenoit O, Diederich W, Langmann T, et al. Transport of lipids from golgi to plasma membrane is defective in tangier disease patients and Abc1-deficient mice. Nat Genet 2000; 24:192-6; PMID:10655069; https://doi.org/10.1038/72869
- Azad GK, Tomar RS. Ebselen, a promising antioxidant drug: mechanisms of action and targets of biological pathways. Mol Biol Reports 2014; 41:4865-79; PMID:24867080; https://doi.org/10.1007/s11033-014-3417-x
- Kang DH, Lee DJ, Kim J, Lee JY, Kim HW, Kwon K, Taylor WR, Jo H, Kang SW. Vascular injury involves the overoxidation of peroxiredoxin type II and is recovered by the peroxiredoxin activity mimetic that induces reendothelialization. Circulation 2013; 128:834-44; PMID:23820076; https://doi.org/10.1161/CIRCULATIONAHA.113.001725
- Small DM. George Lyman Duff memorial lecture. Progression and regression of atherosclerotic lesions. Insights from lipid physical biochemistry. Arteriosclerosis 1988; 8:103-29; PMID:3348756; https://doi.org/10.1161/01.ATV.8.2.103
- Scherz-Shouval R, Elazar Z. ROS, mitochondria and the regulation of autophagy. Trends Cell Biol 2007; 17:422-7; PMID:17804237; https://doi.org/10.1016/j.tcb.2007.07.009
- Kirkin V, McEwan DG, Novak I, Dikic I. A role for ubiquitin in selective autophagy. Mol Cell 2009; 34:259-69; PMID:19450525; https://doi.org/10.1016/j.molcel.2009.04.026
- Barth S, Glick D, Macleod KF. Autophagy: assays and artifacts. J Pathol 2010; 221:117-24; PMID:20225337; https://doi.org/10.1002/path.2694
- Noda NN, Kumeta H, Nakatogawa H, Satoo K, Adachi W, Ishii J, Fujioka Y, Ohsumi Y, Inagaki F. Structural basis of target recognition by Atg8/LC3 during selective autophagy. Genes Cells: Devoted Mol Cell Mechan 2008; 13:1211-8; https://doi.org/10.1111/j.1365-2443.2008.01238.x
- Lee SH, Gupta MK, Bang JB, Bae H, Sung HJ. Current progress in Reactive Oxygen Species (ROS)-Responsive materials for biomedical applications. Adv Healthcare Materials 2013; 2:908-15; PMID:25136729; https://doi.org/10.1002/adhm.201200423
- Mizushima N, Komatsu M. Autophagy: renovation of cells and tissues. Cell 2011; 147:728-41; PMID:22078875; https://doi.org/10.1016/j.cell.2011.10.026
- Cadwell K, Philips JA. Autophagy meets phagocytosis. Immunity 2013; 39:425-7; PMID:24054324; https://doi.org/10.1016/j.immuni.2013.08.027
- Kurz T, Terman A, Brunk UT. Autophagy, ageing and apoptosis: the role of oxidative stress and lysosomal iron. Arch Biochem Biophys 2007; 462:220-30; PMID:17306211; https://doi.org/10.1016/j.abb.2007.01.013
- Khandelwal VK, Mitrofan LM, Hyttinen JM, Chaudhari KR, Buccione R, Kaarniranta K, Ravingerova T, Monkkonen J. Oxidative stress plays an important role in zoledronic acid-induced autophagy. Physiol Res / Academia Scientiarum Bohemoslovaca 2014; 63(Suppl 4):S601-12.
- Sergin I, Razani B. Self-eating in the plaque: what macrophage autophagy reveals about atherosclerosis. Trends Endocrinol Metab: TEM 2014; 25:225-34; PMID:24746519; https://doi.org/10.1016/j.tem.2014.03.010
- Chawla A, Boisvert WA, Lee CH, Laffitte BA, Barak Y, Joseph SB, Liao D, Nagy L, Edwards PA, Curtiss LK, et al. A PPAR gamma-LXR-ABCA1 pathway in macrophages is involved in cholesterol efflux and atherogenesis. Mol Cell 2001; 7:161-71; PMID:11172721; https://doi.org/10.1016/S1097-2765(01)00164-2
- Bae SH, Sung SH, Cho EJ, Lee SK, Lee HE, Woo HA, Yu DY, Kil IS, Rhee SG. Concerted action of sulfiredoxin and peroxiredoxin I protects against alcohol-induced oxidative injury in mouse liver. Hepatology 2011; 53:945-53; PMID:21319188; https://doi.org/10.1002/hep.24104
- Jung IH, Choi JH, Jin J, Jeong SJ, Jeon S, Lim C, Lee MR, Yoo JY, Sonn SK, Kim YH, et al. CD137-inducing factors from T cells and macrophages accelerate the destabilization of atherosclerotic plaques in hyperlipidemic mice. FASEB J: Official Publication Federation Am Societies Exp Biol 2014; 28:4779-91; PMID:25059229; https://doi.org/10.1096/fj.14-253732