
ABSTRACT
Thymic epithelial cells (TECs) are critical for the establishment and maintenance of appropriate microenvironment for the positive and negative selection of thymocytes and the induction of central immune tolerance. Yet, little about the molecular regulatory network on TEC development and function is understood. Here, we demonstrate that MTOR (mechanistic target of rapamycin [serine/threonine kinase]) is essential for proper development and functional maturation of TECs. Pharmacological inhibition of MTOR activity by rapamycin (RPM) causes severe thymic atrophy and reduction of TECs. TEC-specific deletion of Mtor causes the severe reduction of mTECs, the blockage of thymocyte differentiation and output, the reduced generation of thymic regulatory T (Treg) cells and the impaired expression of tissue-restricted antigens (TRAs) including Fabp2, Ins1, Tff3 and Chrna1 molecules. Importantly, specific deletion of Mtor in TECs causes autoimmune diseases characterized by enhanced tissue immune cell infiltration and the presence of autoreactive antibodies. Mechanistically, Mtor deletion causes overdegradation of CTNNB1/Beta-Catenin due to excessive autophagy and the attenuation of WNT (wingless-type MMTV integration site family) signaling in TECs. Selective inhibition of autophagy significantly rescued the poor mTEC development caused by Mtor deficiency. Altogether, MTOR is essential for TEC development and maturation by regulating proliferation and WNT signaling activity through autophagy. The present study also implies that long-term usage of RPM might increase the risk of autoimmunity by impairing TEC maturation and function.
Abbreviations
| 3-MA | = | 3-methyladenine |
| AIRE | = | autoimmune regulator (autoimmune polyendocrinopathy candidiasis ectodermal dystrophy) |
| BCA | = | bicinchoninic acid |
| BrdU | = | 5-bromo-2'-deoxyuridine |
| BSA | = | bovine serum albumin |
| cTECs | = | cortical thymic epithelial cells |
| CMC | = | carboxymethyl cellulose sodium |
| DAPI | = | 4′6-diamidino-2-phenylindole |
| DC | = | dendritic cell |
| DN | = | double negative |
| DP | = | double positive |
| DVL2 | = | dishevelled segment polarity protein 2 |
| EDTA | = | ethylenediamine tetraacetic acid |
| FBS | = | fetal bovine serum |
| FOXP3 | = | forkhead box P3 |
| FTOC | = | fetal thymus organ culture |
| KRT | = | keratin |
| IgG | = | immunoglobulin G |
| IL2RA/CD25 | = | interleukin 2 receptor, alpha chain |
| LTBR | = | lymphotoxin B receptor |
| LY75/CD205 | = | lymphocyte antigen 75 |
| mAbs | = | mouse antibodies |
| MHC II | = | major histocompatibility complex class II |
| mTECs | = | medullary thymic epithelial cells |
| MTOR | = | mechanistic target of rapamycin (serine/threonine kinase) |
| MTS24 | = | mouse thymic stroma 24 (mAb against PLET1) |
| OCT | = | optimum cutting temperature |
| QA2/QA-2 | = | Qa lymphocyte antigen 2 region |
| RIPA | = | radioimmunoprecipitation assay |
| RPM | = | rapamycin |
| RTEs | = | recent thymic emigrants |
| SD-PAGE | = | SD-polyacrylamide gel electrophoresis |
| SELL/CD62L | = | selectin, lymphocyte |
| SP | = | single positive |
| TCRB | = | T cell receptor beta chain |
| TECs | = | thymic epithelial cells |
| TEPCs | = | thymic epithelial progenitor cells |
| TNFRSF11A/RANK | = | tumor necrosis factor receptor superfamily, member 11a, NFKB activator |
| Treg | = | regulatory T cell |
| TRAs | = | tissue restricted antigens |
| UEA-1 | = | Ulex Europaeus Lectin 1 |
| WNT | = | wingless-type MMTV integration site family |
Introduction
As a primary lymphoid organ, the thymus provides a unique microenvironment for the development and maturation of naïve T cells [Citation1]. Thymic epithelial cells (TECs) are essential for the attraction of lymphoid precursors into the thymus and their subsequent differentiation, proliferation and selection [Citation1]. Based on their phenotypes and localization, TECs can be divided into cortical TECs (cTECs) and medullary TECs (mTECs), which mediate the positive and negative selection, respectively [Citation2–4]. The mTECs play a critical role for the induction of central immune tolerance. By expressing the tissue-restricted antigens (TRAs) in mTECs or dendritic cells (DCs), T cells that potentially recognize these TRAs are eliminated whereas the T cells that do not have high reactivity to these TRAs can survive and undergo further maturation. Besides its role in eliminating autoreactive T cells, mTECs are essential for the maturation of immunocompetent T cells and the generation of thymic regulatory CD4+ IL2RA+/CD25+ (interleukin 2 receptor, alpha chain) T (Treg) cells [Citation5,Citation6].
Multiple signaling pathways regulate the initiation and differentiation of TECs. The forkhead family member transcription regulator Foxn1 plays a crucial role in the differentiation of mTECs and cTECs from thymic epithelial progenitor cells (TEPCs) and in the maintenance of TECs [Citation7]. The TNFRSF11A/RANK (tumor necrosis factor receptor superfamily, member 11a, NFKB activator), CD40 and LTBR (lymphotoxin B receptor), which can activate the nonclassical and classical NFKB pathway, are essential for the development and maturation of mTECs and the expression of AIRE (autoimmune regulator [autoimmune polyendocrinopathy candidiasis ectodermal dystrophy]) that induces the expression of a broad range of TRAs [Citation8–10]. The WNT signaling is also indispensable for the development and maintenance of thymus homeostasis. Absence of TEC-provided WNT ligand leads to thymus atrophy [Citation11] and WNT4 could increase thymic cellularity through the expansion of TECs and early thymic progenitors [Citation12]. However, the mechanisms underlying the development and maintenance of mTECs and cTECs are poorly understood.
The MTOR (mechanistic target of rapamycin [serine/threonine kinase]) signaling pathway plays key regulatory roles in cell growth, metabolism, autophagy and energy homeostasis [Citation13]. The significance of MTOR signaling in immune system has been recently studied. For instance, MTOR signaling regulates the effector/Treg cell lineage commitment and iNKT cell development [Citation14–16], the differentiation of memory CD8+ T cells [Citation17–19] and naïve T cell survival in the periphery [Citation20,Citation21]. In addition to its role in T cells, MTOR is essential for the development of the large pre-B cells to small pre-B cells [Citation22] and promotes the generation of conventional dendritic cell (DC) and plasmacytoid DC [Citation23,Citation24]. We have previously shown that the TSC1-MTOR signaling axis controls macrophage polarization [Citation25]. Very recently, by deletion of either Rptor or Rictor in TECs, it has been shown that either of MTORC1 or MTORC2 signaling is important for thymopoiesis and proper generation of multiple T cell lineages [Citation26,Citation27]. However, how MTORC1 and MTORC2 together affect TEC differentiation and the underlying molecular mechanisms are unknown. In the present study, by using TEC-specific Mtor knockout mice (Foxn1-Cre; Mtorflox/flox) which will affect both MTORC1 and MTORC2 simultaneously, we found that MTOR signaling is critically required for TECs, in particular mTECs, development and maintenance. Very importantly, mice with TEC-specific deletion of Mtor spontaneously develop severe systemic autoimmune diseases, indicating that targeted inactivation of both branches of MTOR signaling in TECs results in severely impaired central tolerance induction. Collectively, we present convincing evidence that MTOR is essential for mTEC development, central immune tolerance induction via modulating cell proliferation and autophagy.
Results
RPM treatment caused thymus atrophy
As an immunosuppressive drug, rapamycin (RPM) selectively inhibits the activity of MTOR and is widely used after transplantation to prevent organ rejection [Citation28]. To assess the influences of RPM on the development of TECs, we treated C57BL/6 mice with RPM for 7 d. We found that mice exhibited a severe thymic atrophy (A) and the thymus weight and thymocyte number decreased significantly (P<0.001, B, C) after RPM treatment. Moreover, we found that the absolute cell number of TECs decreased significantly after RPM treatment, though the frequency of TECs tended to decrease but did not reach statistical significance (D, E, and Figure S1A). The TECs are composed of mTECs and cTECs. Our results showed that RPM treatment reduced the percentage of mTECs and increased the percentage of cTECs (P<0.01, F, G). However, the cell number of mTECs decreased significantly whereas the cell number of cTECs had no change after RPM treatment (P<0.001, H), indicating that RPM treatment selectively impacts mTECs in mice.
Figure 1. Inhibition of MTOR activity caused thymus atrophy. (A) Representative picture of thymi from mice treated with rapamycin (RPM) or carboxymethyl cellulose sodium (CMC) for 7 d. Scale bar: 5 mm. The ratio of thymus weight to body weight (B) and thymocyte number (C) of control (n = 4) and RPM-treated mice (n = 5). (D) Representative flow cytometry data and frequency of TECs in control mice (n = 4) and RPM-treated mice (n = 5). TECs were defined as PTPRC− EPCAM+ cells. (E) Cell numbers of TECs in control mice (n = 4) and RPM-treated mice (n = 5). Representative FACS plots (F) and frequency (G) of mTECs and cTECs in control mice (n = 4) and RPM-treated mice (n = 5). mTECs were defined as PTPRC− EPCAM+ UEA-1+ ENPEP− cells and cTECs as PTPRC− EPCAM+ UEA-1− ENPEP+ cells. (H) Absolute cell numbers of mTECs and cTECs in control mice (n = 4) and RPM-treated mice (n = 5). Representative FACS plots (I) and quantification (J) of mTECs from control mice (n = 4) and RPM-treated mice (n = 5) for the staining of MHC II, CD40, CD80 and AIRE. (K) Absolute cell numbers of MHC IIhigh, CD40+, CD80+ and AIRE+ mTECs isolated from control mice (n = 4) and RPM-treated mice (n = 5). FACS plots (L) and frequency (M) of mTECs with the phenotype of CD80+ AIRE+ from control mice (n = 4) and RPM-treated mice (n = 5). (N) Absolute cell numbers of CD80+ AIRE+ mTECs from control mice (n = 4) and RPM-treated mice (n = 4). **P<0.01 and ***P<0.001 compared with the control group.
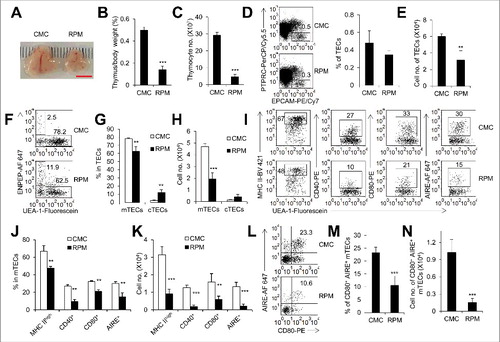
The functional mature mTECs show high level expression of major histocompatibility complex class II (MHC II), CD40, CD80 and express the transcriptional regulator AIRE [Citation10]. After RPM treatment, the percentage and cell number of MHC IIhigh, CD40+, CD80+ and AIRE+ mTECs decreased significantly (P<0.01, I to K, and Figure S1A, B). The CD80+ AIRE+ mTECs are crucial for inducing immunological tolerance [Citation29]. RPM treatment dramatically reduced the percentage and cell number of CD80+ AIRE+ mTECs (P<0.001, L to N), implying the increased risk of suffering from autoimmunity with long-term RPM treatment. Meanwhile, the percentage and absolute cell number of CD80+ MHC IIhigh mTECs also significantly decreased after RPM treatment (P<0.001, Figure S2A, B). As a result, the frequencies of double-negative (DN), double-positive (DP), CD4+ single-positive (SP) and CD8+ SP thymocytes remained unchanged but the absolute numbers of DN, DP, CD4+ SP and CD8+ SP thymocytes reduced markedly upon RPM treatment (P<0.05, Figure S2C, D). Altogether, these observations suggest that a short-term inhibition of MTOR activity blocked the development of mTECs and caused thymic atrophy.
Mtor in TECs is essential in embryonic thymic development
The thymic atrophy caused by RPM treatment may be due to the effects of RPM on TECs and/or thymocytes. To study the intrinsic role of Mtor on TEC growth, development and function and based on the findings that RPM might inhibit both MTORC1 and MTORC2 signaling branches, we investigated mice with a targeted inactivation of MTOR activity specifically in TECs, in which both MTORC1 and MTORC2 activity will be blocked simultaneously in TECs. For this purpose, we crossed mice with loxp-flanked Mtor alleles (Mtorflox/flox) to mice expressing the Cre recombinase under the Foxn1 promoter (Foxn1-Cre) to obtain the Foxn1-Cre; Mtorflox/flox conditional knockout mice (designated as Mtor cKO mice henceforth).
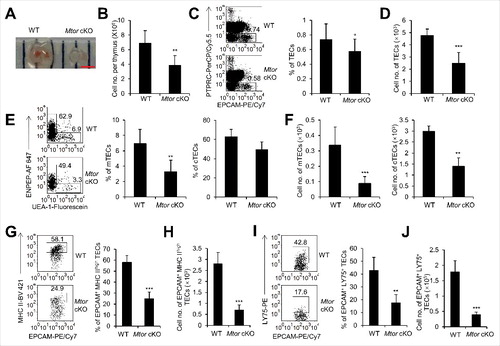
First, we assessed the effects of Mtor inactivation on TEC development at embryonic stage. At embryonic d 16.5 (E16.5), the size of Mtor cKO thymi was reduced as compared to their littermate controls (A), and consistently the absolute numbers of total thymocytes decreased significantly (P<0.01, B). The total number of TECs was also significantly decreased after TEC-specific deletion of Mtor, although the frequency of TECs decreased slightly (P<0.05, C, D and Figure S3). Given the facts that the differentiation of cTECs and mTECs had initiated at E16.5 [Citation30], we found that both the percentages and absolute numbers of mTECs were reduced dramatically in Mtor cKO mice (P<0.01, E, F). Although the absolute number of cTECs decreased significantly (P<0.01, Figure F), the percentage of cTECs had a slight reduction without statistical significance (E). Interestingly, the reduction of mTECs was more severe in comparison to cTECs. TECs expressing a high level of MHC II are more mature than those with low expression of MHC II [Citation30], we found that the frequency and cell number of MHC IIhigh TECs in fetal Mtor cKO mice decreased significantly in comparison to littermate controls (P<0.001, G, H, and Figure S3). Altogether, these results suggested that the development and differentiation of TECs, especially the mTECs, were largely impacted in the absence of MTOR signaling. LY75/CD205+ (lymphocyte antigen 75) TECs represent the TEC progenitors that could differentiate into cTECs and mTECs in vivo [Citation31], TEC-specific deletion of Mtor also reduced the LY75+ TEC progenitors (P<0.01, I, J, and Figure S3), indicating that Mtor is essential for the development and maintenance of TECs including their progenitors.
Figure 2. The development of embryonic thymi was blocked with TEC-specific deletion of Mtor. (A) Representative picture of embryonic thymi from WT and Mtor cKO mice embryos. Scale bar: 1 mm. (B) Absolute cell numbers of embryonic thymi from WT (n = 4) and Mtor cKO embryos (n = 4). (C) Representative flow cytometry plots and frequency of TECs in control (n = 4) and Mtor cKO embryo (n = 4) thymi. (D) Absolute cell numbers of TECs in control (n = 4) and Mtor cKO embryo (n = 4) thymi. (E) Representative flow cytometry data and frequency of mTECs and cTECs from thymi of WT (n = 4) and Mtor cKO embryos (n = 4). (F) Absolute cell numbers of mTECs and cTECs from control (n = 4) and Mtor cKO embryo (n = 4) thymi. (G) FACS plots and quantification of MHC IIhigh TECs from the thymi of control (n = 4) and Mtor cKO embryos (n = 4). (H) Absolute cell numbers of MHC IIhigh TECs from the thymi of control (n = 4) and Mtor cKO embryos (n = 4). (I) FACS plots and quantification of LY75+ cells within TECs from control (n = 4) and Mtor cKO embryo (n = 4) thymi. (J) Absolute cell numbers of LY75+ TECs from control (n = 4) and Mtor cKO embryo (n = 4) thymi. *P<0.05, **P<0.01 and ***P<0.001 compared with control group.
TEC-specific deletion of Mtor caused severe thymic atrophy
Next, we examined the effects of Mtor deficiency on TEC development and differentiation after birth. At 2 wk of age, the thymi of Mtor cKO mice were much smaller as compared to control thymi (A), the ratio of thymus weight to body weight and the absolute thymocyte numbers decreased dramatically in Mtor cKO mice (P<0.001, B). Anatomically, the thymus can be divided into KRT5 (keratin 5)-expressing medulla and KRT8-expressing cortex. We observed a more severe reduction of the medulla compartment in Mtor cKO mice, as shown by staining with H&E or with antibodies against KRT5 and KRT8 (C, D).
Figure 3. TEC-specific deletion of Mtor caused severe thymic atrophy. (A) Representative thymus pictures of 2-wk-old Mtor cKO and wild-type littermate control mice. Scale bar: 5 mm. (B) The ratio of thymus weight to body weight and total thymocyte numbers in 2-wk-old WT (n = 7) and Mtor cKO mice (n = 8). (C) H&E staining of the thymi from 2-wk-old WT and Mtor cKO mice is shown. Scale bars: 1000 μm. (D) Frozen thymic sections derived from 2-wk-old Mtor cKO mice and littermates for the expression of KRT5 (red) and KRT8 (green). Scale bars: 300 μm. (E) Flow cytometric profiles and frequency of TECs (PTPRC− EPCAM+) isolated from 2-wk-old Mtor cKO mice (n = 5) and WT littermates (n = 7). (F) Absolute cell numbers of TECs isolated from 2-wk-old Mtor cKO mice (n = 5) and littermates (n = 7). (G) Representative flow cytometry data and frequency of mTECs and cTECs from 2-wk-old WT (n = 14) and Mtor cKO mice (n = 11). (H) Absolute cell numbers of mTECs and cTECs from 2-wk-old WT (n = 14) and mutant mice (n = 11). (I) Flow cytometric staining of MHC II, AIRE, CD80 and CD40 within mTECs from 2-wk-old WT (n = 5) and Mtor cKO mice (n = 5). (J) Frequency of MHC IIhigh, CD80+, CD40+ and AIRE+ mTECs from 2-wk-old WT (n = 5) and Mtor cKO mice (n = 5). (K) Absolute cell numbers of MHC IIhigh, CD80+, CD40+ and AIRE+ mTECs from 2-wk-old WT (n = 5) and Mtor cKO mice (n = 5). *P<0.05, **P<0.01 and ***P<0.001 compared with control group.
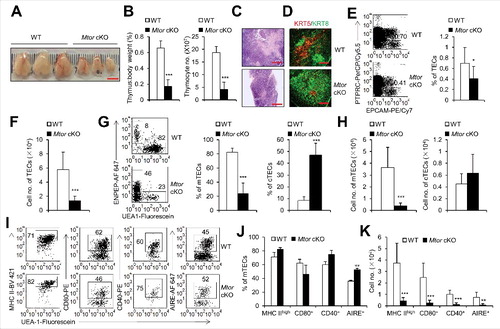
We found that the absolute number of TECs in Mtor cKO mice decreased significantly while the percentage of TECs showed only a slight but significant decrease in Mtor cKO mice as compared to wild-type littermates (P<0.05, E, F, and Figure S4A). Furthermore, the cell size of Mtor cKO TECs also decreased as shown by the forward scatter (P<0.001, Figure S5A, B), supporting that MTOR is important for cell size control. We further demonstrated that the percentage of mTECs decreased dramatically in Mtor cKO mice whereas the relative percentage of cTECs increased (P<0.001, G, and Figure S4A), which might be due to the reduction of mTECs in all TEC compartments. Indeed, the absolute cell number of mTECs decreased significantly but the number of cTECs had no obvious change in Mtor cKO mice (H). As mentioned previously, mTECs represent a heterogeneous stromal population, which has different expression levels of MHC II, CD40, CD80 and AIRE. The frequencies of MHC IIhigh, CD40+, CD80+ and AIRE+ mTECs are comparable between WT and Mtor cKO mice (I, J, and Figure S4), but the cell number of these mature mTECs was reduced significantly (P<0.01, K). Collectively, these results showed that TEC-specific deletion of Mtor caused significant reduction of mature mTECs, which are critical for the induction of central immune tolerance.
The decreased TEPCs and the poor proliferative ability of mTECs in Mtor cKO mice
MTOR signaling is critical for the maintenance of progenitor and stem cells in various tissues. MTOR is involved in the maintenance of neural stem and progenitor cells [Citation32] and controls the survival of retinal progenitor cells under hypoxic and superoxide stress [Citation33]. In addition, MTOR regulates the proliferation of megakaryocyte progenitors and their differentiation at its late stages [Citation34]. It has been shown that the monoclonal antibody MTS24 (mouse thymic stroma 24) marks TEPCs that could differentiate into both mTECs and cTECs [Citation35,Citation36]. We found that both the frequency and cell number of MTS24+ TECs decreased significantly after TEC-specific deletion of Mtor (P<0.01, A, B, and Figure S6A), which is consistent with the reduction of LY75+ progenitor cells at the embryonic stage. Furthermore, in the in vitro TEC culture system, the clone-forming ability of Mtor cKO TECs was severely impaired as shown by the reduced colony sizes compared with control TECs (E). Thus, MTOR is required for the maintenance and self-renewal or proliferation of TEPCs.
Figure 4. TEC-specific deletion of Mtor caused increased autophagy and attenuation of WNT signaling. (A) Representative FACS plots and frequency of TECs for the staining of MTS24 in 2-wk-old WT (n = 4) and Mtor cKO mice (n = 4). (B) Absolute cell numbers of MTS24+ TECs from 2-wk-old WT (n = 4) and Mtor cKO mice (n = 4). (C) 1-wk-old Mtor cKO mice (n = 3) and littermate controls (n = 3) were injected intraperitoneally with BrdU (BD Biosciences, 1 mg per mouse). Twenty-four h after injection, the nuclear staining of BrdU in mTECs and cTECs were shown. (D) The frequency of BrdU+ mTECs and cTECs. (E) Representative pictures of cultured primary TECs from newborn WT and Mtor cKO mice. Scale bars: 200 μm. (F) Representative flow cytometry plots and frequency of TECs for the staining of CYTO-ID in WT (n = 4) and Mtor cKO mice (n = 4). (G) Representative flow cytometry plots and frequency of mTECs and cTECs for the staining of CTNNB1 in WT (n = 3) and Mtor cKO mice (n = 3). (H) Western blot results for the expressions of LC3, DVL2, CTNNB1 and phosphorylated CTNNB1 in 1C6 mTEC cells in the absence (left line) or presence (right line) of 2 μM RPM for 24 h. The expression of these proteins under RPM treatment was normalized to the ones without RPM treatment. (I) Representative FACS plots for the expression of UEA-1 in TECs of WT (n = 4) and Mtor cKO (n = 3) E16.5 thymi treated with 1.5 mM 3-MA for 4 d. (J) Statistical analysis of the frequency of mTECs in TECs of WT (n = 4) and Mtor cKO (n = 3) E16.5 thymi treated with 1.5 mM 3-MA for 4 d. (K and L) E16.5 WT and Mtor cKO thymi were treated with 1.5 mM 3-MA for 4 d and the expression of CTNNB1 in KRT5+ mTECs was detected by immunofluorescence. Scale bars: 50 μm. **P<0.01 and ***P<0.001 compared with control group.
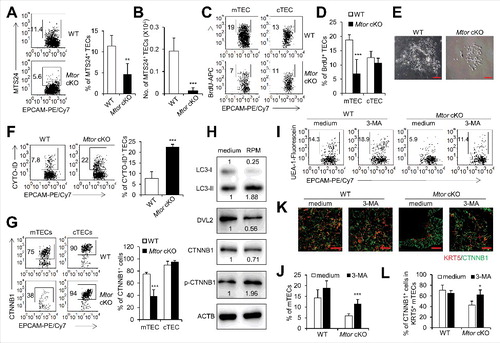
Given that MTOR regulates cell proliferation and growth [Citation37], we thus assessed the proliferation of TECs in Mtor cKO mice using the 5-bromo-2'-deoxyuridine (BrdU) incorporation assay. Indeed, the proliferation of mTECs decreased dramatically while the proliferation of cTECs decreased to a slight degree in Mtor cKO mice as compared to wild-type mice (P<0.001, C, D, and Figure S6B). We also used an MKI67/KI-67 staining assay to examine the proliferation of mTECs and cTECs after inhibition of MTOR activity with RPM and similar results were obtained (P<0.001, Figure S7A, B). Therefore, Mtor deficiency caused the poor proliferative ability of TECs, especially the mTECs.
Mtor regulates the expression of CTNNB1/Beta-Catenin through autophagy
The differentiation of mTECs depends on TNFRSF11A and LTBR [Citation8]. We found even higher percentages of Mtor cKO mTECs expressing TNFRSF11A and LTBR than controls (P<0.05, Figure S8A, B), suggesting that the defect of mTECs in Mtor cKO mice may be unlikely caused by impaired TNFRSF11A and LTBR expression.
It is well known that MTOR inhibits autophagy induction [Citation38]. Gao et al report that autophagy can negatively regulate WNT signaling [Citation39], in the report, they demonstrate that the enhanced autophagy promotes the degradation of DVL2 (dishevelled segment polarity protein 2) and results in the attenuation of WNT signaling [Citation39]. Based on these findings, we hypothesize that Mtor deficient TECs might display high constitutive level of autophagy. We thus measured the autophagy of TECs with specific deletion of Mtor by using a CYTO-ID autophagy detection kit [Citation40,Citation41] Indeed, we observed an increased CYTO-ID staining pattern in TECs with Mtor deficiency, indicating that the autophagy of TECs in Mtor cKO mice was increased as compared to wild-type TECs (P<0.001, F). Similar results were obtained by detecting a higher level of autophagy of the in vitro cultured mTEC cell line 1C6 cells after inhibition of MTOR activity by RPM (P<0.001,Figure S8C).
The WNT signaling pathway plays important roles in regulating the expansion and differentiation of TECs. In the absence of WNT ligand, CTNNB1 is associated with a cytoplasmic complex containing CSNK1A1, GSK3B, AXIN1 and APC, which promotes phosphorylation of CTNNB1 leading to its degradation [Citation42]. Binding of WNT ligand to their receptors activates DVL2, which then inhibits the ability of GSK3B leading to accumulation of free and unphosphorylated CTNNB1 in the cytoplasm, which then translocates to the nucleus [Citation43]. The absence of Wnt4 suppresses fetal and postnatal thymic expansion and leads to decreased TEC numbers [Citation12]. Conditional ablation of Ctnnb1 in KRT5+-TECs and their progeny cells results in thymic atrophy, decreased percentage of mTEC and increased percentage of cTEC [Citation44]. In line with the increased autophagy in Mtor cKO TECs, the expression of CTNNB1, a downstream molecule of WNT signaling, was decreased in mTECs of Mtor cKO mice as compared to wild-type littermates (P<0.001, G, Figure S6D). We then measured the expression of DVL2, phosphorylated CTNNB1 and active CTNNB1 by western blots in the 1C6 mTEC cell line upon inhibition of MTOR activity by RPM. The expression of MAP1LC3A-II/LC3A-II was increased upon RPM treatment, indicating the autophagy increased with MTOR inhibition in the 1C6 mTEC cell line (H). In addition, we noticed that the expression of DVL2 and active CTNNB1 decreased and meanwhile the expression of phosphorylated CTNNB1, the inactive form of CTNNB1, increased markedly (H). Collectively, these data indicated that inhibition of MTOR activity attenuated WNT signaling via increasing autophagy pathway.
To investigate whether the marked reduction of mTECs in Mtor cKO mice is mediated by enhanced autophagy, we examined whether inhibition of autophagy can rescue the reduction of mTECs caused by Mtor deficiency. With an in vitro fetal thymus organ culture (FTOC) system, we demonstrated that adding the autophagy inhibitor 3-methyladenine (3-MA) partially but significantly rescued the reduction of mTECs in Mtor cKO mice by inhibition of autophagy (P<0.001, I, J, and Figure S6E), indicating that the increased autophagy in TECs with Mtor deficiency indeed contributed to the reduction of mTECs. Furthermore, the expression of CTNNB1 in KRT5-positive mTECs was also partially rescued upon inhibition of autophagy by 3-MA (P<0.05, K, L).
Thymocyte development was blocked in Mtor cKO mice
TECs are critical for the development, differentiation and maturation of thymocytes [Citation5]. We thus further explored the functional consequences of impaired mTEC development in Mtor cKO mice by examining the development of thymocytes. Compared with control mice, Mtor cKO mice displayed a remarkable reduction of the cell numbers of CD4+ SP, CD8+ SP, DP and DN thymocytes, albeit the frequency of CD4+ SP and CD8+ SP thymocytes only decreased slightly (P<0.05, A, B; P<0.01, C, and Figure S9A). After negative selection, thymocytes undergo further maturation in the thymus before they egress as naïve T cells to the periphery [Citation45]. This postselection maturation process is marked by phenotypic and functional changes, including the downregulation of both CD24A/CD24 and CD69 expression and increased expression of SELL/CD62L (selectin, lymphocyte) and QA2/QA-2 (Qa lymphocyte antigen 2 region) [Citation46–48]. In the thymi of Mtor cKO mice, the frequency of mature thymocytes (T cell receptor beta chain [TCRB]high CD24low SELLhigh) decreased significantly and the frequency of immature thymocytes (TCRBhigh CD24high SELLlow) increased in both CD4+ SP and CD8+ SP thymocytes as compared to wild-type mice (P<0.01, D, E, and Figure S10A). Meanwhile, the frequency of TCRBhigh CD24high CD69high in both CD4+ SP and CD8+ SP thymocytes increased in Mtor cKO mice (P<0.05, Figure S10B) while the expression of QA2 in both CD4+ SP and CD8+ SP thymocytes decreased markedly in Mtor cKO mice (P<0.05, Figure S10C). Altogether, these findings suggested that the developmental defect of mTECs caused by Mtor deletion significantly blocked the maturation of CD4+ SP and CD8+ SP thymocytes.
Figure 5. Development of thymocytes was blocked in Mtor cKO mice. (A) Representative flow cytometry profiles of thymocytes for the expression of CD4 and CD8 derived from 2-wk-old Mtor cKO mice (n = 6) and littermate controls (n = 6). (B) Statistical analysis of thymocytes for distribution of CD4 SP, CD8 SP, DP and DN from 2-wk-old Mtor cKO mice (n = 6) and littermate controls (n = 6). (C) Absolute cell numbers of CD4 SP, CD8 SP, DP and DN thymocytes from 2-wk-old Mtor cKO mice (n = 6) and littermate controls (n = 6). (D) Flow cytometry profiles of CD4+ CD8− TCRBhigh or CD4− CD8+ TCRBhigh thymocytes for the expression of CD24 and SELL. (E) Frequency of mature thymocytes of 2-wk-old Mtor cKO mice (n = 4) and littermate controls (n = 4). Mature thymocytes are CD24low SELLhigh TCRBhigh CD4+ CD8− or CD4− CD8+. Flow cytometry profiles (F), frequency (G) and absolute numbers (H) of thymic Treg cells from 2-wk-old WT (n = 4) and Mtor cKO mice (n = 4). (I) Flow cytometry profiles of thymic Treg precursors (CD4+ CD8− IL2RA+ FOXP3−) in 2-wk-old WT (n = 7) and Mtor cKO mice (n = 7). (J) The ratio of thymic CD4+ CD8− IL2RA+ FOXP3− Treg precursors to mature CD4+ CD8− IL2RA+ FOXP3+ Treg cells in 2-wk-old WT (n = 7) and Mtor cKO mice (n = 7). Flow cytometry profiles (K) and the frequency (L) of SELL+ CD45RBint recent thymic emigrants (RTEs) in the spleen of 4-wk-old WT (n = 3) and Mtor cKO mice (n = 3). After gating on CD4+ cells, RTEs are SELL+ CD45RBint. Flow cytometry plots (M), frequency (N) and absolute cell numbers (O) of CD4+ and CD8+ T cells in the spleen of 4-wk-old WT (n = 3) and Mtor cKO mice (n = 3). *P<0.05, **P<0.01 and ***P<0.001 compared with control group.
In addition, thymic medulla provides crucial microenvironments for the development of FOXP3 (forkhead box P3)-expressing regulatory T cells (Tregs) which is essential for the induction of central immunological tolerance [Citation3,Citation49]. We found that both the percentage and absolute cell number of CD4+ CD8− FOXP3+ Treg cells were reduced remarkably in the thymi of Mtor cKO mice (P<0.001, F to H, and Figure S9C). The mature CD4+ CD8− IL2RA+ FOXP3+ Treg cells develop from CD4+ CD8− IL2RA+ FOXP3− precursors in thymus [Citation50], so we investigated the ratio of CD4+ CD8− IL2RA+ FOXP3− Treg precursors to mature CD4+ CD8− IL2RA+ FOXP3+ Treg cells and found this ratio increased significantly in Mtor cKO mice (P<0.01, I, J, and Figure S9C), indicating the development of CD4+ CD8− IL2RA+ FOXP3+ Treg cells was blocked at the Treg precursor stage which might due to the impaired thymic medulla microenvironments.
Functional mature naïve T cells egress from thymus and populate the peripheral lymphoid organs. To this end, we measured the recent thymic emigrants (RTEs) with the phenotype of CD3E/CD3+ CD4+ SELL+ CD45RBint in the spleen [Citation51]. We found that the RTEs decreased considerably in Mtor cKO mice as compared to their littermate controls (P<0.01, K, L, and Figure S9D). Meanwhile, both the percentages and cell numbers of CD4+ and CD8+ T cells were distinctly reduced to a large extent in the spleen of Mtor cKO mice (P<0.001, M to O). Thus, we conclude that the function of the thymus was severely impaired after TEC-specific deletion of Mtor, as evidenced by the decreased output of mature T cells into the peripheral tissues.
Mice with TEC-specific deletion of Mtor spontaneously develop autoimmune disease
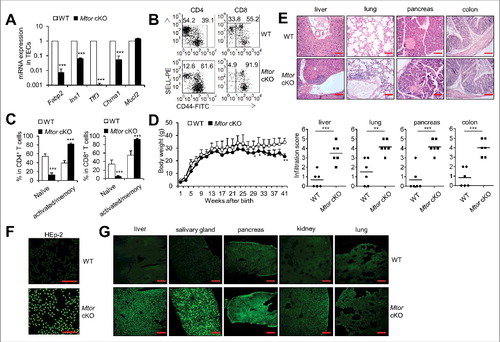
Mature mTECs expressing TRAs are essential for the induction of central immune tolerance to the peripheral tissue antigens. We therefore measured the expression profile of various TRAs in TECs from Mtor cKO mice and control mice. As expected, Mtor-deficient TECs express markedly reduced TRAs including Fabp2, Ins1, Tff3 and Chrna1 as compared to wild-type counterparts (P<0.001, A), although Mucl2 was expressed at similar level as detected by real-time PCR (A). The poor expression of TRAs due to Mtor deficiency in TECs might predict the susceptibility to the development of autoimmune diseases. We then investigated the T cell activation state, pathological tissue changes and the presence of auto-antibodies in Mtor cKO mice. First, we found that both CD4+ and CD8+ T cells from Mtor cKO mice displayed significantly lower proportions of SELL+ CD44− naïve T cells and higher proportions of CD44+ activated or memory T cells in spleen as compared to wild-type littermates (P<0.001, B, C, and Figure S11), implying the higher activation status of T cells in these Mtor cKO mice. Secondly, we noticed that the body weight of Mtor cKO mice was lower than wild-type littermate controls with age (P<0.05, D). Importantly, 6- to 8-mo-old Mtor cKO mice displayed signs of reduced general health including hunched posture, decreased activity and hair slip, while their wild-type littermates were healthy. As expected, substantial mononuclear cell infiltrations were present in the liver, lung, pancreas and colons of 6- to 8-mo-old Mtor cKO mice (P<0.01, E). Moreover, 6- to 8-mo-old Mtor cKO mice had high levels of antinuclear antibodies (F and Figure S12A) and various tissue-cell-reactive autoantibodies (G and Figure S12B), which were rarely observed in age-matched wild-type control mice. There were also substantial CD3+ T cell infiltrations into the liver, colon, kidney and lung of old Mtor cKO mice as compared to age matched littermate controls (Figure S12C). Taken together, our data support the fact that mice with TEC-specific Mtor deficiency develop severe autoimmune diseases, likely due to the impaired mTEC differentiation and/or Treg development.
Figure 6. TEC-specific deletion of Mtor caused severe autoimmune disease. (A) Expression of the indicated TRAs in Mtor cKO mice (black bars), relative to expression found in WT littermates (white bars). (B) Flow cytometry plots of splenic CD4+ or CD8+ T cells for the cell surface staining of CD44 and SELL from 4-wk-old WT (n = 4) and Mtor cKO mice (n = 4). (C) Frequency of naïve (SELL+ CD44−) and activated (CD44+) cells in splenic CD4+ or CD8+ T cells from 4-wk-old WT (n = 4) and Mtor cKO mice (n = 4). (D) The body weight curve of WT and Mtor cKO mice at the indicated age. (E) Paraffin-embedded sections of organs from 6- to 8-mo-old WT (n = 4) and Mtor cKO mice (n = 4) were stained with H&E and evaluated for the presence of infiltrates by light microscopy. Individual scores (n = 6 for WT; n = 6 for Mtor cKO) and means (bars) are indicated. Scale bars: 200 μm. (F) Sera of 6- to 8-mo-old WT (n = 4) and Mtor cKO (n = 4) mice were used to stain HEp-2 cells, and the presence of antinuclear antibodies (ANAs) was revealed by anti-mouse IgG-Alexa Fluor 488 antibody and fluorescence microscopy. Scale bars: 200 μm. (G) Tissue-reactive autoantibodies in the sera of 6- to 8-month-old WT (n = 4) and Mtor cKO mice (n = 4) were examined using various tissue sections of rag2−/− mice. *P<0.05, **P<0.01 and ***P<0.001 compared with control group. Scale bars: 200 μm.
Discussion
In the present study, we uncovered that MTOR signaling critically regulates the development and maintenance of TECs, and in particular mTECs, which are essential for the induction of central immune tolerance. More importantly, TEC-specific Mtor deficiency leads to spontaneous development of autoimmune diseases with age. Mechanistically, Mtor is essential to maintain TEC proliferation and keep proper activation of WNT signaling in TECs by blocking autophagy-mediated degradation of DVL2 and CTNNB1 (Figure S13).
RPM critically modulates the differentiation of T cells, B cells and the production of inflammatory cytokines in innate immune cells [Citation22,Citation52,Citation53]. It is known that RPM treatment prevents the proliferation of thymocytes and causes thymic involution [Citation54], but the effect of RPM on TECs has not been fully studied. Here, we show that RPM treatment results in the reduction of mTECs, in particular the AIRE+ mTECs, which could mediate central tolerance induction. These findings were further proven with TEC-specific Mtor-deficient mice and collectively demonstrate that the MTOR signaling pathway critically regulates the development and maintenance of TECs in a cell-intrinsic manner.
The development and homeostasis of TECs are tightly controlled. The NFKB signaling pathway is important for maturation of mTECs and WNT signaling promotes the expansion and functional maintenance of TECs. MTOR signaling plays critical roles in cell proliferation, differentiation, autophagy and metabolism, but the importance of MTOR signaling in TECs and its functional consequences on T cell development and tolerance has not been sufficiently investigated. Here, we found that MTOR signaling played important roles in the development of TECs both at the embryonic and postnatal stages. In the embryonic 16.5 thymi, TEC-specific deletion of Mtor resulted in the decrease of both mTECs and cTECs and the reduction of LY75+ TEPCs. We also found that the TEPCs detected by the MTS24 antibody decreased significantly in postnatal Mtor cKO mice, which is consistent with previous reports showing that MTOR is essential for the maintenance of stem and progenitor cells in various tissues [Citation32–34]. Mtor deficiency in TECs led to the marked reduction of mTECs as compared to cTECs, implying that mTECs development, functional maturation and maintenance require proper MTOR activity.
Intriguingly, we showed that deletion of Mtor led to enhanced autophagy in TECs which resulted in the attenuation of WNT signaling by degradation of DVL2 and CTNNB1. In the FTOC system, treatment of Mtor cKO thymi with autophagy inhibitor 3-MA could largely rescue the decrease of mTECs, demonstrating that the reduction of mTECs was, at least in part, caused by enhanced autophagy. The significance of WNT signaling in TEC biology has been well described [Citation12,Citation44]. Heinonen and colleagues have demonstrated that Wnt4 regulates the expansion of TECs and the ratio of medullary-to-cortical TEC and absence of Wnt4 results in thymic atrophy [Citation12]. Liang et al. have shown that Ctnnb1 is required in KRT5-expressing TECs for thymic homeostasis and function. Conditional ablation of Ctnnb1 in KRT5-expressing TECs results in thymic atrophy [Citation44]. Altogether, we conclude that Mtor deletion in TECs lead to severe thymic atrophy through autophagy-dependent degradation of DVL2 and thus attenuated CTNNB1 signaling.
The key role of TECs is to support proper development and maturation of thymocytes. Consistent with the impaired medulla compartment in Mtor cKO mice, we indeed observed a decreased frequency of CD4+ SP and CD8+ SP thymocytes and the blocked maturation of CD4+ SP or CD8+ SP cells as assessed by the expression of CD24, SELL, CD69 and QA2. The thymic medullary microenvironment also provides essential niches for the development of thymic Treg cells [Citation55,Citation56]. We showed that the development of CD4+ CD8− IL2RA+ FOXP3+ Treg cells was partially blocked at the CD4+ CD8− IL2RA+ FOXP3− precursor stage. Autoreactive TCR clones are eliminated in thymus by negative selection, the decreased quantity of mTECs and their impaired maturation might lead to the escape of autoreactive T cells to peripheral tissues [Citation3]. Indeed, 6- to 8-mo-old Mtor cKO mice developed severe autoimmune diseases characterized by the intensive infiltration of immune cells in various tissues and the presence of autoantibodies against nuclear antigens. It is thus likely that the poor induction of TRAs in mTECs together with the decreased production of immunosuppressive CD4+ CD8− IL2RA+ FOXP3+ Treg cells in the thymus contribute to the development of autoimmune diseases in mice with a TECs-specific Mtor deletion.
In summary, our present study provides new insights to our understanding of the molecular mechanisms governing the homeostasis and functional maturation of TECs, which is closely related to proper cellular immunity and host immune tolerance.
Materials and methods
Mice
TEC-specific Mtor conditional knockout mice were obtained by crossing Mtorflox/flox mice with Foxn1-Cre mice. Foxn1-Cre-negative, Mtorflox/flox littermates served as control. Mtorflox/flox mice were a gift of Dr. Zhongzhou Yang from Center of Model Animal Research at Nanjing University, China [Citation25,Citation57]. Foxn1-Cre mice were a gift of Dr. Yu Zhang from Peking University Health Science Center, Beijing, China. All mice for this study were maintained under pathogen-free conditions. All animal experiments were performed in accordance with the approval of the animal Ethics Committee of Institute of Zoology, Beijing, China.
Abs and flow cytometry
For all staining, the samples were first incubated with 2.4G2 before staining with fluorochrome-conjugated antibodies. Fluorescein-labeled (Vector Laboratories, FL-1061) and rhodamine-labeled (Vector Laboratories, RL-1062) Ulex Europaeus Agglutinin I (UEA I) was purchased from Vector Laboratories. MKI67/KI-67-PE (556027) and Alexa Fluor 488 mouse anti-CTNNB1/BETA-CATENIN (562505) were purchased from BD Biosciences. The following antibodies were purchased from BioLegend or eBioscience: PerCP/Cy5.5, FITC, PE, PE/CY7, APC, APC/CY7, Brilliant Violet-421 or Alexa Fluor 647-conjugated anti-PTPRC/CD45 (BioLegend, 103132; clone 30-F11), EPCAM/CD326 (BioLegend, 118215; EPCAM, clone G8.8), I-A/I-E (BioLegend, 107632; clone M5/114.15.2), CD40 (BioLegend, 124610; clone 3/23), CD80 (eBioscience, 12-0801-82; clone 16-10A1), ENPEP/LY51 (BioLegend, 108312 and 108314; clone 6C3), AIRE (eBioscience, 50-5934-80; clone 5H12), TNFRSF11A/RANK (eBioscience, 12-6612-82; clone R12-31), LTBR (BioLegend, 134403; clone 5G11), CD4 (BioLegend, 100406 and 100412 and 100414; clone GK1.5), CD8 (BioLegend, 100710; clone 53–6.7), CD24 (eBioscience, 11-0242-82; clone M1/69), SELL/CD62L (eBioscience, 12-0621-82; clone MEL-14), IL2RA/CD25 (eBioscience, 12-0251-82; clone PC61.5), FOXP3 (eBioscience, 11-5773-82; clone FJK-16s), CD45RB (eBioscience, 11-0455-82; clone C363.16A), CD44 (BioLegend, 103055; clone IM7), LY75/CD205 (eBioscience, 12-2051-82; clone 205yekta), CD69 (eBioscience, 48-0691-82; clone H1.2F3), QA2 (BioLegend, 121709; clone 695H1-9-9), TCRB (BioLegend, 109222; clone H57-597). MTS24 Ab was kindly offered by Prof. Richard Boyd (Monash University). Surface staining of cell suspensions was performed in phosphate-buffered saline (PBS; ZSGB-BIO, ZLI-9062) containing 0.1% BSA (Solarbio, A8020), 0.02% NaN3 at 4°C. Intracellular staining for FOXP3, AIRE, CTNNB1 and MKI67 was performed using fixation buffer (eBioscience, 00-5123-43 and 00-5223-56) and permeabilization buffer (eBioscience, 00-8333-56) according to the manufacturer's protocol and previous experience [Citation58]. Briefly, cells were fixed with 250 μL fixation buffer per 1 × 10⁶ cells on ice for 30 min. Cells were then washed twice with perm wash buffer and then stained with diluted antibodies. The flow cytometry was performed with a Gallios Flow Cytometer (BeckMan Coulter, Brea, California, USA).
Rapamycin treatment in vivo
Rapamycin (Sigma-Aldrich, 37094) was dissolved in carboxymethyl cellulose sodium (CMC; Sigma-Aldrich, C5013) [Citation59]. Four-wk-old C57BL/6 mice were injected intraperitoneally with RPM (1.5 mg/kg body weight) or CMC every day for 7 d as described previously [Citation60].
Thymic stromal cell isolation
Thymic stromal cells from postnatal thymi were isolated as previously described [Citation9,Citation61]. In brief, freshly dissected thymi were cut into pieces and washed with DMEM (Hyclone Laboratories, SH30022.01B) medium with 2% fetal bovine serum (FBS; Gibco, 16000–044) several times to remove most thymocytes. The thymic fragments were then incubated at 37°C for 10 min in 2 ml solution of 1 mg/ml collagenase D (Sigma-Aldrich, C0130; equivalent to 0.1% [w/v]) with 20 U/ml DNAse I (Sigma-Aldrich, D5025). Enzymatic treatment was repeated 3 times (the final incubation with collagenase-dispase [Sigma-Aldrich, 11097113001; equivalent to 0.1% {w/v}] enzyme mixture) until all fragments dispersed. Gentle agitation was performed periodically at middle- and end-points of each digestion. Cell suspensions from each digestion were pooled in PBS (ZSGB-BIO, ZLI-9062) containing 1% FBS and 5 mM ethylenediamine tetraacetic acid (EDTA; Sigma-Aldrich, ED) to neutralize digestion and remove cell aggregates. Cells were centrifuged, resuspended in DMEM with 2% FBS medium, and filtered to remove clumps. Phenotypes of TECs were analyzed by FACS staining.
Culture of TECs
For primary TEC culture, thymi from WT and Mtor cKO neonatal mice were digested as mentioned above. Small thymic fragments from each step were collected and pooled. Fragments were allowed to settle and washed twice with CnT07 medium (CELLnTEC, CnT-BM.4). The remaining thymic explants were plated in 24-well plates with CnT07 medium and cultured at 37°C with 5% CO2 for 2 or 3 d, during which TECs outgrew other stromal cells [Citation9].
Fetal thymus organ culture
Embryos from time-mated females (morning of plug control correspond to E0.5) were harvested at E16.5, thymic lobes were isolated, placed on the top of Nuclepore filters (Whatman, 110409) placed in DMEM medium containing 10% FBS with or without 1.5 mM 3-MA (Sigma-Aldrich, M9281) for 4 d. Subsequently the fetal thymi were digested in collagenase D and DNase I for 45 to 60 min, filtered, centrifuged and stained for flow cytometric analysis.
Immunohistology and Immunofluorescence
For analysis of thymic medulla and cortex by immunohistology, thymi from Mtor cKO mice and littermate control mice were fixed in 4% formalin and embedded in paraffin blocks. Sections (5 μm) were stained with H&E and examined by light microscopy (Olympus IX71, Tokyo, Japan). For immunofluorescence, serial sections (6 μm) from optimum cutting temperature (OCT; SAKURA, 4583)-embedded frozen thymi were fixed in 4% polyoxymethylene (Solarbio, P1110) and blocked in PBS-1% BSA, washed in PBS-0.05% Tween (TeaSen, 60305ES76) and incubated with antibodies. The processed sections were stained with primary antibodies as follows: rabbit anti-KRT5 (Covance, PRB-160P; clone AF 138) diluted by 1:400 and rat anti-KRT8 (DSHB, AB 531826; Troma-I) diluted by 1:200. The secondary antibodies were as follows: Alexa Fluor 594-conjugated donkey anti-rabbit IgG (H+L) (Jackson ImmunoResearch Laboratories, 711-586-152) diluted by 1:400 and Alexa Fluor 488-conjugated donkey anti-rat IgG (H+L) (Jackson ImmunoResearch Laboratories, 712-546-150) diluted by 1:400. Nuclei were stained with 4′6-diamidino-2-phenylindole (DAPI; Sigma-Aldrich, D9542). Images were acquired with a laser scanning confocal microscope (Zeiss LSM710, Oberkochen, Germany).
Detection of inflammatory cell infiltration and autoantibodies
The organs of 6- to 8-mo-old mice were harvested and fixed in 4% paraformaldehyde, embedded in paraffin (Leica, 39601095), sectioned (5 μm), and stained with H&E [Citation62]. Sera from 6- to 8-mo-old Mtor cKO and littermate control mice were prepared. For the detection of autoantibodies, serial frozen sections of the lung, pancreas, salivary gland, liver and kidney from rag2−/− mice and cultured HEp-2 cells were incubated with diluted sera in PBS (1:30) followed by Alexa Fluor 488-conjugated donkey anti-mouse IgG (H+L) antibodies (Jackson ImmunoResearch Laboratories, 715-546-150; 1:300).
BrdU incorporation assays
For BrdU labeling, 1-wk-old Mtor cKO and littermate control mice were injected intraperitoneally with BrdU (BD Biosciences, 1 mg per mouse). Twenty-four h after injection, thymic lobes were digested and thymic stromal cells were enriched for flow cytometric analysis. BrdU incorporation was detected with an APC-BrdU flow kit (BD Biosciences, 552598) according to the manufacturer's protocol (BD Pharmingen™ BrdU Flow Kits Instruction Manual). Briefly, after staining cell surface antigens, cells were fixed and permeabilized with the provided buffer, then cells were incubated with 100 μL of diluted DNase for 1 h at 37°C, and appropriate amounts of APC anti-BrdU antibodies were added and incubated for 20 min at room temperature.
Quantitative RT-PCR
RNA was purified from WT and Mtor cKO TECs sorted with a MoFlo XDP cell sorter (Beckman Coulter, Brea, CA, USA) and characterized as PTPRC/CD45− EPCAM+. Total RNA was extracted using MicroElute Total RNA Kits (Omega Bio-tek, R6831) and reverse transcription was performed with SuperScript III Reverse Transcriptase (Invitrogen, 18080–093) according to manufacturer's instructions. Briefly, oligos were mixed together with dT (Thermo Fisher Scientific, 18418-012), dNTP (Invitrogen, 18427-013), and RNA; then the mixture was heated at 65°C for 5 min and incubated on ice for at least 1 min; 5XFirst-Strand Buffer, DTT, and SuperScript™ III RT were subsequently added and incubated at 50°C for 30 to 60 min. Real-time PCR was performed using multiple kits (TaKaRa SYBR Premix Ex TaqTM, RR420) on a CFX96 apparatus (Bio-Rad Laboratories, Hercules, CA, USA). The primers using in this study are listed in .
Table 1. The list of primers used in qPCR assays.
Western blot assay
The 1C6 mTEC cell line was cultured in DMEM medium with 10% FBS in 12-well plates. Cells were treated with 2 μM RPM for the indicated time. Then cells were washed with cold PBS, lysed in Radio-Immunoprecipitation Assay (RIPA) buffer (50 mM Tris-HCl, pH 7.4, 1% NP-40 [Abcam, ab142227], 0.25% Na-deoxycholate [Macklin, S817543], 150 mM NaCl, 1 mM EDTA, pH 7.4) with a protease inhibitor cocktail (Sigma-Aldrich, P8340). Protein concentration was determined using a bicinchoninic acid (BCA) assay. Proteins were analyzed by SD (Sigma-Aldrich, L5750)-polyacrylamide gel electrophoresis (SD-PAGE) and transferred onto PVDF membranes (Merck Millipore, IPFL00010). Each polyvinylidene fluoride membrane was blocked with 5% nonfat dried milk (OXOID, LP0031) for 1 h and then incubated with primary antibodies overnight on a shaker at 4°C. The HPR-coupled anti-mouse (KPL, 074–1806) or anti-rabbit (KPL, 070–1506) secondary antibodies were then added, and were detected through chemiluminescence (Merck Millipore, WBKLS0500) [Citation63]. ACTB was used as a protein loading control. The primary antibodies used for western blot are as follows: Anti-LC3A/B (Sigma-Aldrich, L7543) diluted by 1:1000; DVL2 (30D2) rabbit monoclonal antibody (Cell Signaling Technology, 3224) diluted by 1:1000; non-phospho (active) CTNNB1 rabbit monoclonal antibody (Cell Signaling Technology, 8814; D13A1) diluted by 1:1000; phospho-CTNNB1 antibody (Cell Signaling Technology, 9561) diluted by 1:1000; anti-ACTB (Sigma-Aldrich, A5441) diluted by 1:20,000.
Statistical analysis
All data are presented as the means±SD. A Student unpaired t test for comparison of means was used to compare groups. A P value of<0.05 was considered statistically significant.
Disclosure of potential conflicts of interest
The authors have no competing financial interests.
KAUP_A_1376161_SUPPLEMENT.ppt
Download MS Power Point (3.8 MB)Acknowledgments
The authors wish to thank Dr. Xiaoping Zhong for his critical review of the manuscript and constructive suggestions. This work was supported by grants from the National Natural Science Foundation of China for General and Key Programs (C81130055, C81530049, C81072396, Y.Z.), the Ministry of Science and Technology of China (2017YFA0105002), Beijing Municipal Hospital Authority Yangfan Program (ZYLX201408, X.Z.), CAS China Manned Space Flight Engineering Project of life science experiments (TZ-1), Knowledge Innovation Program of Chinese Academy of Sciences (XDA04020202-19, Y.Z.), and the CAS/SAFEA International Partnership Program for Creative Research Teams (Y.Z.).
Related Research Data
References
- Alexandropoulos K, Danzl NM. Thymic epithelial cells: Antigen presenting cells that regulate T cell repertoire and tolerance development. Immunol Res. 2012;54:177–190. doi:10.1007/s12026-012-8301-y. PMID:22454100
- Takada K, Ohigashi I, Kasai M, et al. Development and function of cortical thymic epithelial cells. Curr Top Microbiol Immunol. 2014;373:1–17. PMID:23612989
- Anderson G, Baik S, Cowan JE, et al. Mechanisms of thymus medulla development and function. Curr Top Microbiol Immunol. 2014;373:19–47. PMID:23612988
- Zhang L, Sun L, Zhao Y. Thymic epithelial progenitor cells and thymus regeneration: an update. Cell Res. 2007;17:50–55. doi:10.1038/sj.cr.7310114. PMID:17146450
- Anderson G, Takahama Y. Thymic epithelial cells: working class heroes for T cell development and repertoire selection. Trend Immunol. 2012;33:256–263. doi:10.1016/j.it.2012.03.005. PMID:22591984
- Cowan JE, Parnell SM, et al. The thymic medulla is required for Foxp3+ regulatory but not conventional CD4+ thymocyte development. J Exp Med. 2013;210:675–681. doi:10.1084/jem.20122070. PMID:23530124
- Vaidya HJ, Leon AB, Blackburn CC, et al. FOXN1 in thymus organogenesis and development. Eur J Immunol. 2016;46:1826–1837. doi:10.1002/eji.201545814. PMID:27378598
- Akiyama T, Shinzawa M, Akiyama N, et al. TNF receptor family signaling in the development and functions of medullary thymic epithelial cells. Front Immunol. 2012;3:278. doi:10.3389/fimmu.2012.00278. PMID:22969770
- Sun L, Li H, Luo H, et al. Phosphatase Wip1 is essential for the maturation and homeostasis of medullary thymic epithelial cells in mice. J Immunol. 2013;191:3210–3220. doi:10.4049/jimmunol.1300363. PMID:23966632
- Sun L, Li H, Luo H, et al. Thymic epithelial cell development and its dysfunction in human diseases. Biomed Res Int. 2014;2014:206929. PMID:24672784
- Brunk F, Augustin I, Meister M, et al. Thymic epithelial cells are a nonredundant source of Wnt ligand for thymus development. J Immunol. 2015;195:5261–5271. doi:10.4049/jimmunol.1501265. PMID:26512137
- Heinonen KM, Vanegas JR, Brochu S, et al. Wnt4 regulates thymic cellularity through the expansion of thymic epithelial cells and early thymic progenitors. Blood. 2011;118:5163–5173. doi:10.1182/blood-2011-04-350553. PMID:21937690
- Albert V, Hall MN. mTOR signaling in cellular and organismal energetics. Curr Opin Cell Biol. 2015;33:55–66. doi:10.1016/j.ceb.2014.12.001. PMID:25554914
- Shin J, Wang S, Deng W, et al. Mechanistic target of rapamycin complex 1 is critical for invariant natural killer T-cell development and effector function. Proc Natl Acad Sci USA. 2014;111:E776–E783. doi:10.1073/pnas.1315435111. PMID:24516149
- Zhang L, Tschumi BO, Corgnac S, et al. Mammalian target of rapamycin complex 1 orchestrates invariant NKT cell differentiation and effector function. J Immunol. 2014;193:1759–1765. doi:10.4049/jimmunol.1400769. PMID:25015820
- Delgoffe GM, Kole TP, Zheng Y, et al. The mTOR kinase differentially regulates effector and regulatory T cell lineage commitment. Immunity. 2009;30:832–844. doi:10.1016/j.immuni.2009.04.014. PMID:19538929
- Zhang L, Tschumi BO, Lopez-Mejia IC, et al. Mammalian target of rapamycin complex 2 controls CD8 T cell memory differentiation in a foxo1-dependent manner. Cell Rep. 2016;14:1206–1217. doi:10.1016/j.celrep.2015.12.095. PMID:26804903
- Pollizzi KN, Patel CH, Sun IH, et al. mTORC1 and mTORC2 selectively regulate CD8(+) T cell differentiation. J Clin Invest. 2015;125:2090–2108. doi:10.1172/JCI77746. PMID:25893604
- Araki K, Turner AP, Shaffer VO, et al. mTOR regulates memory CD8 T-cell differentiation. Nature. 2009;460:108–112. doi:10.1038/nature08155. PMID:19543266
- Yang K, Neale G, Green DR, et al. The tumor suppressor Tsc1 enforces quiescence of naive T cells to promote immune homeostasis and function. Nat Immunol. 2011;12:888–897. doi:10.1038/ni.2068. PMID:21765414
- Zhang L, Zhang H, Li L, et al. TSC1/2 signaling complex is essential for peripheral naive CD8+ T cell survival and homeostasis in mice. PLoS One. 2012;7:e30592. doi:10.1371/journal.pone.0030592. PMID:22363451
- Zhang S, Readinger JA, DuBois W, et al. Constitutive reductions in mTOR alter cell size, immune cell development, and antibody production. Blood. 2011;117:1228–1238. doi:10.1182/blood-2010-05-287821. PMID:21079150
- Sathaliyawala T, O'Gorman WE, Greter M, et al. Mammalian target of rapamycin controls dendritic cell development downstream of Flt3 ligand signaling. Immunity. 2010;33:597–606. doi:10.1016/j.immuni.2010.09.012. PMID:20933441
- Powell JD, Pollizzi KN, Heikamp EB, et al. Regulation of immune responses by mTOR. Annu Rev Immunol. 2012;30:39–68. doi:10.1146/annurev-immunol-020711-075024. PMID:22136167
- Zhu L, Yang T, Li L, et al. TSC1 controls macrophage polarization to prevent inflammatory disease. Nat Commun. 2014;5:4696. doi:10.1038/ncomms5696. PMID:25175012
- Wang HX, Shin J, Wang S, et al. mTORC1 in thymic epithelial cells is critical for thymopoiesis, T-cell generation, and temporal control of gammadeltaT17 development and TCRgamma/delta recombination. PLoS Biol. 2016;14:e1002370. doi:10.1371/journal.pbio.1002370. PMID:26889835
- Wang HX, Cheng JS, Chu S, et al. mTORC2 in thymic epithelial cells controls thymopoiesis and T cell development. J Immunol. 2016;197:141–150. doi:10.4049/jimmunol.1502698. PMID:27233961
- Li J, Kim SG, Blenis J, et al. Rapamycin: one drug, many effects. Cell Metab. 2014;19:373–379. doi:10.1016/j.cmet.2014.01.001. PMID:24508508
- Peterson P, Org T, Rebane A. Transcriptional regulation by AIRE: molecular mechanisms of central tolerance. Nat Rev Immunol. 2008;8:948–957. doi:10.1038/nri2450. PMID:19008896
- Nowell CS, Farley AM, Blackburn CC. Thymus organogenesis and development of the thymic stroma. Method Mol Biol. 2007;380:125–162. doi:10.1007/978-1-59745-395-0_8. PMID:17876091
- Baik S, Jenkinson EJ, Lane PJ, et al. Generation of both cortical and Aire(+) medullary thymic epithelial compartments from CD205(+) progenitors. Eur J Immunol. 2013;43:589–594. doi:10.1002/eji.201243209. PMID:23299414
- Sato A, Sunayama J, Matsuda K, et al. Regulation of neural stem/progenitor cell maintenance by PI3K and mTOR. Neurosci Lett. 2010;470:115–120. doi:10.1016/j.neulet.2009.12.067. PMID:20045038
- Sanghera KP, Mathalone N, Baigi R, et al. The PI3K/Akt/mTOR pathway mediates retinal progenitor cell survival under hypoxic and superoxide stress. Mol Cell Neurosci. 2011;47:145–153. doi:10.1016/j.mcn.2011.03.010. PMID:21463685
- Raslova H, Baccini V, Loussaief L, et al. Mammalian target of rapamycin (mTOR) regulates both proliferation of megakaryocyte progenitors and late stages of megakaryocyte differentiation. Blood. 2006;107:2303–2310. doi:10.1182/blood-2005-07-3005. PMID:16282343
- Gill J, Malin M, Hollander GA, et al. Generation of a complete thymic microenvironment by MTS24(+) thymic epithelial cells. Nat Immunol. 2002;3:635–642. doi:10.1038/ni812. PMID:12068292
- Bennett AR, Farley A, Blair NF, et al. Identification and characterization of thymic epithelial progenitor cells. Immunity. 2002;16:803–814. doi:10.1016/S1074-7613(02)00321-7. PMID:12121662
- Laplante M, Sabatini DM. mTOR signaling in growth control and disease. Cell. 2012;149:274–293. doi:10.1016/j.cell.2012.03.017. PMID:22500797
- Kim YC, Guan KL. mTOR: a pharmacologic target for autophagy regulation. J Clin Invest. 2015;125:25–32. doi:10.1172/JCI73939. PMID:25654547
- Gao C, Cao W, Bao L, et al. Autophagy negatively regulates Wnt signalling by promoting Dishevelled degradation. Nat Cell Biol. 2010;12:781–790. doi:10.1038/ncb2082. PMID:20639871
- Chan LL, Shen D, Wilkinson AR, et al. A novel image-based cytometry method for autophagy detection in living cells. Autophagy. 2012;8:1371–1382. doi:10.4161/auto.21028. PMID:22895056
- Guo S, Liang Y, Murphy SF, et al. A rapid and high content assay that measures cyto-ID-stained autophagic compartments and estimates autophagy flux with potential clinical applications. Autophagy. 2015;11:560–572. doi:10.1080/15548627.2015.1017181. PMID:25714620
- Li F, Chong ZZ, Maiese K. Winding through the WNT pathway during cellular development and demise. Histol Histopathol. 2006;21:103–124. PMID:16267791
- Gao C, Chen YG. Dishevelled: the hub of Wnt signaling. Cell Signal. 2010;22:717–727. doi:10.1016/j.cellsig.2009.11.021. PMID:20006983
- Liang CC, You LR, Yen JJ, et al. Thymic epithelial beta-catenin is required for adult thymic homeostasis and function. Immunol Cell Biol. 2013;91:511–523. doi:10.1038/icb.2013.34. PMID:23856765
- Hsu FC, Pajerowski AG, Nelson-Holte M, et al. NKAP is required for T cell maturation and acquisition of functional competency. J Exp Med. 2011;208:1291–1304. doi:10.1084/jem.20101874. PMID:21624937
- Li J, Li Y, Yao JY, et al. Developmental pathway of CD4+CD8- medullary thymocytes during mouse ontogeny and its defect in Aire-/- mice. Proc Natl Acad Sci USA. 2007;104:18175–18180. doi:10.1073/pnas.0708884104. PMID:17984055
- Stephen TL, Tikhonova A, Riberdy JM, et al. The activation threshold of CD4+ T cells is defined by TCR/peptide-MHC class II interactions in the thymic medulla. J Immunol. 2009;183:5554–5562. doi:10.4049/jimmunol.0901104. PMID:19843939
- Stephen TL, Wilson BS, Laufer TM, et al. Subcellular distribution of Lck during CD4 T-cell maturation in the thymic medulla regulates the T-cell activation threshold. Proc Natl Acad Sci USA. 2012;109:7415–7420. doi:10.1073/pnas.1119272109. PMID:22529380
- Josefowicz SZ, Lu LF, Rudensky AY. Regulatory T cells: mechanisms of differentiation and function. Annu Rev Immunol. 2012;30:531–64. doi:10.1146/annurev.immunol.25.022106.141623. PMID:22224781
- Hinterberger M, Wirnsberger G, Klein L. B7/CD28 in central tolerance: costimulation promotes maturation of regulatory T cell precursors and prevents their clonal deletion. Front Immunol. 2011;2:30. doi:10.3389/fimmu.2011.00030. PMID:22566820
- Boursalian TE, Golob J, Soper DM, et al. Continued maturation of thymic emigrants in the periphery. Nat Immunol. 2004;5:418–425. doi:10.1038/ni1049. PMID:14991052
- Delgoffe GM, Pollizzi KN, Waickman AT, et al. The kinase mTOR regulates the differentiation of helper T cells through the selective activation of signaling by mTORC1 and mTORC2. Nat Immunol. 2011;12:295–303. doi:10.1038/ni.2005. PMID:21358638
- Weichhart T, Costantino G, Poglitsch M, et al. The TSC-mTOR signaling pathway regulates the innate inflammatory response. Immunity. 2008;29:565–577. doi:10.1016/j.immuni.2008.08.012. PMID:18848473
- Sehgal SN, Molnar-Kimber K, Ocain TD, et al. Rapamycin: a novel immunosuppressive macrolide. Med Res Rev. 1994;14:1–22. doi:10.1002/med.2610140102. PMID:8309312
- Hauri-Hohl M, Zuklys S, Hollander GA, et al. A regulatory role for TGF-beta signaling in the establishment and function of the thymic medulla. Nat Immunol. 2014;15:554–561. doi:10.1038/ni.2869. PMID:24728352
- Klein L, Jovanovic K. Regulatory T cell lineage commitment in the thymus. Semin Immunol. 2011;23:401–409. doi:10.1016/j.smim.2011.06.003. PMID:21733719
- Yang T, Zhu L, Zhai Y, et al. TSC1 controls IL-1beta expression in macrophages via mTORC1-dependent C/EBPbeta pathway. Cell Mol Immunol. 2016;13:640–650. doi:10.1038/cmi.2015.43. PMID:27593484
- Chen H, Zhang L, Zhang H, et al. Disruption of TSC1/2 signaling complex reveals a checkpoint governing thymic CD4+ CD25+ Foxp3+ regulatory T-cell development in mice. FASEB J. 2013;27:3979–3990. doi:10.1096/fj.13-235408. PMID:23882125
- Qu Y, Zhang B, Zhao L, et al. The effect of immunosuppressive drug rapamycin on regulatory CD4+CD25+Foxp3+T cells in mice. Transpl Immunol. 2007;17:153–161. doi:10.1016/j.trim.2007.01.002. PMID:17331841
- Wu T, Zhao Y, Wang H, et al. mTOR masters monocytic myeloid-derived suppressor cells in mice with allografts or tumors. Sci Rep. 2016;6:20250. doi:10.1038/srep20250. PMID:26833095
- Sun L, Sun C, Liang Z, et al. FSP1(+) fibroblast subpopulation is essential for the maintenance and regeneration of medullary thymic epithelial cells. Sci Rep. 2015;5:14871. doi:10.1038/srep14871. PMID:26445893
- Hou Y, Lin H, Zhu L, et al. The inhibitory effect of IFN-gamma on protease HTRA1 expression in rheumatoid arthritis. J Immunol. 2014;193:130–138. doi:10.4049/jimmunol.1302700. PMID:24907345
- Hou Y, Lin H, Zhu L, et al. Lipopolysaccharide increases the incidence of collagen-induced arthritis in mice through induction of protease HTRA-1 expression. Arthritis Rheum. 2013;65:2835–2846. doi:10.1002/art.38124. PMID:23982886