
ABSTRACT
Melanoma is among the most life-threatening cancers. The pathogenesis of melanoma has not been fully elucidated. Recently, dysregulated macroautophagy/autophagy has been found to play a critical but inconsistent role in modulating melanoma growth at different stages, with the regulatory mechanism unclear. The histone deacetylase SIRT6 (sirtuin 6) is a known autophagy regulator, and its involvement in cancer development has been reported. Therefore, we sought to determine the role of SIRT6 in melanoma growth and detect its possible link with autophagy in the current study. We initially observed that the expression of SIRT6 decreased in primary melanoma but increased in metastatic melanoma compared with melanocytic nevus. Notably, the expression of SIRT6 was significantly correlated with the expression of autophagy biomarkers including MAP1LC3/LC3 and SQSTM1/p62. Furthermore, SIRT6 suppressed the growth of primary melanoma but promoted metastatic melanoma development in an autophagy-dependent way in vitro. Moreover, SIRT6 exerted its regulation on melanoma growth via the IGF-AKT signaling pathway, and the intervention of AKT could partly reverse the effects of SIRT6 on melanoma growth by regulating autophagy. At last, we determined the effects of SIRT6 on melanoma development in vivo. Taken together, our findings demonstrate that the bimodal expression of SIRT6 at different melanoma stages plays a critical role in regulating melanoma growth through an autophagy-dependent manner, which indicates the potential of SIRT6 to be a biomarker and a therapeutic target in melanoma.
Abbreviations
| ACTB | = | actin beta |
| AKT | = | AKT serine/threonine kinase |
| ATG | = | autophagy related |
| BAX | = | BCL2 associated X, apoptosis regulator |
| BIRC5/survivin | = | baculoviral IAP repeat containing 5 |
| BRAF | = | B-Raf proto-oncogene, serine/threonine kinase |
| cleaved PARP1 | = | cleaved poly (ADP-ribose) polymerase 1 |
| EMT | = | epithelial-mesenchymal transition |
| HIF1A | = | hypoxia inducible factor 1 alpha subunit |
| IGF1R | = | insulin like growth factor 1 receptor |
| IL8 | = | interleukin 8 |
| INPP5J | = | inositol polyphosphate-5-phosphatase J |
| MAP1LC3/LC3 | = | microtubule associated protein 1 light chain 3 |
| MTOR | = | mechanistic target of rapamycin |
| NAD+ | = | nicotinamide adenine dinucleotide |
| NFKB | = | nuclear factor kappa B subunit |
| PHLPP1 | = | PH domain and leucine rich repeat protein phosphatase 1 |
| PTEN | = | phosphatase and tensin homolog |
| PTGS2/COX2 | = | prostaglandin-endoperoxide synthase 2 |
| qRT-PCR | = | quantitative real-time reverse transcription PCR |
| RPS6KB | = | ribosomal protein S6 kinases B |
| SIRT | = | silent information regulator 2 homolog |
| SQSTM1/p62 | = | sequestosome 1 |
| TNF | = | tumor necrosis factor |
Introduction
Melanoma is the most lethal skin cancer with an increasing incidence worldwide. Although recent progress in the research of melanoma pathogenesis has facilitated the emergence of some new therapies against melanoma such as targeted therapies against genes mutations (e.g., BRAFV600E) and immunotherapies (e.g., Ipilimumab and Nivolumab), the overall prognosis of melanoma patients remains poor [Citation1-5]. Therefore, further elucidation of the molecular mechanism underlying melanoma development is necessary for the discovery of more effective drug targets for melanoma therapy.
Autophagy is a dynamic process that delivers intracellular proteins and organelles into autolysosomes for digesting and recycling. Autophagy can affect cell metabolism, DNA repair and energy status, all of which are implicated in the sustaining proliferative and invasive capacity of tumors including melanoma [Citation6–9]. Recent studies have revealed the critical but paradoxical role of autophagy in melanoma pathogenesis. The autophagy level in melanoma is reported to be attenuated in the primary stage but accentuated in the metastatic stage compared with benign nevus [Citation10–12]. Moreover, while impaired autophagy with ATG5 deficiency contributes to the development of early-stage melanoma, the overexpression of ATG7 can accelerate the growth of established BRAFV600E mutant, PTEN null melanoma in an autophagy-dependent manner [Citation13,14]. These findings suggest that autophagy may regulate melanoma growth in a bimodal manner at different clinical stages. However, the upstream regulatory mechanism responsible for this bimodal role of autophagy in melanoma is still unclear.
SIRT6 is a member of the conserved NAD+-dependent deacetylases SIRTs (sirtuins). It is exclusively located in the nucleus to bridge chromatin to diverse cellular processes by its deacetylase or ADP-ribosyltransferase activities [Citation15,16]. Similar to autophagy, SIRT6 is also involved in cancer-associated genome instability, metabolic disorder, and energetic dysregulation [Citation17,18]. On the one hand, SIRT6 acts as a powerful tumor suppressor by repressing the transcriptional activity of master regulators like MYC/c-Myc, HIF1A and NFKB in pancreatic, ovarian, and liver cancer [Citation19–23]. On the other hand, SIRT6 can function as an oncogene in squamous cell carcinoma by promoting PTGS2/COX2 expression [Citation24]. Thus, the function of SIRT6 in different cancers is complicated and context-dependent. Recently, SIRT6 has been identified to suppress IGF-AKT signaling that is a critical regulator of autophagy [Citation25]. Given the important role of autophagy in melanoma pathogenesis, we hypothesized that SIRT6 could regulate melanoma development in an autophagy-dependent way.
To testify our hypothesis, we first detected the expression of SIRT6 in melanoma and found that the level of SIRT6 was decreased in primary melanoma but increased in metastatic melanoma. Subsequently, we analyzed the biological effects of SIRT6 on melanoma by examining cell viability, cell apoptosis and cell-cycle distribution. Moreover, we investigated whether the effects of SIRT6 on melanoma were autophagy-dependent as well as the underlying molecular mechanism. Finally, the xenograft mice model was adopted to examine the role of SIRT6 in melanoma development in vivo.
Results
Aberrant expression of SIRT6 in melanoma at different stages
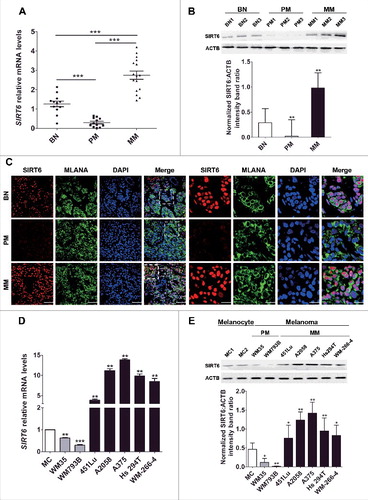
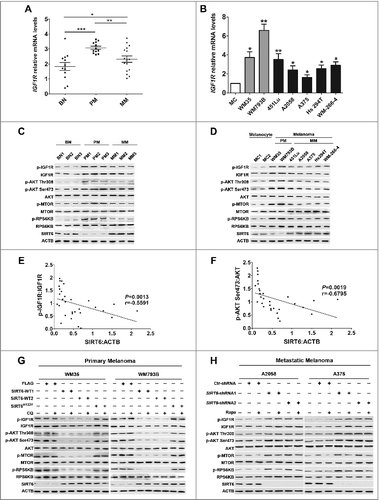
To determine the expression of SIRT6 in melanoma, we performed qRT-PCR and western blotting assays to detect the expression of SIRT6 in the tissues collected from melanoma patients at different stages and benign melanocytic nevus (BN) patients. In comparison to BN, the mRNA level and the protein level of SIRT6 were consistently downregulated in primary melanoma (PM) tissues but upregulated in metastatic melanoma (MM) tissues ( and ), which was in line with subsequent immunofluorescence analysis (). Meanwhile, the localization of SIRT6 is mainly in the nucleus (, right panel). In addition, the expression of SIRT6 was markedly decreased in primary melanoma cell lines (WM35 and WM793B) but significantly increased in metastatic melanoma cell lines (451Lu, A2058, A375, Hs294T and WM-266-4), compared with normal human melanocytes (MCs) ( and ). Collectively, our observations demonstrated aberrant expression of SIRT6 in melanoma, with its suppression in primary melanoma and its overexpression in metastatic melanoma.
Figure 1. Aberrant SIRT6 expression in melanoma at different stages. (A) qRT-PCR analysis of SIRT6 mRNA levels in benign nevus tissues (left group, benign nevus, n = 12) and melanoma tissues at different stages (middle group, primary melanoma, n = 12; right group, metastatic melanoma, n = 16). BN, benign nevus; PM, primary melanoma; MM, metastatic melanoma. ***, P < 0.001. (B) Representative immunoblotting analysis of SIRT6 expression in the 3 groups as described previously (n = 3 per group). The lower panel is a densitometry analysis of 3 individual experiments. Data are presented as means ± SD. **, P < 0.01. (C) Representative immunofluorescence staining images of SIRT6 expression and localization in the 3 groups as described previously. Scale bars: 60 μm, left panel; 20 μm, right panel. (D) qRT-PCR analysis of SIRT6 mRNA level in normal human melanocytes (MCs) and melanoma cell lines at different stages. The relative SIRT6 mRNA abundance in MCs was designated as 1 (n = 3). Data are presented as means ± SD. **, P < 0.01; ***, P < 0.001. (E) Immunoblotting analysis of SIRT6 expression in MCs and melanoma cell lines at different stages. The lower panel is a densitometry analysis of 3 individual experiments. Data are presented as means ± SD. *, P< 0.05; **, P < 0.01. For (A, B, D and E), a Students' t test was used to calculate the P value.
The bimodal function of SIRT6 in melanoma growth
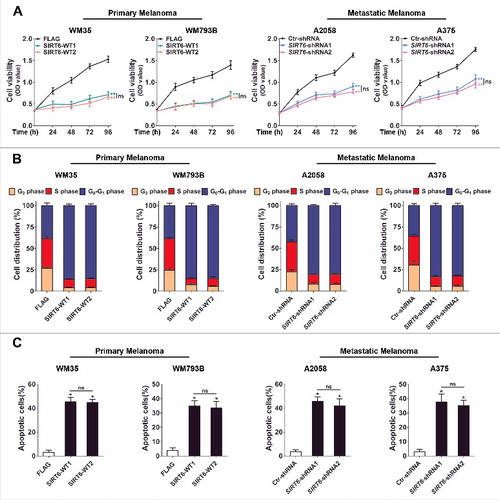
In light of SIRT6 as an important regulator in various cancers and its dysregulated expression that we detected in melanoma [Citation19–23], we sought to explore the impact of SIRT6 on melanoma growth. According to the bimodal expression pattern of SIRT6 in primary and metastatic melanoma, we overexpressed SIRT6 in primary melanoma cell lines (WM35 and WM793B) and knocked down SIRT6 in metastatic melanoma cell lines (A2058 and A375), respectively, for subsequent functional studies (Figure S1A). The CCK8 assay and the flow cytometry analysis revealed significant inhibition of cell proliferation and cell cycle arrest in the G1 phase in both primary melanoma cells with SIRT6 overexpression and metastatic melanoma cells with SIRT6 silencing (, and S1B). Moreover, SIRT6 promoted the apoptosis of primary melanoma cells but protected metastatic melanoma cells from apoptosis ( and S1C). Additionally, we transfected primary melanoma cells with a vector encoding the SIRT6H133Y mutant in which the translated SIRT6 protein lacked its intrinsic deacetylase activity (transfection efficiency shown in Figure S2A). As a result, the multiple effects of exogenously expressed SIRT6 on primary melanoma cells were all abolished in the cells transfected with the mutant SIRT6 vector (Figure S2B to D and S3A and B). Subsequently, we also knocked down SIRT6 in a primary melanoma cell line (WM35) and overexpressed SIRT6 in a metastatic melanoma cell line (A2058), respectively, to detect its biological role. The experiments showed that the indicated intervention of SIRT6 promoted cell proliferation and cell cycle progression and suppressed apoptosis in primary melanoma and metastatic melanoma, respectively (Figure S4). Altogether, SIRT6 suppressed the growth of primary melanoma but promoted the growth of metastatic melanoma, which was closely relevant to its deacetylase activity.
Figure 2. The bimodal role of SIRT6 in melanoma growth. (A) Primary (WM35 and WM793B) and metastatic (A2058 and A375) melanoma cell lines were stably transfected with SIRT6 overexpression vectors or shRNA vectors as indicated. Cells were reseeded and cell viability at the indicated time points was then measured by CCK8 assay. Data at each time point are presented as means ± SD and then successively connected into a growth curve. **, P < 0.01, FLAG and Ctr-shRNA as control respectively; ns, no significant difference. SIRT6-WT1 and SIRT6-WT2, FLAG-tagged overexpression vectors encoding SIRT6; FLAG, FLAG-tagged empty vector; SIRT6-shRNA1 and SIRT6-shRNA2, shRNA vectors against SIRT6; Ctr-shRNA, empty shRNA vector. (B) Cell cycle distributions were analyzed at 48 h in primary and metastatic melanoma cells stably transfected with the indicated vectors. Statistical charts represent 3 individual experiments. Data are presented as means ± SD. FLAG and Ctr-shRNA are controls. (C) Flow cytometry analysis of apoptosis at 24 h by ANXA5/Annexin V (an indicator of apoptosis) and 7-AAD staining in primary and metastatic melanoma cells stably transfected with overexpression vectors or shRNA vectors as indicated. Statistical charts represent 3 individual experiments. Data are presented as means ± SD. *, P < 0.05, FLAG and Ctr-shRNA are controls; ns, no significant difference. For (A and C), Students' t test was used to calculate the P value.
Positive correlation between SIRT6 expression and autophagy level in melanoma
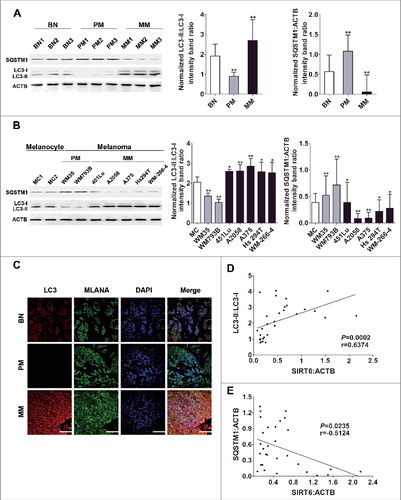
Next, we tried to explore the mechanism underlying the bimodal role of SIRT6 in melanoma growth. Among the known biological processes in melanoma, autophagy bears a similar change pattern with SIRT6 expression in primary and metastatic melanoma, and SIRT6 has been proven to be a vital regulator of autophagy [Citation26–28]. Therefore, we postulated that SIRT6 could exert its effects on melanoma growth through regulating autophagy. To support this speculation, we first confirmed that the conversion from MAP1LC3B-I/LC3B-I (LC3-I) to MAP1LC3B-II/LC3B-II (LC3-II), which is widely used to monitor autophagy process [Citation29], declined in the tissues and the cell lines of primary melanoma but increased in that of metastatic melanoma (, and C), which was in line with previous reports [Citation10–12]. Moreover, the expression of SQSTM1/p62 that serves as a link between LC3 and ubiquitinated substrates displayed changes contrary to the LC3-II:LC3-I ratio ( and ). Notably, chloroquine (CQ) treatment could promote the accumulation of LC3-II as well as that of SQSTM1 in all the cell lines, suggesting that it was autophagy stimulation rather than impaired autophagy flux that accounted for the bimodal autophagy in melanoma (Figure S5). In addition, we performed Spearman's correlation analysis using the immunoblotting densitometry data of SIRT6, LC3-II:LC3-I expression ratio and SQSTM1 expression in the tissue samples. We found that the expression of SIRT6 was positively correlated with the LC3-II:LC3-I expression ratio but negatively correlated with the SQSTM1 level ( and ), suggesting an association between SIRT6 and autophagy in melanoma development.
Figure 3. Significant correlation between SIRT6 expression and autophagy level in melanoma. (A) Immunoblotting analysis of the expression of autophagy markers LC3 and SQSTM1 in benign nevus tissues, primary and metastatic melanoma tissues (n = 3 per group). The right panels are densitometry analysis of 3 individual experiments. Data are presented as means ± SD. **, P < 0.01, BN as control. (B) Immunoblotting analysis of the expression of autophagy markers in MCs and melanoma cell lines at different stages. The right panels are densitometry analysis of 3 individual experiments. Data are presented as means ± SD. *, P< 0.05; **, P < 0.01; ***, P < 0.001, MC as control. (C) Immunofluorescence staining images of LC3 through confocal microscopy analysis in benign nevus tissues and melanoma tissues at different stages. Scale bar: 60 μm. (D) Spearman's correlation test of immunoblotting densitometry data between relative SIRT6 and LC3-II:LC3-I ratio expression in benign nevus tissues and melanoma tissues at different stages (n = 30, 10 per group). (E) Spearman's correlation test of immunoblotting densitometry data between relative SIRT6 and SQSTM1 expression in the same samples as indicated in (D). For (A and B), Students' t test was used to calculate the P value.
Given the similar trends of SIRT6 expression and autophagy level in melanoma development, we sought to investigate whether the influence of autophagy on melanoma was parallel with that of SIRT6. To this end, we established autophagy intervention models by transfecting ATG5 overexpression plasmids into primary melanoma cells and ATG5 knockdown plasmids into metastatic melanoma cells, respectively (transfection efficiency shown in Figure S7A). Overexpressed ATG5 significantly inhibited cell proliferation and caused cell cycle arrest in the G1 phase in primary melanoma cells, whereas ATG5 knockdown suppressed cell proliferation and cell cycle progression in metastatic melanoma cells (Figure S6A, S6B and S7B). Moreover, ATG5 promoted the apoptosis of primary melanoma cells but suppressed the apoptosis of metastatic melanoma cells (Figure S6C and S7C). Subsequent immunoblotting analysis showed consistently altered expressions of the anti-apoptotic protein BIRC5/survivin as well as the pro-apoptotic proteins BAX and cleaved PARP1 in the melanoma cell lines with ATG5 intervention (Figure S6D). Additionally, the autophagy activator rapamycin (Rapa), and chloroquine (CQ), an inhibitor of autophagosome degradation, were further used to confirm the role of autophagy in melanoma development. Consistent with the effects of ATG5 intervention, Rapa inhibited cell viability, cell cycle progression and promoted cell apoptosis in primary melanoma cells, whereas CQ suppressed cell viability, cell cycle progression and induced cell apoptosis in metastatic melanoma cells (Figure S8 and S9). Therefore, the expression and function patterns of autophagy were very similar to those of SIRT6 in different stages of melanoma.
SIRT6 regulated melanoma growth in an autophagy-dependent manner
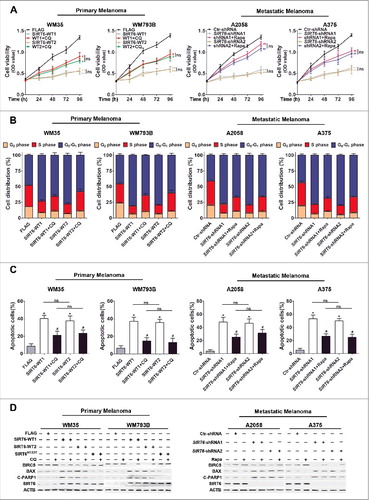
To investigate whether the effects of SIRT6 on melanoma growth were dependent on autophagy, SIRT6-overexpressing primary melanoma cells were stimulated with chloroquine, and SIRT6-silencing metastatic melanoma cells were treated with rapamycin. It turned out that the inhibition of autophagy by chloroquine partially rescued SIRT6 overexpression-induced cell proliferation suppression, cell cycle arrest and cell apoptosis in primary melanoma cells, and the activation of autophagy by rapamycin also partially reversed the impacts of SIRT6 knockdown on metastatic melanoma cells (, and , as well as S10 and S11). The following immunoblotting analysis on the expression of BIRC5, BAX and cleaved PARP1 showed the parallel trend with the previous cell apoptosis analysis (). Therefore, SIRT6 regulated melanoma growth in an autophagy-dependent manner.
Figure 4. SIRT6 regulated melanoma growth in an autophagy-dependent manner. (A) Primary (WM35 and WM793B) and metastatic (A2058 and A375) melanoma cell lines were stably transfected with SIRT6 overexpression vectors or shRNA vectors as indicated. Cells were reseeded and after 24 h treated with the autophagosome degradation inhibitor chloroquine (CQ, 10 μM) or the autophagy agonist rapamycin (Rapa, 5 μM), respectively, for subsequent CCK8 assay at the indicated time points. Data at each time point are presented as means ± SD and then successively connected into a growth curve. **, P < 0.01, FLAG and Ctr-shRNA as control respectively; #, P < 0.05; ##, P < 0.01, SIRT6-WT1 and SIRT6-WT2, as well as SIRT6-shRNA1 and SIRT6-shRNA2 as corresponding control, respectively; ns, no significant difference. WT1 and WT2, SIRT6-WT1 and SIRT6-WT2; shRNA1 and shRNA2, SIRT6-shRNA1 and SIRT6-shRNA2. (B) Cell cycle distributions were analyzed in melanoma cells at 48 h with the same treatments as described in (A). Statistical charts represent 3 individual experiments. Data are presented as means ± SD. FLAG and Ctr-shRNA, as well as SIRT6-WTs and SIRT6-shRNAs were regarded as corresponding control respectively. (C) Flow cytometry analysis of apoptosis by ANXA5/Annexin V and 7-AAD staining in different melanoma cells at 24 h with the same treatments as described in (A). Statistical charts represent 3 individual experiments. Data are presented as means ± SD. *, P < 0.05, FLAG and Ctr-shRNA are contols; #, P < 0.05, SIRT6-WT1 and SIRT6-WT2, as well as SIRT6-shRNA1 and SIRT6-shRNA2 as corresponding control, respectively; ns, no significant difference. (D) Immunoblotting analysis showing the expression of the apoptotic markers in melanoma cells with the indicated treatments. ACTB was used as a loading control. SIRT6H133Y, mutated vectors of SIRT6 with the loss of HDAC activity. C-PARP1, cleaved PARP1. For (A and C), Students' t test was used to calculate the P value.
SIRT6 regulated autophagy in melanoma
We subsequently focused on the regulatory role of SIRT6 in the autophagy process in melanoma. Our immunoblotting assay showed that overexpressed SIRT6 upregulated the LC3-II:LC3-I ratio and downregulated SQSTM1 expression in primary melanoma cells, whereas the knockdown of SIRT6 led to the opposite phenomena in metastatic melanoma cells. Notably, the autophagy level in primary melanoma cells showed little change after the transfection with the SIRT6H133Y expression construct, indicating that the deacetylase activity of SIRT6 was essential for its effects on autophagy (). In addition, chloroquine treatment could further enhance the LC3-II:LC3-I expression ratio and SQSTM1 level in SIRT6-overexpressing primary melanoma and SIRT6-silencing metastatic melanoma, indicating that the facilitative role of SIRT6 on autophagy level was attributed to upstream stimulation rather than downstream inhibition of autophagy flux (). What is more, rapamycin treatment efficiently reversed the autophagy level in SIRT6-silencing metastatic melanoma (Figure S12A), suggesting the rationale to reactivate autophagy in SIRT6-silencing metastatic melanoma by using rapamycin.
Figure 5. SIRT6 regulated autophagy in melanoma. (A) Immunoblotting analysis showing the expression of autophagy markers LC3 and SQSTM1 in melanoma cells transfected with overexpression vectors (SIRT6-WTs), mutant vectors (SIRT6H133Y) and shRNA vectors followed by treatment with the autophagosome degradation inhibitor chloroquine (CQ, 10 μM) as indicated. The lower panels are densitometry analysis of 3 individual experiments. Data are presented as means ± SD. *, P < 0.05, **, P < 0.01, blank group as control; #, P < 0.05, SIRT6-WT1 and SIRT6-WT2, as well as SIRT6-shRNA1 and SIRT6-shRNA2 as corresponding control, respectively; Φ, P <0.05, SIRT6H133Y as control; ns, no significant difference. (B) Autophagy reporter mRFP-LC3 plasmids were transiently transfected into melanoma cells followed by the treatments as described in (A). Representative images of fluorescent LC3 puncta (red) were photographed using confocal microscopy. Scale bar: 20 μm (upper row of each cell line) and 60 μm (lower row of each cell line). Numbers of RFP-LC3 puncta per cell were analyzed in the lower panels. Data are presented as means ± SD. **, P < 0.01, FLAG and Ctr-shRNA as control, respectively; #, P < 0.05, SIRT6-WT1 and SIRT6-shRNA1 as control, respectively; Φ, P <0.05, CQ-treated group as control. WT, SIRT6-WT1; shRNA, SIRT6-shRNA1, Ctr, Ctr-shRNA. For (A and B), Students' t test was used to calculate the P value.
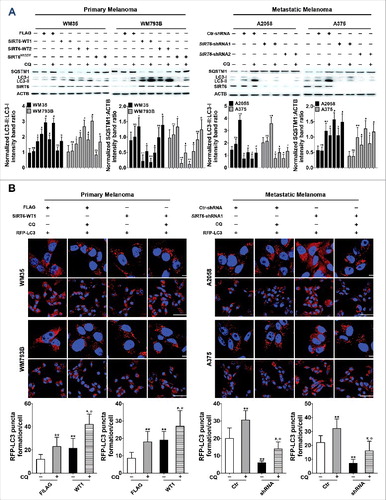
We further transfected melanoma cells with a vector expressing the red fluorescent protein (RFP)-tagged LC3 fusion protein to monitor the autophagy level regulated by SIRT6. As a result, overexpressed SIRT6 promoted the formation of RFP-LC3 puncta in primary melanoma cells, and the knockdown of SIRT6 decreased the punctate RFP-LC3 signal in metastatic melanoma cells. Moreover, chloroquine treatment could accelerate the accumulation of RFP-LC3 puncta in primary melanoma cells and metastatic melanoma cells with corresponding SIRT6 intervention, which was consistent with the previous immunoblotting analysis (). In addition, the transmission electron microscopy assay showed that SIRT6 was critical for the formation of autophagosomes in both primary and metastatic melanoma cell lines (Figure S12B). Taken together, these results implied that SIRT6 could upregulate the autophagy level in melanoma.
SIRT6 regulated autophagy through the IGF-AKT pathway in melanoma
It has been reported that SIRT6 protects the heart from cardiac hypertrophy by inhibiting the IGF-AKT pathway that is a critical suppressor of autophagy [Citation30]. Meanwhile, the IGF-AKT pathway is also relevant to the development of melanoma [Citation31–34]. Therefore, SIRT6 may regulate autophagy via the IGF-AKT pathway in melanoma. To verify this speculation, we first assessed the mRNA level of IGF1R in melanoma tissues and cell lines and found that the IGF1R mRNA level was significantly increased in melanoma tissues and cell lines at different stages, compared with benign nevus and normal melanocytes, respectively ( and ). Moreover, the IGF1R mRNA level was significantly lower in metastatic melanoma than that in primary melanoma ( and ). We then examined the expression and phosphorylation of IGF1R (p-IGF1R), AKT (p-AKT) and the downstream molecules via immunoblotting analysis. Interestingly, IGF1R, AKT and downstream MTOR and RPS6KB were all prominently phosphorylated in melanoma tissues and cell lines, with the phosphorylation of those proteins slightly dampened in metastatic melanoma compared with primary melanoma (, D and S13). Furthermore, there was a significant negative association not only between the expression of SIRT6 and the ratio of p-IGF1R:IGF1R but also between the expression of SIRT6 and the ratio of p-AKT:AKT ( and ). In addition, SIRT6 overexpression reduced the expression of IGF1R as well as the phosphorylation of IGF1R, AKT and downstream molecules in primary melanoma, and SIRT6 knockdown increased the expression of those molecules in metastatic melanoma, which were not affected by chloroquine and rapamycin, respectively ( and , as well as S14). Notably, the transfection with the vector encoding SIRT6H133Y did not influence the activity of the IGF-AKT pathway in primary melanoma cells ( and S14). Collectively, these results indicated that SIRT6 could inhibit the IGF-AKT pathway in melanoma via its deacetylase activity.
Figure 6. SIRT6 inhibited IGF-AKT signaling in melanoma. (A and B) qRT-PCR analysis of IGF1R mRNA level in melanoma tissues and cell lines. Data are presented as means ± SD. *, P < 0.05; **, P < 0.01; ***, P < 0.001, BN and MC as control, respectively. (C and D) Immunoblotting analysis showing the expressions of IGF-AKT signaling-related proteins in melanoma tissues and cell lines at different stages. BN as control in (C), MCs as control in (D). The ‘p-’ prefix indicates the phosphorylated form. (E and F) Spearman's correlation test of immunoblotting densitometry analysis between SIRT6 and the ratio of p-IGF1R:IGF1R or p-AKT:AKT in melanoma tissues at different stages and benign nevus tissues. (n = 30, 10 per group.) (G and H) Representative immunoblotting analysis showing the expression of IGF-AKT signaling-related proteins in melanoma cells with different treatments as indicated. For (A and B), Students' t test was used to calculate the P value.
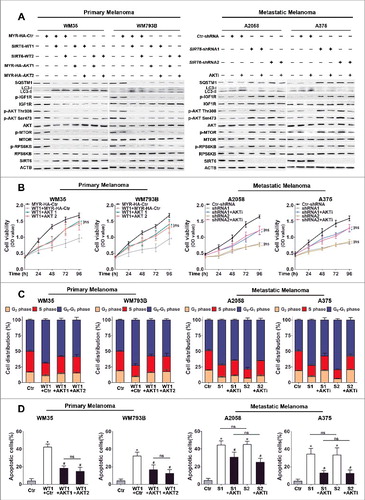
To confirm the role of the IGF-AKT pathway in the regulation of autophagy by SIRT6 in melanoma, we restored AKT expression in SIRT6-overexpressing primary melanoma cells and repressed AKT activation in SIRT6-knockdown metastatic melanoma cells for the following analysis. The ratio of LC3-II:LC3-I expression and SQSTM1 expression in SIRT6-overexpressing primary melanoma cells and SIRT6-silencing metastatic melanoma cells were all reversed by the corresponding AKT manipulation, and chloroquine treatment could upregulate the ratio of LC3-II:LC3-I expression and SQSTM1 expression in these cells with the indicated treatment, demonstrating that SIRT6 regulated autophagy in melanoma through the IGF-AKT pathway ( and S15, S16 and S17). Moreover, AKT overexpression ameliorated the inhibition on cell viability and cell cycle progression in SIRT6-overexpressing primary melanoma cells, while AKT inhibitor promoted cell viability and cell cycle progression in SIRT6-silencing metastatic melanoma cells (, and S18), and the numbers of apoptotic cells were significantly reversed by AKT manipulation in these melanoma cell lines with different SIRT6 interventions accordingly ( and S19). Our results revealed that the IGF-AKT pathway mediated the regulatory effects of SIRT6 on autophagy in melanoma.
Figure 7. IGF-AKT signaling is involved in the regulation of autophagy by SIRT6 in melanoma. (A) Immunoblotting analysis showing the expression of autophagy markers (LC3 and SQSTM1) and IGF-AKT signaling-related proteins in melanoma cells with SIRT6 overexpression or knockdown as well as the indicated AKT interventions. MYR-HA-AKT1 and MYR-HA-AKT2, MYR-HA-tagged overexpression vectors encoding AKT1; MYR-HA-Ctr, MYR-HA-tagged empty vector; AKTi, AKT inhibitor (0.5 μM). (B) SIRT6-overexpressing primary melanoma cells and SIRT6-silencing metastatic melanoma cells were transfected with AKT overexpression vectors or treated with AKT inhibitor, respectively. After 24 h, cells were reseeded for CCK8 assay. Data at each time point are presented as means ± SD and then successively connected into a growth curve. *, P < 0.05, MYR-HA-Ctr and Ctr-shRNA as control, respectively; #, P < 0.05, SIRT6-WT1, SIRT6-shRNA1 and SIRT6-shRNA2 as control; ns, no significant difference. WT1, SIRT6-WT1; shRNA1 and shRNA2, SIRT6-shRNA1 and SIRT6-shRNA2; AKT1 and AKT2, MYR-HA-AKT1 and MYR-HA-AKT2. (C) Cell cycle distributions were analyzed at 48 h in melanoma cells with different treatments as described in (B). Statistical charts represent 3 individual experiments. Data are presented as means ± SD. MYR-HA-Ctr and Ctr-shRNA, as well as SIRT6-WT1 and SIRT6-shRNA1/2 as control. S1 and S2, SIRT6-shRNA1 and SIRT6-shRNA2; Ctr, MYR-HA-Ctr and Ctr-shRNA respectively; AKTi, AKT inhibitor (0.5 μM). (D) Apoptosis analysis by flow cytometry in melanoma cells with different treatments as described in (B). Statistical charts represent 3 individual experiments. Data are presented as means ± SD. *, P < 0.05, MYR-HA-Ctr and Ctr-shRNA as control respectively; #, P < 0.05, SIRT6-WT1, SIRT6-shRNA1 and SIRT6-shRNA2 as control; ns, no significant difference. For (B and D), Students' t test was used to calculate the P value.
The bimodal role of SIRT6 in primary and metastatic melanoma growth in vivo
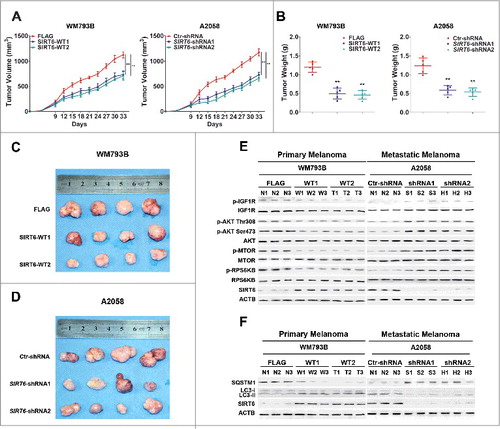
In order to confirm our findings in vivo, we employed a xenograft model by subcutaneous implantation of SIRT6-overexpressing primary melanoma cells (WM793B cells) or SIRT6-silencing metastatic melanoma cells (A2058 cells) into SCID-NOD nude mice. Tumor growth was observed over time during the following 33 d. Compared with the indicated control groups, the size and the weight of the tumors were significantly decreased in mice implanted with SIRT6-overexpressing primary melanoma cells or SIRT6-silencing metastatic melanoma cells ( to ). The mice receiving the implantation of SIRT6-silencing A2058 cells had less liver metastases compared with the control (Figure S20). Moreover, the phosphorylation level of IGF1R, AKT, MTOR and RPS6KB in xenografts decreased with the implantation of SIRT6-overexpressing primary melanoma cells, but showed significant increase with the implantation of SIRT6-silencing metastatic melanoma cells ( and S21A and B). In addition, the LC3-II:LC3-I expression ratio and SQSTM1 expression in xenograft tumors showed opposite trends relative to each other, consistent with the changes seen with the IGF-AKT pathway ( and S21C and D). Therefore, SIRT6 could act as a tumor suppressor in primary melanoma but a tumor promoter in metastatic melanoma through regulating the IGF-AKT-autophagy axis in vivo.
Figure 8. The bimodal role of SIRT6 in melanoma growth at different stages in vivo. (A) Primary and metastatic melanoma cells stably transfected with SIRT6 overexpression vectors or SIRT6 shRNA vectors were subcutaneously injected into NOD/SCID nude mice (n = 5 per group) for the generation of subcutaneous xenograft tumors. Tumor volumes including tumor length (L) and width (W) were measured using vernier calipers every 3 d from d 6 after injection and then calculated according to the formula (L × W2)/2. Data are presented as means ± SD (from 5 individual mice). **, P < 0.01, FLAG and Ctr-shRNA as control, respectively. (B) Tumor weights were analyzed at the terminal time point. At the end of 33 d, tumors were excised and weighed. The data are shown as means ± SD (from 5 mice per group). **, P < 0.01, FLAG and Ctr-shRNA as control, respectively. (C and D) Tumors from sacrificed mice were dissected 33 d after subcutaneous injection and are shown in the indicated row representatively (n = 4 per group). (E and F) Representative immunoblotting analysis showing the expressions of IGF-AKT signaling-related proteins and autophagy markers (LC3 and SQSTM1) in tumors from sacrificed mice as indicated (n = 3 per group). WT1 and WT2, SIRT6-WT1 and SIRT6-WT2; FLAG, FLAG-tagged control vector; shRNA1 and shRNA2, SIRT6-shRNA1 and SIRT6-shRNA2; Ctr-shRNA, control shRNA. N, FLAG or Ctr-shRNA; W and T, SIRT6-WT1 and SIRT6-WT2; S and H, SIRT6-shRNA1 and SIRT6-shRNA2.
Discussion
In this study, we initially found that the expression of SIRT6 decreased in primary melanoma but increased in metastatic melanoma compared with benign melanocytes both in tissues and cell lines, which acted in tandem with the autophagy level in melanoma at different stages. Moreover, SIRT6 suppressed melanoma growth at the primary stage yet promoted melanoma development at the metastatic stage in an autophagy-dependent manner. Additionally, the aberrant autophagy in melanoma was modulated by SIRT6 through the IGF-AKT signaling (). Finally, the bimodal role of SIRT6 in melanoma was confirmed in vivo.
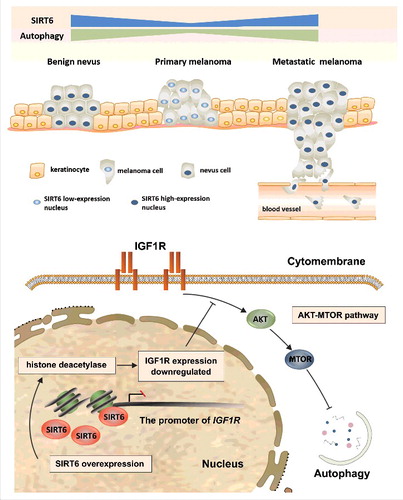
Figure 9. Schematic representation of the effects of SIRT6-regulated autophagy on melanoma growth and the underlying mechanism. In benign nevus, melanocytes undergo limited proliferation with a physiological basal level of SIRT6 and autophagy. In the case of reduced SIRT6 expression, melanocytes can proliferate uncontrollably, migrate to the upper epidermis along the basement membrane, and subsequently penetrate to the dermis, which forms primary melanoma with a lower autophagy level. Later, melanoma cells can enter into blood vessels and develop distant metastases, with SIRT6 and downstream autophagy remarkably increased. The effect of SIRT6 on autophagy in melanoma is mediated by IGF-AKT signaling, with the deacetylase activity of SIRT6 indispensable for the regulation.
SIRT6 is dysregulated in various cancers, and the role of SIRT6 in tumorigenesis is dependent on tumor types and context [Citation19–24,35–38]. SIRT6 can act as a tumor suppressor by regulating aerobic glycolysis, and its conditional deletion in vivo increases the number, size and aggressiveness of tumors [Citation23]. Consistently, remarkable downregulation of SIRT6 expression is found in pancreatic cancer, colorectal cancer, hepatocellular carcinoma and colon cancer [Citation21–23,38]. However, the oncogenic role of SIRT6 has also been described in squamous cell carcinoma and prostate cancer [Citation24,35]. In the present study, we showed that the role of SIRT6 could shift in different stages of melanoma, which enhances our understanding on SIRT6 function in cancer development. Our findings provide a model that a specific gene can play different or even opposite roles in the same tumor at different stages.
As a versatile molecule, SIRT6 is involved in diverse intracellular processes including genome stability, cell cycle progression, metabolism, apoptosis, and inflammatory response in tumorigenesis [Citation23,38,39]. For example, SIRT6 is a critical co-repressor of HIF1A transcriptional activity and impedes aerobic glycolysis in pancreatic ductal adenocarcinomas and colorectal carcinoma [Citation20]. Besides, SIRT6 promotes the production of TNF and IL8, both of which play a key role in the pathogenesis of pancreatic cancer through accelerating local inflammation, angiogenesis and EMT [Citation21,40]. Moreover, SIRT6 can facilitate the apoptosis of tumor cells by inhibiting the expression of BIRC5 in liver cancer and endometrial cancer [Citation22,37,38]. Consistent with previous studies, we found that overexpressed SIRT6 promoted apoptosis in primary melanoma by suppressing BIRC5. Nevertheless, SIRT6 could inhibit apoptosis by the increase of BIRC5 and the decrease of pro-apoptotic BAX and cleaved PARP1 in metastatic melanoma. Furthermore, the IGF-AKT signaling-mediated autophagy contributed to the bimodal role of SIRT6 in melanoma. It has been proved that autophagy is involved in oxidative stress-induced cell apoptosis and in cigarette smoke-induced bronchial epithelial cell senescence under the regulation of SIRT6 [Citation26–28]. Combined with our findings that autophagy could mediate the effects of SIRT6 on cell apoptosis and cell cycle in melanoma, it can be stated that autophagy is a critical process in SIRT6's biological function.
In melanoma, the autophagy level fluctuates from the primary stage to the metastatic stage [Citation6,41,42]. Impaired autophagy with ATG5 deficiency precludes oncogene-induced senescence and potentiates melanoma growth at the primary stage [Citation13]. In contrast, upregulated autophagy promotes melanoma development by limiting oxidative stress and overcoming senescence in an established melanoma mouse model [Citation14,43]. Our study revealed bimodal effects of autophagy on melanoma growth, which is consistent with previous studies. Furthermore, we discovered a positive association between SIRT6 expression and autophagy level in melanoma, and confirmed that SIRT6 was a pivotal inducer of aberrant autophagy in a deacetylase activity-dependent way. Moreover, we identified the IGF-AKT pathway as the intermediary between SIRT6 and autophagy in melanoma. In addition to cardiac hypertrophy, neuronal oxidative damage and bronchial epithelial cell senescence, our study demonstrates that autophagy can be regulated by SIRT6 in malignancy as well, and proposes a crucial role of the SIRT6-AKT-autophagy axis in tumorigenesis.
AKT signaling is activated in about 70% of melanomas [Citation44,45]. The activity of AKT depends on the phosphorylation at its activation loop (Thr308) and hydrophobic motif (Ser473), which can be induced by various growth factors such as IGF [Citation44,46–48]. Recently, INPP5J and PHLPP1 have been documented as negative regulators of AKT signaling in melanoma through their dephosphorylation modification [Citation49], but the downregulation of INPP5J and PHLPP1 could not fully illuminate the dynamic alteration of AKT activity at different stages [Citation41,44,45]. Our study showed that the expression of SIRT6 was related to the phosphorylated IGF1R and AKT in melanoma tissues. Furthermore, SIRT6 could suppress the IGF-AKT pathway in both primary and metastatic melanoma, which was dependent on the deacetylase activity of SIRT6 and possibly relevant to the epigenetic repression of IGF1R at the chromatin level. Therefore, the fluctuating activity of AKT at different melanoma stages can be caused, at least partially, by the dysregulated expression of SIRT6. Moreover, our study indicates that except for phosphorylation, acetylation modification can also regulate AKT activity in melanoma.
Sirtuins such as SIRT1 and SIRT3 play important roles in melanoma pathogenesis [Citation50–52]. Our study reveals that SIRT6, another member of the sirtuin family, has a prominent impact on melanoma growth by regulating autophagy, however, with opposite effects on melanoma growth at different stages. Our findings implicate a model that a specific protein such as SIRT6 or a cellular process such as autophagy can play quite different, sometimes even opposite, roles in one disease. This feature makes SIRT6 a promising marker for the determination of melanoma staging. Moreover, future therapies that target SIRT6 or autophagy need to be manipulated wisely in melanoma at different stages. It has to be noted that since the intervention of autophagy could not completely reverse the effects of SIRT6 on melanoma, additional mechanisms underlying SIRT6-regulated melanoma growth need to be discovered.
Materials and methods
Cell culture, antibodies and reagents
Normal human melanocytes (NHMCs) were isolated from human foreskin specimens obtained during circumcision surgery and were cultured using standard protocol in Medium 254 (Gibco/Life Technologies, M254500) supplemented with Human Melanocyte Growth Supplement (HMGS; Gibco/Life Technologies, S0025) [Citation53,54]. All the experiments using NHMCs were performed from passage 2 to 4. All foreskin specimens were collected with the approval of the Institutional Review Board of Fourth Military Medical University, Xi'an, China. Written informed consent was obtained from all patients, according to the Declaration of Helsinki. Human melanoma cell lines WM793B, 451Lu, WM-266-4, A2058, Hs 294T and A375 were obtained from the American Type Culture Collection (ATCC; CRL-2806™; CRL-2813™; CRL-1676™; CRL-11147™; HTB-140™; CRL-3224™). WM35 cells were cultured in RPMI 1640 medium (Gibco/Life Technologies, 11875119) supplemented with 10% fetal bovine serum (FBS; Gibco/Life Technologies, 10099141). WM793B and 451Lu cells were maintained in 2% melanoma media, a 4:1 mixture of MCDB 153 Medium (Sigma Aldrich, M7403) and L15 (Sigma Aldrich, L4386), supplemented with 2 mmol/L Ca2+, 2% FBS and insulin (5 μg/ml; Sigma Aldrich, I3536). A2058, A375, Hs294T and WM-266-4 cells were grown in DMEM (Gibco/Life Technologies, M254500) supplemented with penicillin-streptomycin (Sigma Aldrich, V900929) and 10% FBS in a 37 °C, 5% CO2 atmosphere at constant humidity.
Antibodies used include rabbit anti-SIRT6 (1:500; Sigma Aldrich, S4322), rabbit anti-SIRT6 (1:100; Novus, NB100-2522), rabbit anti-p-IGF1R (1:1000; Cell Signaling Technology, 3918), rabbit anti-IGF1R (1:1000; Cell Signaling Technology, 3018), rabbit anti-p-AKT Ser473 (1:1000; Cell Signaling Technology, 4060), rabbit anti-p-AKT Thr308 (1:1000; Cell Signaling Technology, 13038), rabbit anti-AKT (1:1000; Cell Signaling Technology, 4691), rabbit anti-p-MTOR (1:1000; Cell Signaling Technology, 5536), rabbit anti-MTOR (1:1000; Cell Signaling Technology, 2983), rabbit anti-p-RPS6KB (1:1000; Cell Signaling Technology, 9205), rabbit anti-RPS6KB (1:1000; Cell Signaling Technology, 9202), rabbit anti-LC3A/B (1:1000; Cell Signaling Technology, 4108), rabbit anti-LC3B (1:100; Cell Signaling Technology, 3868), rabbit anti-ATG5 (1:1000; Cell Signaling Technology, 2630), rabbit anti-SQSTM1/p62 (1:1000; Cell Signaling Technology, 5114), rabbit anti-BAX (1:1000; Abcam, ab32503), mouse anti-BIRC5/survivin (1:800; Novus, sc-17779), rabbit anti-cleaved PARP1 (1:500; Abcam, ab32064), and mouse anti-ACTB (1:1000; CWBIO, cw0096). Secondary antibodies including anti-rabbit IgG and anti-mouse IgG were purchased from Santa Cruz Biotechnology (1:3000; sc-2004, sc-2005).
Rapamycin (Abcam, ab120224), chloroquine (Sigma Aldrich, C6628) and AKT1/2 kinase inhibitor (Sigma Aldrich, A6730) were purchased as indicated. AKT1/2 inhibitor was used at a concentration of 0.5 μM. Rapamycin was used at a concentration of 5 and 10 μM. Chloroquine was used at a concentration of 10 and 20 μM [Citation30,41].
Knockdown and forced expression of target genes
FLAG-tagged SIRT6 constructs were gifts from Eric Verdin (Addgene, 13817). FLAG-SIRT6 catalytic mutant construct (SIRT6H133Y) was a gift from Katrin Chua (Addgene, 53149). Lentiviral vectors synthesizing SIRT6 shRNA or control shRNA were purchased from Ori Gene (TL317201). MYC-tagged ATG5 was a gift from Toren Finkel (Addgene, 24922). Retroviral vectors synthesizing ATG5 shRNA or control shRNA were purchased from Ori Gene (TR314610). The MYR-HA-tagged AKT construct was a gift from William Sellers (Addgene, 9008). For transfection, WM35, WM793B, A2058 and A375 cells were seeded in 6-well plates to 50% to 60% confluence. Then the constructs were respectively added into the wells using the Lipofectamine® 3000 reagent (Invitrogen, 3000015) according to the manufacturer's instructions. Stable transfections were generated after selection with G418 (Sigma Aldrich, A1720) for FLAG-SIRT6 and puromycin (Sigma Aldrich, SH0111) for SIRT6-shRNA for 2–3 weeks. Immunoblotting analysis was conducted to validate the transfection efficiency.
RNA isolation and real-time PCR analysis
Total RNA was isolated using Trizol reagent (Invitrogen, 15596018), and then reversely transcribed to cDNA using the PrimeScript™ RT Master Mix (Takara, RR036A) according to the manufacturer's instructions. qRT-PCR experiments were performed using a SYBR® Premix Ex Taq™ II Kit (Takara, RR820A) and Bio-Rad Multicolor Real-time PCR Detection System (Bio-Rad, iQ™ 5). The resulting amplification and melt curves were analyzed to ensure the identity of the specific PCR product. Threshold cycle value was used to calculate the fold change in the transcript levels by using the 2−ΔΔCT method. The relative mRNA expression level was normalized to the ACTB gene. The expression level was normalized to the fold change detected in the corresponding controls, which was defined as 1.0. The primers used were SIRT6 sense primer, 5′-CCATCCTAGACTGGGAGGACT-3′; SIRT6 antisense primer, 5′- GGATCTGCAGCGATGTACCC-3′; IGF1R sense primer, 5′-GTGGGGGCTCGTGTTTCTC-3′; IGF1R antisense primer, 5′-GATCACCGTGCAGTTTTCCA-3′; ACTB sense primer 5′-CATGTACGTTGCTATCCAGGC-3′; ACTB antisense primer 5′-CTCCTTAATGTCACGCACGAT-3′. These primer sets yielded PCR products of 108, 127 and 250 base pairs for SIRT6, IGF1R and ACTB, respectively.
Immunoblotting analysis
After treatment, cells were washed 2 times with ice-cold phosphate-buffered saline (PBS; 2 mM KH2PO4, 10 mM Na2HPO4, 137 mM NaCl, 2.7 mM KCl, pH 7.4) and then lysed with cell lysis solution (Runde Biologicals, P0013B) and phenylmethylsulfonyl fluoride (PMSF; protease inhibitor mix, Sigma-Aldrich, PMSF-RO). Proteins were extracted from cells and quantified using the BCA Protein Assay kit (Beyotime Biotechnology, P0012). Equal amounts of proteins were separated by sodium dodecyl sulfate-polyacrylamide gel electrophoresis and then transferred from the gel to polyvinylidene difluoride membranes (Millipore, IPVH00010). Page Ruler Plus Prestained Protein Ladder (Fermentas, 26617) was used to confirm protein electrophoresis and transferring. After blocking in a solution of 5% nonfat dry milk diluted in Tris-buffered saline (TBST; 137 mM NaCl, 20 mM Tris-base, 0.1% v/v Tween 20, pH 7.2–7.4) or 5% bovine serum albumin (Sigma-Aldrich, B2064) diluted in Tris-buffered saline, the membranes were washed and then incubated with primary antibodies overnight at 4°C. After being washed, the membranes were incubated with horseradish peroxidase-conjugated secondary antibodies (goat anti-mouse IgG or goat anti-rabbit IgG, 1:3000; Santa Cruz, sc-2004, sc-2005) for 2 h at room temperature. Bound antibodies were detected using the ECL western blotting detection system (Millipore). LC3-II, SQSTM1, SIRT6 and phosphorylation of IGF-AKT signaling-related proteins expression was quantified using ImageJ software and band intensity was normalized to LC3-I, ACTB and corresponding total proteins. Data are shown as fold change relative to the mean LC3-II:LC3-I, SQSTM1:ACTB, SIRT6:ACTB and phosphorylated protein:total protein value in 3 individual experiments (means ± SD).
Detection of apoptosis
To quantify apoptotic death, cells were seeded in 6-well plates at a density of 2–3 × 10⁵ cells per well overnight. After the indicated treatment, the cells were collected and the apoptotic portion was identified using the Annexin V-PE/7-AAD Apoptosis Kit (MultiSciences, Ap104-100) following the manufacturer's instructions. Briefly, cells were collected and resuspended with 380 μL binding buffer. After adding 5 μL ANXA5/annexin V-PE and 10 μL 7-AAD, cells were mixed and incubated at room temperature in the dark for 15 min. The number of apoptotic cells was then quantified by flow cytometry (Beckman Coulter), and the analysis was carried out using the Expo32 software (Beckman Coulter). Each sample was repeated in triplicate (means ± SD).
Cell viability assay
Cell viability was determined by the CCK8 assay (7seabiotech, C008-2). According to the manufacturer's instructions, 2 × 10³ cells were seeded in each well of a 96-well culture plate overnight. After synchronization, cells were prepared for the following procedures or pretreated with rapamycin or chloroquine at the indicated doses. At 24, 48, 72 and 96 h, cells were incubated with CCK8 reagents for 1 h. The microplates were then read in a spectrophotometer at a wavelength of 450 nm. Each sample was analyzed in triplicate (means ± SD).
Cell cycle analysis
Briefly, cells were seeded in 6-well culture plates overnight. After synchronization, cells were prepared for the following procedures or pretreated with rapamycin or chloroquine at the indicated doses; 48 h later, cells were harvested from each well by trypsinization and fixed in 70% (v/v) cold ethanol at 4°C overnight. After washing with ice-cold PBS, the fixed-cell pellets were collected by centrifugation and resuspended in PI/RNase Staining Buffer (Beyotime Biotechnology, C1052) for staining of DNA and finally analyzed using a flow cytometer (Beckman Coulter).
Immunofluorescence assays in clinical tissues
Clinical tissue samples of benign nevus and melanoma were collected at the Department of Dermatology, Xijing Hospital affiliated with the Fourth Military Medical University in Xi'an, China. The eligibility criteria for the recruitment of nevus patients and melanoma patients were set as follows: (1) histologically-confirmed benign nevus and melanoma at different stages; (2) receiving surgical resection; (3) availability of complete clinical and follow-up data; (4) no preoperative anticancer treatment; and (5) no history of other malignancy. The patients' demographic information and clinical data were collected by well-trained staff interviewers or clinical specialists. The study was approved by the Ethics Committee of the Fourth Military Medical University and written informed consent was obtained from all participants.
Specimens were excised from the patients, fixed in formalin, embedded in paraffin, and cut into 4-μm-thick sections. Slides were dewaxed and rehydrated through a series of xylene and alcohol washes. Antigen retrieval was performed by heating under pressure in sodium citrate buffer (10 mM, pH 6.0) for 2 min. Immunofluorescence staining was performed by incubating the slides with a primary antibody (rabbit anti-SIRT6, 1:100; Novus, NB100-2522; or rabbit anti-LC3, 1:100; Cell Signaling Technology, 3868), co-staining for melanocyte marker MLANA (Abcam, ab51061) diluted in the blocking solution at 4°C overnight, followed by 1-h incubation at room temperature with appropriate secondary antibodies including goat anti-rabbit IgG (H+L) secondary antibody, Alexa Fluor® 568 conjugate (Invitrogen, A-11011) and goat anti-mouse IgG (H+L) secondary antibody, Alexa Fluor® 488 conjugate (Invitrogen, A-11001). DAPI (ROCHE, 10236276001) was used as a counterstain. A negative control and a positive control were included. Tissue sections were analyzed by confocal laser scanning microscopy (LSM510; Carl Zeiss AB, Jena, Germany).
Nude mice xenograft model
Six-wk-old NOD/SCID nude mice with the average body weight of 18 to 22 g were randomly divided into the indicated groups. Xenografts were initiated by subcutaneous injection of 1 × 10⁷ WM793B-FLAG, WM793B-WT1 and WM793B-WT2 cells or by A2058-Ctr-shRNA, A2058-SIRT6-shRNA1 and A2058-SIRT6-shRNA2 cells (on the same sides, respectively) into the back of nude mice (n = 5 per group). Mice were checked for the volumes of the tumors every 2 d. Thirty-three d later, the mice were sacrificed and the tumors were harvested and photographed. The tumor and organ tissues were lavaged 4 times with PBS. Metastatic foci on the surface of organs were counted in 3 blinded tests by different technicians. Tumor diameters were determined with microcalipers. The study was approved by the ethics committee of the Fourth Military Medical University for animal research.
Autophagosome analysis
Autophagosomes were monitored by both confocal laser scanning and transmission electron microscopy. Immunofluorescence assay: After the indicated treatments, the culture dishes were shaken gently to remove dead cells and the supernatant was discarded. Then the plates were rinsed with PBS 3 times. Subsequently, cells were fixed in ice-cold 3.7% paraformaldehyde for 10 min, followed by 3 rinses, and were permeabilized with 0.5% Triton X-100 (Sigma Aldrich, T9284) for 10 min. All of the operations above should be protected from light. After washing the plates with PBS, nuclei were stained with DAPI at room temperature and eventually analyzed by confocal laser scanning microscopy (LSM510; Carl Zeiss AB, Jena, Germany). At least a total of 20 randomly selected fields were evaluated. Nuclei (100) with red fluorescence were counted and the percentage of the cells showing abundant cytoplasmic puncta was displayed as the means ± SD.
Transmission electron microscopy: After the indicated treatments for 24 h, cells were collected and washed in cold PBS, fixed in EM fixative buffer in 4°C for 24 h. Fixative buffer was removed and the cell pellet was carefully rinsed with Millonig's buffer (Electron Microscopy Sciences, 11582-05) in triplicate. The cell pellet was then minced post-fixing in 1.0% OsO4, en bloc stained with 2.0% aqueous uranyl acetate, and embedded in SPI-Pon 812 Resin (SPI Supplies, 02660-AB). Ultra-thin section analysis was visualized using a Tecnai™ G2 Spirit BioTwin (FEI, Hillsboro, OR).
Statistical analysis
Data are shown as the average taken from at least 3 independent experiments. A Student t test was used for comparison of 2 data sets, and ANOVA for multiple data sets. Tukey's or Dunn's test was used for parametric and nonparametric data, respectively. Spearman's rank correlation test was used for correlation analysis. Significance was defined as P < 0.05. The statistical software Prism v.5 (GraphPad Software, San Diego, CA) was used.
Disclosure of potential conflicts of interest
No potential conflicts of interest were disclosed.
Suup_data.zip
Download Zip (42.8 MB)Acknowledgements
We would like to thank the doctors and the patients who participated in our study for their support. We also thank Professor Yongzhan Nie (State Key Laboratory of Cancer Biology & Xijing Hospital of Digestive Diseases, Fourth Military Medical University, Xi'an, China) for his technical guidance and assistance.
Additional information
Funding
References
- Siegel RL, Miller KD, Jemal A. Cancer statistics, 2015. CA Cancer J Clin. 2015;65(1):5–29. doi:10.3322/caac.21254. PMID:25559415
- Lo JA, Fisher DE. The melanoma revolution: from UV carcinogenesis to a new era in therapeutics. Science. 2014;346(6212):945–949. doi:10.1126/science.1253735. PMID:25414302
- Kang HB, Fan J, Lin R, et al. Metabolic rewiring by oncogenic BRAF V600E links ketogenesis pathway to BRAF-MEK1 signaling. Mol Cell. 2015;59(3):345–358. doi:10.1016/j.molcel.2015.05.037. PMID:26145173
- Robert C, Karaszewska B, Schachter J, et al. Improved overall survival in melanoma with combined dabrafenib and trametinib. N Engl J Med. 2015;372(1):30–39. doi:10.1056/NEJMoa1412690. PMID:25399551
- Larkin J, Chiarion-Sileni V, Gonzalez R, et al. Combined nivolumab and ipilimumab or monotherapy in untreated melanoma. N Engl J Med. 2015;373(1):23–34. doi:10.1056/NEJMoa1504030. PMID:26027431
- White E. Deconvoluting the context-dependent role for autophagy in cancer. Nat Rev Cancer. 2012;12(6):401–410. doi:10.1038/nrc3262. PMID:22534666
- White E. The role for autophagy in cancer. J Clin Invest. 2015;125(1):42–46. doi:10.1172/jci73941. PMID:25654549
- Zhao GX, Pan H, Ouyang DY, et al. The critical molecular interconnections in regulating apoptosis and autophagy. Ann Med. 2015;47(4):305–315. doi:10.3109/07853890.2015.1040831. PMID:25982797
- Mathew R, White E. Autophagy, stress, and cancer metabolism: what doesn't kill you makes you stronger. Cold Spring Harb Symp Quant Biol. 2011;76:389–396. doi:10.1101/sqb.2012.76.011015. PMID:22442109
- Corazzari M, Fimia GM, Lovat P, et al. Why is autophagy important for melanoma? Molecular mechanisms and therapeutic implications. Semin Cancer Biol. 2013;23(5):337–43. doi:10.1016/j.semcancer.2013.07.001. PMID:23856558
- Maes H, Agostinis P. Autophagy and mitophagy interplay in melanoma progression. Mitochondrion. 2014;19 Pt A:58–68. PMID:25042464. doi:10.1016/j.mito.2014.07.003
- Giglio P, Fimia GM, Lovat PE, et al. Fateful music from a talented orchestra with a wicked conductor: connection between oncogenic BRAF, ER stress, and autophagy in human melanoma. Mol Cell Oncol. 2015;2(3):e995016. doi:10.4161/23723556.2014.995016. PMID:27308477
- Liu H, He Z, von Rütte T, et al. Down-regulation of autophagy-related protein 5 (ATG5) contributes to the pathogenesis of early-stage cutaneous melanoma. Sci Transl Med. 2013;5(202):202ra123. doi:10.1126/scitranslmed.3005864. PMID:24027027
- Xie X, Koh JY, Price S, et al. Atg7 overcomes senescence and promotes growth of BrafV600E-driven melanoma. Cancer Discov. 2015;5(4):410–423. doi:10.1158/2159-8290.cd-14-1473. PMID:25673642
- Michishita E, Park JY, Burneskis JM, et al. Evolutionarily conserved and nonconserved cellular localizations and functions of human SIRT proteins. Mol Biol Cell. 2005;16(10):4623–4635. doi:10.1091/mbc.E05-01-0033. PMID:16079181
- Salminen A, Kauppinen A, Kaarniranta K. AMPK/Snf1 signaling regulates histone acetylation: impact on gene expression and epigenetic functions. Cell Signal. 2016;28(8):887–895. doi:10.1016/j.cellsig.2016.03.009. PMID:27010499
- Strzyz P. Chromatin: SIRT6 keeps pericentromeric transcription in check. Nat Rev Mol Cell Biol. 2016;17(5):264–265. doi:10.1038/nrm.2016.46
- Tasselli L, Xi Y, Zheng W, et al. SIRT6 deacetylates H3K18ac at pericentric chromatin to prevent mitotic errors and cellular senescence. Nat Struct Mol Biol. 2016;23(5):434–440. doi:10.1038/nsmb.3202. http://www.nature.com/nsmb/journal/v23/n5/abs/nsmb.3202.html#supplementary-information
- Lin Z, Yang H, Tan C, et al. USP10 antagonizes c-Myc transcriptional activation through SIRT6 stabilization to suppress tumor formation. Cell Rep. 2013;5(6):1639–1649. doi:10.1016/j.celrep.2013.11.029. PMID:24332849
- Zhong L, D'Urso A, Toiber D, et al. The histone deacetylase Sirt6 regulates glucose homeostasis via Hif1alpha. Cell. 2010;140(2):280–293. doi:10.1016/j.cell.2009.12.041. PMID:20141841
- Bauer I, Grozio A, Lasigliè D, et al. The NAD+-dependent histone deacetylase SIRT6 promotes cytokine production and migration in pancreatic cancer cells by regulating Ca2+ responses. J Biol Chem. 2012;287(49):40924–40937. doi:10.1074/jbc.M112.405837. PMID:23086953
- Min L, Ji Y, Bakiri L, et al. Liver cancer initiation is controlled by AP-1 through SIRT6-dependent inhibition of survivin. Nat Cell Biol. 2012;14(11):1203–1211. doi:10.1038/ncb2590. PMID:23041974
- Sebastian C, Zwaans BM, Silberman DM, et al. The histone deacetylase SIRT6 is a tumor suppressor that controls cancer metabolism. Cell. 2012;151(6):1185–1199. doi:10.1016/j.cell.2012.10.047. PMID:23217706
- Ming M, Han W, Zhao B, et al. SIRT6 promotes COX-2 expression and acts as an oncogene in skin cancer. Cancer Res. 2014;74(20):5925–5933. doi:10.1158/0008-5472.can-14-1308. PMID:25320180
- Pillai VB, Sundaresan NR, Gupta MP. Regulation of Akt signaling by sirtuins: its implication in cardiac hypertrophy and aging. Circ Res. 2014;114(2):368–78. doi:10.1161/circresaha.113.300536. PMID:24436432
- Shao J, Yang X, Liu T, et al. Autophagy induction by SIRT6 is involved in oxidative stress-induced neuronal damage. Protein Cell. 2016;7(4):281–290. doi:10.1007/s13238-016-0257-6. PMID:26983852
- Lu J, Sun D, Liu Z, et al. SIRT6 suppresses isoproterenol-induced cardiac hypertrophy through activation of autophagy. Transl Res: J Lab Clin Med. 2016;172:96–112.e6. doi:10.1016/j.trsl.2016.03.002. PMID:27016702
- Takasaka N, Araya J, Hara H, et al. Autophagy induction by SIRT6 through attenuation of insulin-like growth factor signaling is involved in the regulation of human bronchial epithelial cell senescence. J Immunol (Baltimore, Md: 1950). 2014;192(3):958–968. doi:10.4049/jimmunol.1302341. PMID:24367027
- Klionsky DJ, Abdelmohsen K, Abe A, et al. Guidelines for the use and interpretation of assays for monitoring autophagy (3rd edition). Autophagy. 2016;12(1):1–222. doi:10.1080/15548627.2015.1100356. PMID:26799652
- Sundaresan NR, Vasudevan P, Zhong L, et al. The sirtuin SIRT6 blocks IGF-Akt signaling and development of cardiac hypertrophy by targeting c-Jun. Nat Med. 2012;18(11):1643–1650. doi:10.1038/nm.2961. PMID:23086477
- Hilmi C, Larribere L, Giuliano S, et al. IGF1 promotes resistance to apoptosis in melanoma cells through an increased expression of BCL2, BCL-X(L), and survivin. J Invest Dermatol. 2008;128(6):1499–1505. doi:10.1038/sj.jid.5701185. PMID:18079751
- Herkert B, Kauffmann A, Mollé S, et al. Maximizing the efficacy of MAPK-targeted treatment in PTENLOF/BRAFMUT melanoma through PI3K and IGF1R inhibition. Cancer Res. 2016;76(2):390–402. doi:10.1158/0008-5472.can-14-3358. PMID:26577700
- Flashner-Abramson E, Klein S, Mullin G, et al. Targeting melanoma with NT157 by blocking Stat3 and IGF1R signaling. Oncogene. 2016;35(20):2675–2680. doi:10.1038/onc.2015.229. PMID:26119932
- Wang RC, Wei Y, An Z, et al. Akt-mediated regulation of autophagy and tumorigenesis through Beclin 1 phosphorylation. Science. 2012;338(6109):956–959. doi:10.1126/science.1225967. PMID:23112296
- Liu Y, Xie QR, Wang B, et al. Inhibition of SIRT6 in prostate cancer reduces cell viability and increases sensitivity to chemotherapeutics. Protein Cell. 2013;4(9):702–710. doi:10.1007/s13238-013-3054-5. PMID:23982738
- Han Z, Liu L, Liu Y, et al. Sirtuin SIRT6 suppresses cell proliferation through inhibition of Twist1 expression in non-small cell lung cancer. Int J Clin Exp Pathol. 2014;7(8):4774–4781. PMID:25197348
- Fukuda T, Wada-Hiraike O, Oda K, et al. Putative tumor suppression function of SIRT6 in endometrial cancer. FEBS Lett. 2015;589(17):2274–2281. doi:10.1016/j.febslet.2015.06.043. PMID:26183563
- Ran LK, Chen Y, Zhang ZZ, et al. SIRT6 overexpression potentiates apoptosis evasion in hepatocellular carcinoma via BCL2-associated X protein-dependent apoptotic pathway. Clin Cancer Res: An Official Journal Of The American Association For Cancer Research. 2016. doi:10.1158/1078-0432.ccr-15-1638. PMID:26861461
- Lerrer B, Gertler AA, Cohen HY. The complex role of SIRT6 in carcinogenesis. Carcinogenesis. 2016;37(2):108–118. doi:10.1093/carcin/bgv167. PMID:26717993
- Kawahara TL, Michishita E, Adler AS, et al. SIRT6 links histone H3 lysine 9 deacetylation to NF-kappaB-dependent gene expression and organismal life span. Cell. 2009;136(1):62–74. doi:10.1016/j.cell.2008.10.052. PMID:19135889
- Maes H, Martin S, Verfaillie T, et al. Dynamic interplay between autophagic flux and Akt during melanoma progression in vitro. Exp Dermatol. 2014;23(2):101–106. doi:10.1111/exd.12298. PMID:24313465
- Rangwala R, Chang YC, Hu J, et al. Combined MTOR and autophagy inhibition: phase I trial of hydroxychloroquine and temsirolimus in patients with advanced solid tumors and melanoma. Autophagy. 2014;10(8):1391–1402. doi:10.4161/auto.29119. PMID:24991838
- Kaur A, Webster MR, Marchbank K, et al. sFRP2 in the aged microenvironment drives melanoma metastasis and therapy resistance. Nature. 2016;532(7598):250–254. doi:10.1038/nature17392. PMID:27042933
- Davies MA, Stemke-Hale K, Lin E, et al. Integrated molecular and clinical analysis of AKT activation in metastatic melanoma. Clin Cancer Res: An Official Journal Of The American Association For Cancer Research 2009;15(24):7538–7546. doi:10.1158/1078-0432.ccr-09-1985. PMID:19996208
- Ye Y, Jin L, Wilmott JS, et al. PI(4,5)P2 5-phosphatase A regulates PI3K/Akt signalling and has a tumour suppressive role in human melanoma. Nat Commun. 2013;4:1508. doi:10.1038/ncomms2489. PMID:23443536
- Franke TF. PI3K/Akt: getting it right matters. Oncogene. 2008;27(50):6473–6488. doi:10.1038/onc.2008.313. PMID:18955974
- Kugel S, Sebastián C, Fitamant J, et al. SIRT6 suppresses pancreatic cancer through control of Lin28b. Cell. 2016;165(6):1401–1415. doi:10.1016/j.cell.2016.04.033. PMID:27180906
- Alayev A, Berger SM, Holz MK. Resveratrol as a novel treatment for diseases with mTOR pathway hyperactivation. Ann N Y Acad Sci. 2015;1348(1):116–1123. doi:10.1111/nyas.12829. PMID:26200935
- Dong L, Jin L, Tseng HY, et al. Oncogenic suppression of PHLPP1 in human melanoma. Oncogene. 2014;33(39):4756–4766. doi:10.1038/onc.2013.420. PMID:24121273
- Wilking MJ, Singh C, Nihal M, et al. SIRT1 deacetylase is overexpressed in human melanoma and its small molecule inhibition imparts anti-proliferative response via p53 activation. Arch Biochem Biophys. 2014;563:94–100. doi:10.1016/j.abb.2014.04.001. PMID:24751483
- Ohanna M, Bonet C, Bille K, et al. SIRT1 promotes proliferation and inhibits the senescence-like phenotype in human melanoma cells. Oncotarget. 2014;5(8):2085–2095. doi:10.18632/oncotarget.1791. PMID:24742694
- George J, Nihal M, Singh CK, et al. Pro-proliferative function of mitochondrial sirtuin deacetylase SIRT3 in human melanoma. J Invest Dermatol. 2016;136(4):809–818. doi:10.1016/j.jid.2015.12.026. PMID:26743598
- Jian Z, Li K, Song P, et al. Impaired activation of the Nrf2-ARE signaling pathway undermines H2O2-induced oxidative stress response: a possible mechanism for melanocyte degeneration in vitiligo. J Invest Dermatol. 2014;134(8):2221–2230. doi:10.1038/jid.2014.152. PMID:24662764
- Ge R, Liu L, Dai W, et al. Xeroderma pigmentosum Group A promotes autophagy to facilitate cisplatin resistance in melanoma cells through the activation of PARP1. J Invest Dermatol. 2016;136(6):1219–1228. doi:10.1016/j.jid.2016.01.031. PMID:26880244