
ABSTRACT
Tamoxifen is commonly used to treat patients with ESR/ER-positive breast cancer, but its therapeutic benefit is limited by the development of resistance. Recently, alterations in macroautophagy/autophagy function were demonstrated to be a potential mechanism for tamoxifen resistance. Although MTA1 (metastasis-associated 1) has been implicated in breast tumorigenesis and metastasis, its role in endocrine resistance has not been studied. Here, we report that the level of MTA1 expression was upregulated in the tamoxifen resistant breast cancer cell lines MCF7/TAMR and T47D/TR, and knockdown of MTA1 sensitized the cells to 4-hydroxytamoxifen (4OHT). Moreover, knockdown of MTA1 significantly decreased the enhanced autophagy flux in the tamoxifen resistant cell lines. To confirm the role of MTA1 in the development of tamoxifen resistance, we established a cell line, MCF7/MTA1, which stably expressed MTA1. Compared with parental MCF7, MCF7/MTA1 cells were more resistant to 4OHT-induced growth inhibition in vitro and in vivo, and showed increased autophagy flux and higher numbers of autophagosomes. Knockdown of ATG7 or cotreatment with hydroxychloroquine, an autophagy inhibitor, restored sensitivity to 4OHT in both the MCF7/MTA1 and tamoxifen resistant cells. In addition, AMP-activated protein kinase (AMPK) was activated, probably because of an increased AMP:ATP ratio and decreased expression of mitochondrial electron transport complex components. Finally, publicly available breast cancer patient datasets indicate that MTA1 levels correlate with poor prognosis and development of recurrence in patients with breast cancer treated with tamoxifen. Overall, our findings demonstrated that MTA1 induces AMPK activation and subsequent autophagy that could contribute to tamoxifen resistance in breast cancer.
Abbreviations
| 4OHT | = | 4-hydroxytamoxifen |
| ACTB | = | actin beta |
| PRKAA | = | protein kinase AMP-activated catalytic subunit alpha |
| p-PRKAA | = | phosphorylated PRKAA |
| ATG7 | = | autophagy related 7 |
| BCAS3 | = | BCAS3, microtubule associated cell migration factor |
| ChIP-seq | = | chromatin immunoprecipitation sequencing |
| COX4I1 | = | cytochrome c oxidase subunit 4I1 |
| CYC1 | = | cytochrome c1 |
| EGFR | = | epidermal growth factor receptor |
| ERBB2/HER2 | = | erb-b2 receptor tyrosine kinase 2 |
| ESR | = | estrogen receptor |
| ESR1/ERα | = | estrogen receptor 1 |
| FBS | = | fetal bovine serum |
| HCQ | = | hydroxychloroquine |
| MAPK | = | mitogen-activated protein kinase |
| MT-CO1 | = | mitochondrially encoded cytochrome c oxidase I |
| MTA1 | = | metastasis associated 1 |
| NBR1 | = | NBR1, autophagy cargo receptor |
| NDUFB8 | = | NADH:ubiquinone oxidoreductase subunit B8 |
| OCR | = | oxygen consumption rate |
| OXPHOS | = | mitochondrial oxidative phosphorylation |
| RPS6KB1/p70S6K | = | ribosomal protein S6 kinase B1 |
| p-RPS6KB1/p-p70S6K | = | phosphorylated ribosomal protein S6 kinase B1 |
| PI3K | = | phosphoinositide 3-kinase |
| SDHB | = | succinate dehydrogenase complex iron sulfur subunit B |
| TFAP2C | = | transcription factor AP2-2 gamma |
| TSS | = | transcriptional start site |
| UQCRC2 | = | ubiquinol-cytochrome c reductase core protein II |
Introduction
Breast cancer is the most commonly diagnosed malignant cancer in women worldwide.Citation1 Recently, advances in earlier diagnosis, improved surgical techniques, and better adjuvant medical therapies, have improved mortality; however, breast cancer remains the second most common cause of death from cancer in women.Citation2 Breast cancers are characterized into 4 basic types: luminal A, luminal B, ERBB2/HER2 (erb-b2 receptor tyrosine kinase 2), and basal-like types, based on their molecular expression of ESR1/ERα (estrogen receptor 1), PGR (progesterone receptor), and ERBB2, which provides an opportunity to identify patients who can benefit from specific therapies. Almost 80% of breast cancers are ESR1 positive.Citation2 For these cancers, adjuvant hormonal therapy employing ESR (estrogen receptor) antagonists or aromatase inhibitors has been applied to reduce the risk of relapse by eradicating potential metastases.Citation3 Tamoxifen is a selective ER modulator that competitively blocks the binding of estradiol to ER, thereby inhibiting the ER-mediated transcription of various target genes that induce proliferation of cancer cells. Tamoxifen significantly reduces the risk of recurrence of ESR-positive breast cancer and therefore has been used for more than 40 y for endocrine therapy, especially for premenopausal women.Citation4,Citation5
Despite its effectiveness in the adjuvant setting as well as in first-line therapy for advanced ESR-positive breast cancer, approximately 20% to 30% of cases are resistant to tamoxifen.Citation6 The tamoxifen-resistant cancers either have an intrinsically resistant phenotype, called innate resistance, or they acquire resistance after prolonged exposure to tamoxifen.Citation7 The development of tamoxifen resistance appears to involve multiple mechanisms. Altered or lost ESR expression as a result of epigenetic modifications or mutations in the ESR1 gene has been observed in many patients with metastatic breast cancer.Citation8,Citation9 Activation of alternative signaling pathways that promote cell proliferation—such as signaling pathways involving ERBB2, EGFR (epidermal growth factor receptor), IGF1R (insulin like growth factor 1 receptor), MAPK (mitogen-activated protein kinase), and phosphoinositide 3-kinase (PI3K)-MTOR (mechanistic target of rapamycin)—induces tamoxifen resistance.Citation7 In addition, increased expression of microRNAs that target the expression and transcriptional function of ESR1 has been reported as a mechanism of tamoxifen resistance.Citation10
Autophagy is a cellular process whereby cells eliminate misfolded intracellular proteins and damaged organelles through lysosomal degradation to recycle their nutrients.Citation11 Recently, alterations in autophagy function have been demonstrated to be a potential mechanism of tamoxifen resistance. 4-hydroxytamoxifen (4OHT), an active metabolite of tamoxifen, induces autophagy that is associated with increased survival in ESR-positive breast cancer cells.Citation12 Breast cancer cells that are tamoxifen resistant exhibit an increased turnover of autophagosomes compared with tamoxifen sensitive cells.Citation13,Citation14 Silencing of genes for proteins involved in autophagy processes, such as ATG5, ATG7, or BECN1/Beclin1, restores sensitivity to tamoxifen in breast cancer cells.Citation15 Treatment with the autophagy inhibitors 3-methyladenine and hydroxychloroquine (HCQ) enhance cell death in tamoxifen resistant cancer cells and restores tamoxifen sensitivity to resistant tumors.Citation12,Citation16 However, the molecular mechanism by which autophagy is enhanced in tamoxifen resistant breast cancer is largely unknown. Clarification of the detailed mechanism by which autophagy is linked to tamoxifen resistance could provide appropriate prognostic or predictive biomarkers for the development of tamoxifen resistance and facilitate the design of novel strategies to resensitize tamoxifen resistant breast cancer cells.
MTA1 (metastasis associated 1)—a cancer progression-related gene product that is overexpressed in human breast cancer—has pathophysiological features that correlate well with tumorigenesis characterized by invasion and metastasis.Citation17,Citation18 MTA1 was mapped to a region showing significantly higher heterozygosity in primary breast cancers with metastasis compared with node-negative tumors.Citation19 MTA1 overexpression is closely associated with higher tumor grade and correlated with poorer clinical outcomes.Citation20-22 Moreover, some evidence suggests that MTA1 is associated with acquired tamoxifen resistance. In ESR1-positive breast cancer cells, MTA1 represses the transactivation function of ESR1, leading to ESR1-negative phenotypes that could increase aggressiveness as well as resistance to anti-estrogens.Citation23,Citation24 A downstream target gene of MTA1, BCAS3 (BCA3, microtubule associated cell migration factor), is overexpressed in ESR1-positive premenopausal breast cancer and seems to be associated with impaired responses to tamoxifen.Citation25 However, so far, no clear evidence has been provided for the role of MTA1 in the development of tamoxifen resistance. Here, we report that MTA1 could induce tamoxifen resistance in ESR-positive breast cancer cells and that induction of autophagy via activation of the AMPK pathway may be the underlying molecular mechanism for this effect of MTA1.
Results
Autophagy is enhanced in tamoxifen-resistant breast cancer cells
To investigate the role of MTA1 in development of tamoxifen resistance, we employed the well-characterized tamoxifen resistant breast cancer cell lines MCF7/TAMR-1, MCF7/TAMR-8, T47D/TR-1, and T47D/TR-2, which were established after long-term treatment with tamoxifen, and their parental sublines, MCF-7/S0.5 and T47D/S2.Citation26,Citation27 We first tested whether autophagy played a role in tamoxifen resistance in these tamoxifen-resistant cells. To examine autophagic flux, we monitored the accumulation of LC3 protein in the presence or absence of bafilomycin A1, which blocks the fusion between autophagosomes and lysosomes. Both the basal level of LC3 and the level after bafilomycin A1 treatment increased in the tamoxifen-resistant breast cancer cells compared with those in MCF7/S0.5 and T47D/S2. Cotreatment with 4OHT significantly increased the LC3 level, especially in the tamoxifen-resistant breast cancer sublines (A and Fig. S1A). Consistently, the level of NBR1, an autophagy-degraded receptor protein, was decreased more in MCF7/TAMR-1 in comparison with MCF7/S0.5. Because activation of autophagy leads to clearance of NBR1, this result indicates that autophagy flux increased in MCF7/TAMR-1 cells (A).Citation11 In addition, the number of autophagic puncta increased in the tamoxifen- resistant breast cancer cells after treatment with 4OHT alone or in combination with bafilomycin A1 (B and Fig. S1B).
Figure 1. Autophagy is elevated in the tamoxifen- resistant breast cancer cells. (A) The tamoxifen-resistant MCF7/TAMR-1 cells were treated with 2 μM 4OHT for 24 h. At the end of incubation, 20 nM bafilomycin A1 (Baf) was added at 1 h prior to examination of autophagy flux. The expression of LC3 and NBR1 was determined by western blotting (left). The LC3-II and NBR1 levels were quantified from band intensity using imageJ and expressed as relative to the level in the parent cells without treatment. The values were normalized by the intensities of the corresponding TUBA/α-tubulin band. Data are presented as the mean±SEM (n = 3). *, P< 0.05, **, P< 0.01 and ***, P< 0.001 (right). (B) The MCF7/TAMR-1 and their parental cells were infected with the Ad-GFP-LC3 virus for 24 h and then treated with 5 μM 4OHT for another 24 h. At the end of incubation, 100 nM Baf was treated at 2 h prior to examination of autophagy flux. LC3 puncta was examined by confocal microscopy. The LC3-puncta in each cell were counted (n = 50 cells/sample). Data obtained from 1 of 3 independent experiments with similar results were presented. Data are presented as the mean±SEM. ***, P< 0.001 (bottom). (C) Transmission electron microscopy images of MCF7/TAMR-1 or T47D/TR-1 cells treated with 5 μM 4OHT for 24 h. Arrowheads indicate autophagic vacuoles. (D) The MCF7/TAMR-1 and their parental cells were transfected with siATG7 or treated with 1 μM HCQ. Then cells were treated with 1 μM 4OHT for the indicated time periods and the number of viable cells was counted using a hemocytometer. Cell numbers were presented as the mean±SEM from duplicate plates and data obtained from 1 of 3 independent experiments with similar results are presented. ***, P< 0.001.
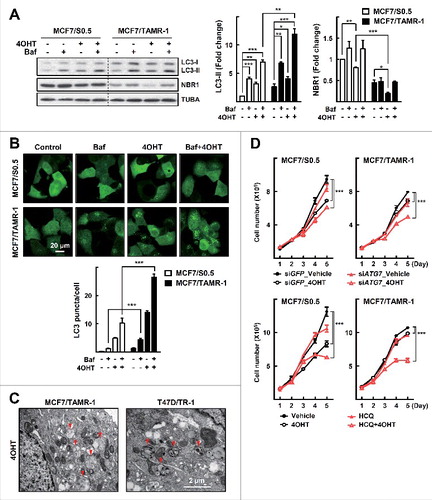
Typical double-membrane autophagic vesicles were detected in these cells when their ultrastructure was examined using transmission electron microscopy (C). Next, we examined whether knockdown of ATG7, a critical autophagy gene, or treatment with HCQ, an inhibitor of autophagy, could restore sensitivity to 4OHT in parental and tamoxifen resistant cells. As previously shown, treatment with 4OHT inhibited growth of the parental cells but not that of MCF7/TAMR-1 cells.Citation26 Combined treatment with 4OHT and siATG7 or with HCQ had little effect on the growth of the parental cells but induced significant inhibition of the growth of MCF7/TAMR-1 cells (D). Together, these data indicate that autophagy activity was enhanced in the MCF7/TAMR-1 and T47D/TR-1 cells, and that this was associated with tamoxifen resistance.
MTA1 is upregulated in the tamoxifen resistant cells and enhances autophagy flux
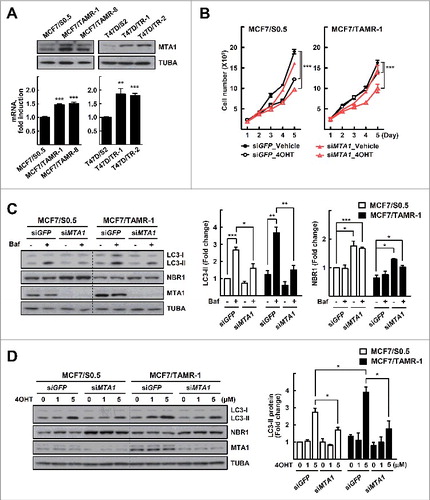
MTA1 is overexpressed in breast cancers, and its expression correlates well with malignant transformation characterized by invasion and metastasis.Citation17 Although some observations suggest that MTA1 is associated with acquired tamoxifen resistance, clear evidence has not been provided. Therefore, we analyzed the expression level of MTA1 in the MCF7/TAMR and T47D/TR cells. Interestingly, expression of MTA1 was upregulated at both protein and mRNA levels in all the tamoxifen resistant breast cancer cells (A). Knockdown of MTA1 using RNA interference in the sensitive parental cells showed little effect on cell growth after 4OHT treatment. However, siMTA1 transfection of the MCF7/TAMR-1 cells resulted in a significant reduction in cell growth after 4OHT treatment, compared with siGFP transfection that generated no significant effect with 4OHT treatment. This result indicates that knockdown of MTA1 restored the tamoxifen sensitivity in MCF7/TAMR-1 cells (B). Next, we examined whether knockdown of MTA1 could affect autophagy flux in MCF7/TAMR-1 cells. Knockdown of MTA1 significantly reduced the basal and tamoxifen-induced autophagy flux estimated from the level of LC3 protein. The expression level of NBR1 increased after silencing of MTA1 in MCF7/S0.5 and MCF7/TAMR-1 cells, indicating that autophagic degradation of NBR1 was inhibited when MTA1 was silenced (C, D and Fig. S2). Together, these results showed that MTA1 was overexpressed and that it overcame the growth-inhibitory effect of tamoxifen in tamoxifen-resistant breast cancer cells.
Figure 2. MTA1 is upregulated in the tamoxifen resistant breast cancer cells. (A) Whole cell lysates and total RNA obtained from the tamoxifen resistant and their parental cells were subjected to western blotting (top) and qRT-PCR analysis (bottom). Expression was normalized using the ACTB gene. Data are presented as the mean fold change over control±SEM (n = 3). **, P< 0.01 and ***, P< 0.001. (B) The MCF7/TAMR-1 and the parental cells were transfected with siMTA1 and then treated with 1 μM 4OHT for the indicated time periods. The number of viable cells were counted using a hemocytometer. Cell numbers were presented as the mean±SEM from duplicate plates and data obtained from 1 of 3 independent experiments with similar results are presented. ***, P< 0.001. (C) The MCF7/TAMR-1 and the parental cells were transfected with siMTA1 for 48 h. At the end of incubation, 20 nM bafilomycin A1 (Baf) was added at 1 h prior to examination of autophagy flux. (D) The MCF7/TAMR-1 and the parental cells were transfected with siRNAs for 48 h and then treated with 4OHT for an additional 24 h. The expression of LC3 and NBR1 was determined by western blotting. The LC3-II and NBR1 level was quantified from band intensity using imageJ and expressed as relative to the level in the parent cells without treatment. The values were normalized by the intensities of the corresponding TUBA band. Data are presented as the mean±SEM (n = 3). *, P< 0.05, **, P< 0.01 and ***, P< 0.001 (right). Quantification of NBR1 is shown in Fig. S2A.
MTA1 induces tamoxifen resistance through activation of autophagy
To investigate further the function of MTA1 in tamoxifen resistance, we established MCF7 sublines that stably expressed MTA1 using the lentiviral delivery pLJM1 vector system (A). First, we found that the MTA1-overexpressing cells exhibited reduced tamoxifen sensitivity (B, Fig. S3A). Consistent with this, subcutaneous transplantation of the MTA1-overexpressing MCF7 cells into athymic mice led to significant tamoxifen resistance (C). Autophagy flux and the number of LC3 puncta were increased significantly in the MTA1-overexpressing cells (A, Fig. S3B and C). mCherry-GFP-LC3 allows distinction between autophagosomes and autolysosomes because GFP fluorescence is quenched upon fusion between autophagosomes and lysosomes due to the low lysosomal pH, whereas mCherry fluorescence is much less affected.Citation11 Thus, in the merged images, yellow puncta indicate autophagosomes, and red puncta indicate autolysosomes. As shown in Fig, 4B, formation of both autophagosome (yellow in merge) and autolysosomes (red in merge) increased in the MTA1-overexpressing cells, indicating enhanced autophagic flux in these cells (B). Furthermore, formation of autophagosomes and autolysosomes was identified using transmission electron microscopy after 4OHT treatment (C). These results further support the contention that increased expression of MTA1 plays a role in developing tamoxifen resistance as well as in inducing autophagy flux.
Figure 3. MTA1 induces tamoxifen resistance in vitro and in vivo. (A) The MTA1-overexpressing MCF7 cells were established using the pLJM1 lentiviral vector system. Expression level of MTA1 protein was analyzed by western blotting. (B) The MTA1-overexpressing MCF7 cells and the control cells were treated with 1 μM 4OHT for the indicated time points. The number of viable cells were counted using a hemocytometer. Cell numbers were presented as the mean±SEM from duplicate plates and data obtained from 1 of 3 independent experiments with similar results are presented. ***, P< 0.001. (C) Female athymic nude mice were inoculated with the MTA1-overexpressing MCF7 cells. When tumor volume reached approximately 100 mm3, a tamoxifen or mock pellet was implanted subcutaneously. Five wk later, the xenograft tumors were harvested and tumor volume was measured (top). Representative tumor images are shown (bottom). Data were expressed as mean±SEM (n = 4 to 8) in each group. **, P< 0.01.
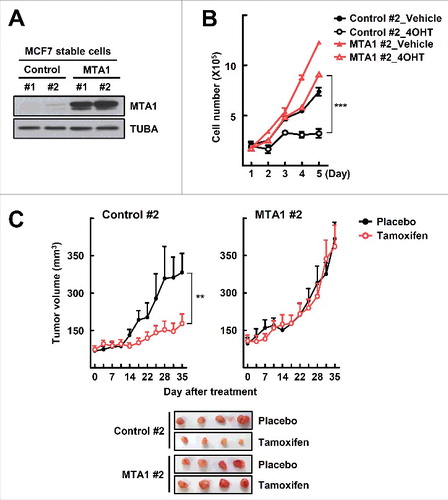
Figure 4. Autophagy is elevated in the MTA1-overexpressing MCF7 cells. (A) The MCF7 cells that stably expressed MTA1 were pretreated with 20 nM bafilomycin A1 (Baf) for 0.5 h and then treated with 5 μM 4OHT for an additional one h prior to examination of autophagy flux. The expression of LC3 was determined by western blotting (left). The LC3-II level was quantified from band intensity using ImageJ and expressed as relative to the level in the control cells without treatment. Values were normalized by the intensities of the corresponding TUBA band. Data are presented as the mean±SEM (n = 3). *, P< 0.05 and ***, P< 0.001 (right). (B) The MCF7 stable cells were infused with Ad-mCherry-GFP-LC3 for 24 h and then treated with 5 μM 4OHT for another 24 h, or treated with 100 nM Baf another 2 h. Then, cells were visualized with a confocal microscope. The autophagosomes (yellow in merge) and autolysosomes (red in merge) in each cell were counted (n = 50 cells/sample). Data obtained from 1 of 3 independent experiments with similar results were presented. Data are presented as the mean±SEM. ***, P< 0.001 (right). (C) Transmission electron microscopy images of the MTA1-overexpressing MCF7 cells treated with 5 μM 4OHT for 24 h. Red arrowheads indicate autophagic vacuoles. (D) The MTA1-overexpressing MCF7 cells and the control cells were transfected with siATG7 or treated with 1 μM HCQ. Then cells were treated with 1 μM 4OHT for the indicated time periods and the number of viable cells was counted using a hemocytometer. Cell numbers were presented as the mean±SEM from duplicate plates and data obtained from one of 3 independent experiments with similar results are presented. ***, P< 0.001.
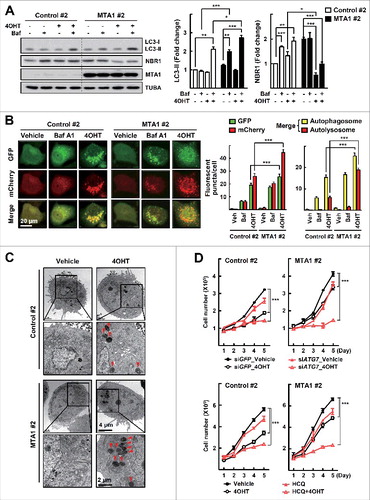
To examine whether the MTA1-induced autophagy flux could contribute to tamoxifen resistance, cells were treated with 4OHT after knockdown of ATG7 in the MTA1-overexpressing cells. The combined treatment had little effect on the growth of the parental cells but induced significant growth inhibition in the MTA1-overexpressing cells (D, Fig. S3D). Similarly, another combination treatment with 4OHT and HCQ induced significant inhibition of the growth of the MTA1-overexpressing cells (D, Fig. S3E). Together, these data indicate that inhibition of autophagy by either genetic or pharmacological means restored the MTA1-induced tamoxifen resistance.
MTA1 regulates autophagy through activation of AMPK
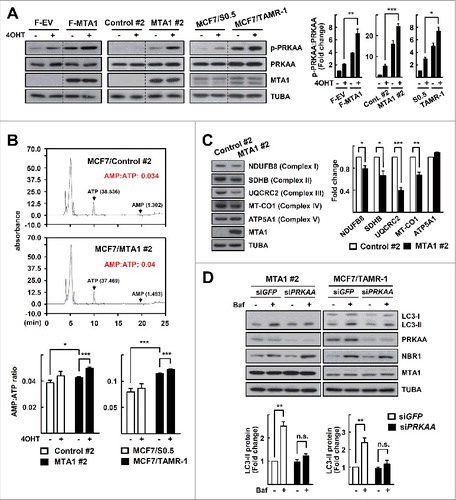
Recently, Marin et al. identified MTA1 as a target of AMPK, which suggested a potential association of AMPK signaling with MTA1-induced autophagy.Citation28 Surprisingly, overexpression of MTA1 increased the activity of AMPK as assessed by the level of PRKAA1 (protein kinase AMPK-activated catalytic subunit alpha 1)-PRKAA2 phosphorylated at threonine residue 172 (p-PRKAA), an active form of PRKAA. 4OHT treatment increased the level of p-PRKAA, and MTA1 overexpression further enhanced the 4OHT-induced p-PRKAA level. The same pattern of PRKAA activation was observed in both the MTA1-overexpressing cells and the MCF7/TAMR cells (A). An increased intracellular AMP:ATP ratio is one of the strongest stimuli for inducing PRKAA activation. The AMP:ATP ratio was increased in both the MTA1-overexpressing cells and in MCF7/TAMR-1, which became apparent after treatment with 4OHT (B). The increased AMP:ATP ratio may result from a loss of mitochondrial function, because levels of the mitochondrial oxidative phosphorylation (OXPHOS) proteins such as NDUFB8 (NADH:ubiquinone oxidoreductase subunit B8), SDHB (succinate dehydrogenase complex iron sulfur subunit B), UQCRC2 (ubiquinol-cytochrome c reductase core protein II), and MT-CO1 (mitochondrially encoded cytochrome c oxidase I) were decreased in the MTA1-overexpressing MCF7 cells (C). Knockdown of PRKAA significantly reduced the autophagy flux and tamoxifen resistance in the MTA1-overexpressing and MCF7/TAMR-1 sublines, indicating that autophagy in these cells was mediated by the AMPK signaling pathway (D, Fig. S4).
Figure 5. MTA1 enhances autophagy through activation of the AMPK pathway. (A) MCF7 cells transfected with a plasmid encoding FLAG-MTA, the MTA1-overexpressing MCF7 cells, the MCF7/TMAR-1 cells, and their control cells were treated with 5 μM 4OHT for 24 h. Expression levels of protein was analyzed by western blotting. The p-PRKAA level was quantified from band intensity using imageJ and expressed as relative to the level in the parent cells without treatment. The values were normalized by the intensities of the corresponding PRKAA band. Data are presented as the mean±SEM (n = 3). *, P< 0.05, **, P< 0.01, and ***, P< 0.001 (right). (B) Quantification of the AMP:ATP ratio by HPLC analysis. The MTA1-overexpressing MCF7 cells, the MCF7/TMAR-1 cells, and their control cells were treated with 5 μM 4OHT for 24 h. Representative HPLC images are shown (top). Data obtained from the HPLC analysis are presented as the mean±SEM (n = 3). *, P< 0.05 and ***, P< 0.001 (bottom). (C) Whole cell lysates were obtained from the MTA1-overexpressing MCF7 cells. A mixture of anti-OXPHOS antibodies was used to detect levels of OXPHOS proteins by western blotting. The protein level was quantified from band intensity using imageJ and expressed as relative to the level in the control cells. Values were normalized by the intensities of the corresponding TUBA band. Data are presented as the mean±SEM (n = 3). *, P< 0.05, **, P< 0.01 and ***, P< 0.001 (right). (D) The MTA1-overexpressing MCF7 cells or the MCF7/TMAR-1 cells were transfected with siPRKAA for 48 h. At the end of incubation, 20 nM bafilomycin A1 (Baf) was added at 1 h prior to examination of autophagy flux. The expression of LC3 and NBR1 was determined by western blotting. The LC3-II level was quantified from band intensity using imageJ and expressed as relative to the level in the parent cells without treatment. Values were normalized by the intensities of the corresponding TUBA band. Data are presented as the mean±SEM (n = 3). **, P< 0.01 (bottom). Quantification of NBR1 is shown in Fig. S2B.
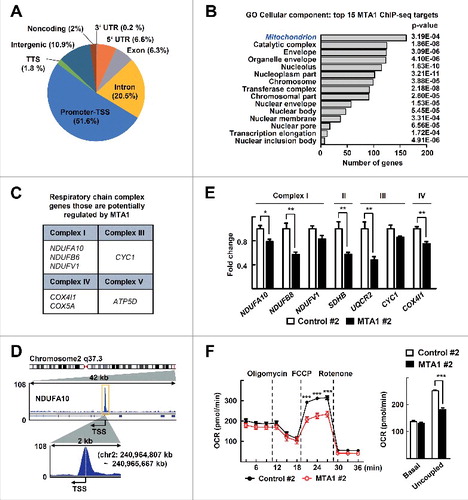
To gain further insight into the role of MTA1 in mitochondrial function, we analyzed the publicly available ChIP-seq data derived from ENCODE. The ChIP-seq data identified 1,533 MTA1 binding peaks (false discovery rate ≤ 0.05, fold enrichment > 2), which were preferentially located in the promoter-transcriptional start site (TSS) and introns (A). Gene Ontology analysis of these peaks revealed that the promoters bound by MTA1 proteins are strongly biased toward nucleoplasm-, nucleolus-, envelope-, and mitochondrion-associated genes (B). Interestingly, regulatory regions in the mitochondrial respiratory chain complex genes, such as NDUFA10, CYC1 (cytochrome c1), and COX4I1 (cytochrome c oxidase subunit 4I1), were identified as potential targets of MTA1 regulation (C-E). Indeed, transcripts of some of the mitochondrial OXPHOS genes were significantly reduced in the MTA1-overexpressing cells (E). Thus, we hypothesized that overexpression of MTA1 may cause mitochondrial dysfunction and subsequent activation of AMPK. To assess whether MTA1 reduces mitochondrial function, we measured the oxygen consumption rate (OCR) in MTA1-overexpressing cells. Although the basal OCR was not much different between MTA1-overexpressing cells and control cells, uncoupled OCR was significantly lower in MTA1-overexpressing cells (F). Consistently, the uncoupled OCR increased after silencing of MTA1 (Fig. S5A). Further, to determine whether the reduced levels of mitochondrial OXPHOS genes were associated with PRKAA activation, we silenced UQCRC2. Knockdown of UQCRC2 activated PRKAA and enhanced autophagy in MCF7 cells, and silencing of MTA1 led to further enhancement (Fig. S5B). Together, these data suggest that an MTA1-induced alteration in mitochondrial function may cause the increased AMP:ATP ratio and subsequent activation of AMPK.
Figure 6. MTA1 binding peaks are clustered at promoter-transcription start sites with a preference for mitochondrial regulatory genes. (A) Genomic location of MTA1-interaction sites. UTR, untranslated region; TSS, transcription start site; TTS, transcription termination site. (B) GO term analysis identifies top 15 enriched cellular components derived from 1,533 MTA1 peaks. (C) List of 7 genes involved in OXPHOS that are potentially regulated by MTA1. (D) Representative ChIP-seq signal of a potential MTA1 target gene, NDUFA10. (E) Total RNA obtained from the MTA1-overexpressing cells and control cells were subjected to qRT-PCR analysis. Expression was normalized using the ACTB gene. Data are presented as the mean fold-change over control±SEM (n = 3). *, P< 0.05 and **, P< 0.01. (F) The basal OCR and uncoupled respiration of MCF7 cells that stably expressed MTA1 and control cells. Data presented as mean ± SEM (n = 3). ***P < 0 .001 (left). The basal OCR, and uncoupled respiration were calculated based on data in the left panel. Data presented as mean ± SEM. ***P < 0 .001 (right).
Elevated MTA1 expression level correlates with poor prognosis and development of recurrence in patients with breast cancer
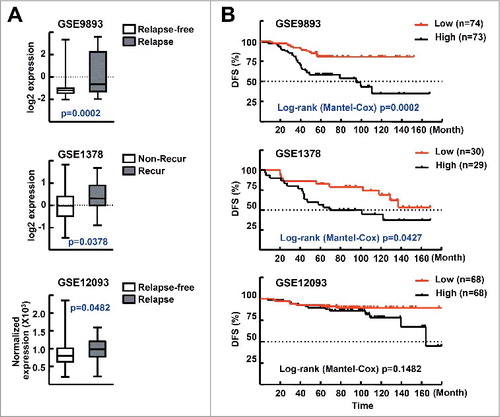
To investigate the clinical relevance of our findings, we analyzed 3 publicly available microarray datasets—i.e., GSE9893, GSE1378, and GSE12093—which include the gene expression profiles and corresponding clinical outcome information, including disease-free survival, of ESR-positive breast cancer patients treated with tamoxifen.Citation29-31 In these datasets, recurrence or relapse includes breast cancer metastasis. First, we found that the expression level of MTA1 was significantly higher in the groups with relapsed or recurrent disease compared with those who were relapse free or had no recurrence (A). We also analyzed the survival rates using the Kaplan–Meier method with a log-rank test. Disease-free survival was significantly lower in the GSE9893 and GSE1378 datasets, and marginally lower in GSE12093, which indicates that MTA1 overexpression confers a high risk of recurrence or relapse in patients treated with tamoxifen. These data also suggest that the MTA1 expression level may be an important prognostic factor for tamoxifen resistance in breast cancer patients (B).
Figure 7. Level of MTA1 expression correlates with clinical outcome in patients with breast cancer. (A) MTA1 expression levels in ESR-positive breast cancer patients who were treated with tamoxifen. The expression levels of MTA1 mRNA in 147 patients with ESR-positive breast cancer treated with tamoxifen for 5 y after surgery (GSE9893) are shown by the log2 expression value (top). The expression levels of MTA1 mRNA in 59 patients with ESR-positive breast cancer treated with standard breast surgery and radiation followed by 5 y of adjuvant tamoxifen (GSE1378) are shown by the log2 expression value (middle). The expression levels of MTA1 mRNA in 136 patients with ESR-positive tumor treated with adjuvant tamoxifen (GSE12093) were shown after normalization and scaled values to a target intensity of 600 (bottom). (B) The association of MTA1 expression levels and disease-free survival. The MTA1 low group includes the case with lower MTA1 levels than the median of all patients in the study, and the rest of the patients belonged to the MTA1-high group.
Discussion
Although basal autophagy is increased in tamoxifen resistant breast cancer cells and genetic or pharmacological inhibition of autophagy restores their sensitivity to tamoxifen, little is known about the mechanisms by which autophagy is enhanced in tamoxifen resistant cancer cells. Here, we show that MTA1 induces persistent activation of AMPK, which is associated with the tamoxifen resistant phenotype (). Recently, tamoxifen was shown to activate AMPK by inhibiting mitochondrial complex I.Citation32 We also observed that the level of mitochondrial complex components—including NDUFB8, SDHB, UQCRC2, and mitochondrially-encoded MT-CO1—was decreased in the MTA-overexpressing MCF7 cells, suggesting that loss of mitochondrial function may be associated with the MTA1-induced tamoxifen resistance (C). Thus, MTA1 and tamoxifen may synergistically induce an activation of AMPK and autophagy that leads to tamoxifen resistance in breast cancer. Our ChIP-seq data analysis showed that “mitochondrion” was one of the most significantly overrepresented cellular component terms for the genes regulated by MTA1. Furthermore, MTA1 potentially regulates OXPHOS genes including NDUFA10 and COX4I1 ().
Tamoxifen-mediated AMPK activation has been reported to promote cell death through inhibition of MTOR.Citation32 In contrast, MTA1 may not affect MTOR activity in that overexpression of MTA1 did not change the basal level and the 4OHT-induced level of p-RPS6KB1:RPS6KB1, a well- known MTOR target (Fig. S6). These results indicate a unique role for MTA1 in maintenance of mitochondrial function and tamoxifen resistance, and further studies are required to understand the pathophysiological implications of such MTA1-regulated mitochondrial function in cancer cell metabolism and metastatic progression of breast cancer.
The role of MTA1 in the regulation of the expression and transcriptional activity of ESR1 is well recognized.Citation18 We previously reported that recruitment of an MTA1 transcription factor, TFAP2C, complex to the ESR1 promoter enhances ESR1 expression in ESR1-positive breast cancer.Citation33 Others reported that MTA1 interacts with ESR1 and acts as a transcriptional repressor of ESR1.Citation23 Consistent with these results, MTA1 impairs the transcription of estrogen-regulated genes by interacting with MTA1-interacting protein coactivator, ITG3B3BP (integrin subunit beta 3 binding protein), and HSF1 (heat shock transcription factor 1).Citation34-36 This function of MTA1 was confirmed in this study because ESR1 expression was upregulated but expression of a target gene, CCND1, was decreased in the MCF7/TAMR sublines (Fig. S7A). Similarly, Elias et al. observed that estrogen-regulated pathways are drastically disrupted in the TAMR cell lines: 69.5% of estrogen-regulated genes are inversely expressed compared with the normal estrogen signaling pathway (Fig. S7B).Citation37 Thus, the MTA1-induced alteration of the estrogen-ESR1 signaling pathway could contribute, at least in part, to the tamoxifen resistance of the MCF7/TAMR cells. Recent evidence has also shown that estrogen signaling is involved in the process of autophagy: inhibition of ESR1 signaling stimulates autophagosome formation and flux, and estradiol blocks hypoxia-induced autophagy flux.Citation38,Citation39 Therefore, we speculate that the mechanism of MTA1-induced tamoxifen resistance may involve a complicated autophagy network that is potentially associated with estrogen signaling.
Here, we showed for the first time that expression of MTA1 was highly upregulated in breast cancer cells that are resistant to tamoxifen (A). Previously, it was reported that high expression of EGFR and ERBB2 is associated with a lack of response to tamoxifen in patients with ESR1-positive breast cancer, and overexpression of ERBB2 was suggested as an independent marker of resistance to first-line endocrine therapy in patients with advanced breast cancer.Citation40,Citation41 In addition, the NRG1/heregulin-β1-induced ERBB2 signaling pathway was reported to induce expression of MTA1 in breast cancer cells.Citation23 Thus, the increased MTA1 expression in tamoxifen-resistant breast cancer is probably the result of enhanced EGFR and/or ERBB2 signaling pathways. Indeed, we observed that blocking these signaling pathways with the MAPK inhibitor PD98059, or the PI3K inhibitor LY294002, reduced the MTA1 levels in MCF7/TAMR cells (Fig. S8). In analysis of clinical data, the expression level of MTA1 in ESR1-positive breast cancers in 3 cohorts of tamoxifen-treated patients showed that a high level of expression of MTA1 correlated with recurrence or relapse (A). Similarly, Gururaj and his colleagues observed that the MTA1 target gene BCAS3 is overexpressed in premenopausal ESR/ERα-positive breast cancer and that the level of expression is associated with an impaired response to tamoxifen.Citation25 Based on these findings, we suggest that the expression level of MTA1 may provide a novel biomarker for tamoxifen resistance and also serve as a potential therapeutic target for ESR1-positive breast cancer patients.
Currently, a clinical trial of HCQ in combination with hormonal therapy is underway for treatment of ESR1-positive breast cancer patients (ClinicalTrials.gov identifier: NCT02414776). The rationale for this strategy seems to be persuasive because previous studies demonstrated that knockdown of autophagy genes or treatment with autophagy inhibitors restored sensitivity to tamoxifen in breast cancer cells in culture or in tumor-bearing mice.Citation12-16 We also demonstrated that inhibition of autophagy by knockdown of ATG7 or treatment with HCQ restored tamoxifen sensitivity in MCF7/TAMR and in MTA1-overexpressing MCF7 cells ( and ). Recently, combinations of tamoxifen with the EGFR tyrosine kinase inhibitor gefitinib or with the histone deacetylase inhibitor vorinostat have been evaluated for therapeutic efficacy in endocrine resistant breast cancer patients. In the case of gefitinib, progression‐free survival was improved in newly diagnosed metastatic breast cancer or in those who had received adjuvant tamoxifen.Citation42 In a phase II clinical trial of vorinostat, combination treatment resulted in a 19% response rate with reversal of tamoxifen resistance in some patients.Citation43 However, despite the demonstration of some positive effects in these combination trials, concern is increasing because gefitinib and vorinostat frequently induce autophagy.Citation44,Citation45 Therefore, autophagy inhibitors could provide a potent intervention not only to sensitize breast cancer cells to gefitinib- or vorinostat-induced cell death but also to block the development of resistance to tamoxifen. In conclusion, inhibition of MTA1-mediated autophagy may provide a better therapeutic index for sensitizing breast cancers to tamoxifen-based endocrine therapies.
Materials and methods
Cell lines and reagents
Human breast cancer cell line MCF7 was obtained from the American Type Culture Collection (HTB-22). MCF7 cells were maintained under 5% CO2 at 37°C in Dulbecco's modified Eagle's medium containing 10% fetal bovine serum (FBS; Hyclone, SH3008403). The tamoxifen resistant and parent MCF7 sublines (MCF7/TAMR-1 [152089], MCF7/TMAR-8 [152089] and MCF7/S0.5 [152090]) and tamoxifen resistant and parent T47D sublines (T47D/TR-1 [152108], T47D/TR-2 [152110], and T47D/S2 [152109]) were obtained from Ximbio. Cells for all experiments were used within 10 passages to reduce variability between experimental results. The MCF7/S0.5 cells were maintained in phenol red-free Dulbecco's modified Eagle's medium:F12 (1:1) containing 1% FBS, 2 mM Glutamaxۛ (Gibco-Invitrogen, 35050–061), and 6 ng/ml human insulin (Sigma-Aldrich, 19278). The T47D/S2 cells were maintained in phenol red-free RPMI-1640 (WelGENE, LM011-02) containing 2% FBS, 2 mM Glutamaxۛ, and 8 μg/ml human insulin. To maintain the tamoxifen resistant sublines, 1 μM 4OHT was added to the medium. The number of viable cells was counted with a hemocytometer using trypan blue exclusion. 4OHT, bafilomycin A1 and HCQ were obtained from Tocris Bioscience (3412), Cayman Chemical (11038), and Acros Organics (AC263010250), respectively.
Plasmids, siRNA duplexes, and transient transfection
The eukaryotic expression vector p3XFLAG10-MTA1 was described previously.Citation33 The siRNA duplexes targeting MTA1 (5′-AAGACCCUGCUGGCAGAUAAA-3′), ATG7 (5′-GGAGUCACAGCUCUUCCUU-3′), PRKAA (5′-CAAAGUCGACCAAAUGAUA-3′), UQCRC2 (GAGUUUACCAAGUUACCAA) and nonspecific green fluorescent protein (GFP) were synthesized and purified by ST Pharm Co. (Seoul, Korea). Transient transfection and reporter gene analysis were performed as described previously.Citation33
Western blot analysis and reverse transcription–quantitative PCR (RT-qPCR)
Western blotting were carried out as described previously using specific antibodies against MTA1 (Santa Cruz Biotechnology, sc-9445), LC3 (Sigma-Aldrich, L8918), p-PRKAA/pAMPKα (T172; Cell Signaling Technology, 2535S), PRKAA/AMPKα (Cell Signaling Technology, 2532S), ATG7 (Cell Signaling Technology, 2631S), anti-RT/Ms Total Oxidative phosphorylation (OXPHOS) complex kit (Novex, 458099), NBR1 (Cell Signaling Technology, 9891S), RPS6KB1/p70S6K (Cell Signaling Technology, 9202S), p-RPS6KB1/p-p70S6K (Cell Signaling Technology, 9234S) or TUBA/α-tubulin (Millipore, CP06).Citation33 RT-qPCR was carried out using specific primers as described previously.Citation33 The primer sequences are listed in Table S1.
Confocal microscopy and transmission electron microscopy
To visualize LC3 puncta, cells were infected with adenovirus expressing EGFP-LC3 or mCherry-GFP-LC3 (multiplicity of infection = 50). Cells were then treated with a vehicle, 4OHT for 24 h or bafilomycin A1 for 2 h and examined by confocal microscopy (Cal Zeiss, Zeiss LSM510 Meta). For transmission electron microscopy, cells were fixed overnight in 2.5% glutaraldehyde at 4°C and washed in 0.05 M sodium cacodylate (Electron Microscopy Sciences, 11652) buffer. Afterwards, cells were postfixed in 1% osmium tetroxide for 2 h at 4°C, dehydrated in graded ethanol, and embedded in Spurr's resin (Electron Microscopy Sciences, 14300). The ultrathin sections were collected on copper grids, stained with uranyl acetate and lead citrate, and examined with an electron microscope (JEOL, JEM-1010).
Establishment of stable cell lines expressing MTA1 and xenograft experiments
pLJM1-MTA1 was cloned from FLAG-MTA1 by PCR amplification and subsequent insertion into SacI (New England Biolabs, R156S) and NheI (New England Biolabs, R0131S) sites of the pLJM1-MCS vector, a modified pLJM1-GFP vector containing a multiple cloning site (Addgene, 19319; deposited by David Sabatini). Production of the virus, transduction into MCF7 cells, and selection of stable clones were performed as described previously.Citation33
The xenograft experiments were performed in accordance with the guidelines of the Seoul National University Animal Care and Use Committee. Female 5-wk-old athymic (nu/nu) BALB/c mice were obtained from Japan SLC Inc. (Hamamatsu, Japan) and housed in an air-conditioned room at a temperature of 22°C to 24°C and a humidity of 37% to 64%, with a 12-h light/dark cycle. After 5 d of acclimatization, the mice were implanted with a 0.72 mg, 90-d release 17β-estradiol pellet (Innovative Research of America, NE-121) and then injected in flanks with 2.5 × 10⁶ MCF-7 cells mixed 1:1 with Matrigel (BD Biosciences, 354234). When the tumor volume reached approximately 80 to 100 mm3, mice were separated randomly into 2 groups and implanted with a 5 mg, 60-d release tamoxifen pellet (Innovative Research of America, SE-361) or a placebo pellet (Innovative Research of America, SE-111). Tumor diameter was measured with caliper 2 times a wk, and tumor volumes were estimated using the following formula: tumor volume (cm3) = (length × widthCitation2) × 0.5.
Measurement of AMP:ATP ratio by high performance liquid chromatography (HPLC)
The amounts of AMP and ATP were quantified using an HPLC method essentially as described previously.Citation46 Briefly, 2 × 10⁶ cells were plated in 100-mmCitation2 dishes and treated with 4OHT for 24 h. Cells were harvested in 0.2 N perchloric acid and neutralized with KOH. Nucleotides in cell lysates were analyzed by Thermo Ultimate 3000 HPLC (Thermo Scientific, Wilmington, DE, USA) using an Inno C18 column (Innopia, 05AL 02015).
Assessment of oxygen consumption rate
The oxygen consumption rate was analyzed using the Seahorse XFp Extracellular Flux Analyzer (Seahorse Bioscience, Billerica, MA, USA) using the Seahorse XFp Cell Mito Stress Test Kit (Seahorse Bioscience, 103010–100) according to the manufacturer's instructions. MTA1-overexpressing MCF7 cells and the control cells were plated in assay plates at 2 × 10⁴ cells/wells with minimal DMEM (XF base medium; Seahorse Bioscience, 103193-100) supplemented with 1 mM pyruvate, 1 mM L-glutamine, and 4.5 ug/ml D-glucose. In the case of assessment of the OCR of MCF7 transfected with either siGFP or siMTA1, MCF7 cells were plated in DMEM with 10% FBS 24 h prior to transfection. After 48 h, cells were plated in assay plates at 2 × 10⁴ cells/well. The OCR was analyzed using the Seahorse XFp Extracellular Flux Analyzer (Seahorse Bioscience, Billerica, MA, USA) using the Seahorse XFp Cell Mito Stress Test Kit (Seahorse Bioscience, 103010–100) according to the manufacturer's instructions. Oligomycin (1 μM), carbonyl cyanide-4-(trifluoromethoxy)phenylhydrazone (FCCP, an inducer of uncoupled respiration; 0.5 μM) and antimycin A and rotenone (2 μM) were added to cell cultures to determine the basal and maximal respiration. The basal OCR was calculated by the OCR baseline levels before FCCP injection minus the average of 3 OCR levels after antimycin A and rotenone injection (nonmitochondrial respiration). Uncoupled OCR was produced by subtracting nonmitochondrial respiration from the OCR levels after FCCP injection
Chromatin immunoprecipitation-sequencing (ChIP-seq) data analysis
MTA1 ChIP-seq data and their matched input (ENCSR348JOJ) were downloaded from Encyclopedia of DNA Elements (ENCODE; https://www.encodeproject.org/). Enriched regions of the genome were identified by comparing the ChIP samples to the input sample using the default parameters of MACS peak caller version 1.4.2.Citation47 Peaks that were enriched > 2-fold over an input control with a q-value of < 0.05 were selected; 1,533 peaks were called in the MTA1 ChIP-seq dataset. Genome-wide distributions were generated using Integrative Genomics Viewer (Broad Institute, Cambridge, MA, USA).Citation48 The overrepresented Gene Ontology (GO) was analyzed with ToppGene Suite.Citation49
Breast cancer patient cohort analysis based on public datasets
Three publicly available datasets (GSE9893, GSE1378, and GSE12093) containing information from patients with ESR-positive breast cancer treated with tamoxifen were downloaded from Gene Expression Omnibus (GEO; http://www.ncbi.nlm.nih.gov/geo/). The GSE9893 dataset (MLRG Human 21K V12.0; Montpellier Génopole Microarray core facility) contains the gene expression profiles of 147 patients treated with a tamoxifen for 5 y after surgery.Citation29 The GSE1378 dataset (Arcturus 22k human oligonucleotide microarray; AviaraDx, Inc.) contains the gene expression profiles of 59 patients with ESR-positive breast cancer treated with standard breast surgery and radiation followed by 5 y of adjuvant tamoxifen.Citation30 The GSE12093 dataset (Arcturus 22k human oligonucleotide microarray; AviaraDx, Inc.) contains the gene expression profiles of 136 patients with ESR-positive tumors treated with adjuvant tamoxifen.Citation31 Data that lacked expression signals in the microarrays or were without recorded clinical information were excluded from all analyses. The processed data including normalization procedures were obtained from the corresponding websites, and no additional transformations were performed.
Statistical analyses
Statistical analyses were performed using GraphPad Prism software (Graphpad Software, San Diego, CA, USA). Experimental values were expressed as the mean ± standard error based on 3 independent experiments, unless indicated otherwise. Statistically significant differences between 2 groups were determined using a 2-tailed, unpaired t test. Statistical analyses of multiple groups were performed using 2-way analysis of variance followed by the Bonferroni post test. P < 0.05 was considered to be significant. Cell counting results and immunoblots were taken from a representative experiment, which was qualitatively similar to at least 3 other experiments.
Disclosure of potential conflicts of interest
The authors declare no potential conflicts of interest.
Additional information
Funding
Related Research Data
References
- Torre LA, Bray F, Siegel RL, Ferlay J, Lortet-Tieulent J, Jemal A. Global cancer statistics, 2012. CA Cancer J Clin. 2015;65:87–108. doi:10.3322/caac.21262. PMID:25651787
- Yeo B, Turner NC, Jones A. An update on the medical management of breast cancer. BMJ. 2014;348:g3608. doi:10.1136/bmj.g3608. PMID:24912480
- Jordan VC. Tamoxifen: a most unlikely pioneering medicine. Nat Rev Drug Discov. 2003;2:205–13. doi:10.1038/nrd1031. PMID:12612646
- Cole MP, Jones CT, Todd ID. A new anti-oestrogenic agent in late breast cancer. An early clinical appraisal of ICI46474. Br J Cancer. 1971;25:270–75. doi:10.1038/bjc.1971.33. PMID:5115829
- Early Breast Cancer Trialists' Collaborative Group (EBCTCG), Davies C, Godwin J, Gray R, Clarke M, Cutter D, Darby S, McGale P, Pan HC, Taylor C, et al. Relevance of breast cancer hormone receptors and other factors to the efficacy of adjuvant tamoxifen: patient-level meta-analysis of randomised trials. Lancet. 2011;378:771–84. doi:10.1016/S0140-6736(11)60993-8. PMID:21802721
- Nass N, Kalinski T. Tamoxifen resistance: from cell culture experiments towards novel biomarkers. Pathol Res Pract. 2015;211:189–97. doi:10.1016/j.prp.2015.01.004. PMID:25666016
- Dixon J.M. Endocrine resistance in Breast cancer. N J Sci. 2014;2014:1–27. doi:org/10.1155/2014/390618.
- Sharma D, Blum J, Yang X, Beaulieu N, Macleod AR, Davidson NE. Release of methyl CpG binding proteins and histone deacetylase 1 from the Estrogen receptor alpha (ER) promoter upon reactivation in ER-negative human breast cancer cells. Mol Endocrinol. 2005;19:1740–51. doi:10.1210/me.2004-0011. PMID:15746193
- Jeselsohn R, Buchwalter G, De Angelis C, Brown M, Schiff R. ESR1 mutations—a mechanism for acquired endocrine resistance in breast cancer. Nat Rev Clin Oncol. 2015;12:573–83. doi:10.1038/nrclinonc.2015.117. PMID:26122181
- Cui J, Yang Y, Li H, Leng Y, Qian K, Huang Q, Zhang C, Lu Z, Chen J, Sun T, et al. MiR-873 regulates ERα transcriptional activity and tamoxifen resistance via targeting CDK3 in breast cancer cells. Oncogene. 2015;34:3895–907. doi:10.1038/onc.2014.430. PMID:25531331
- Klionsky DJ, Abdelmohsen K, Abe A, Abedin MJ, Abeliovich H, Acevedo Arozena A, Adachi H, Adams CM, Adams PD, Adeli K et al. Guidelines for the use and interpretation of assays for monitoring autophagy (3rd edition). Autophagy. 2016;12:1–222. doi:10.1080/15548627.2015.1100356. PMID:26799652
- Samaddar JS, Gaddy VT, Duplantier J, Thandavan SP, Shah M, Smith MJ, Browning D, Rawson J, Smith SB, Barrett JT, et al. A role for macroautophagy in protection against 4-hydroxytamoxifen-induced cell death and the development of antiestrogen resistance. Mol Cancer Ther. 2008;7:2977–87. doi:10.1158/1535-7163.MCT-08-0447. PMID:18790778
- Cook KL, Shajahan AN, Wärri A, Jin L, Hilakivi-Clarke LA, Clarke R. Glucose-regulated protein 78 controls cross-talk between apoptosis and autophagy to determine antiestrogen responsiveness. Cancer Res. 2012;72:3337–49. doi:10.1158/0008-5472.CAN-12-0269. PMID:22752300
- Nagelkerke A, Sieuwerts AM, Bussink J, Sweep FC, Look MP, Foekens JA, Martens JW, Span PN. LAMP3 is involved in tamoxifen resistance in breast cancer cells through the modulation of autophagy. Endocr Relat Cancer. 2014;21:101–12. doi:10.1530/ERC-13-0183. PMID:24434718
- Qadir MA, Kwok B, Dragowska WH, To KH, Le D, Bally MB, Gorski SM. Macroautophagy inhibition sensitizes tamoxifen-resistant breast cancer cells and enhances mitochondrial depolarization. Breast Cancer Res Treat. 2008;112:389–403. doi:10.1007/s10549-007-9873-4. PMID:18172760
- Cook KL, Wärri A, Soto-Pantoja DR, Clarke PA, Cruz MI, Zwart A, Clarke R. Chloroquine inhibits autophagy to potentiate antiestrogen responsiveness in ER+ breast cancer. Clin Cancer Res. 2014;20:3222–32. doi:10.1158/1078-0432.CCR-13-3227. PMID:24928945
- Toh Y, Nicolson GL. Properties and clinical relevance of MTA1 protein in human cancer. Cancer Metastasis Rev. 2014;33:891–900. doi:10.1007/s10555-014-9516-2. PMID:25359582
- Sen N, Gui B, Kumar R. Role of MTA1 in cancer progression and metastasis. Cancer Metastasis Rev. 2014;33:879–89. doi:10.1007/s10555-014-9515-3. PMID:25344802
- Martin MD, Fischbach K, Osborne CK, Mohsin SK, Allred DC, O'Connell P. Loss of heterozygosity events impeding breast cancer metastasis contain the MTA1 gene. Cancer Res. 2001;61:3578–80. PMID:11325822
- Jang KS, Paik SS, Chung H, Oh YH, Kong G. MTA1 overexpression correlates significantly with tumor grade and angiogenesis in human breast cancers. Cancer Sci. 2006;97:374–79. doi:10.1111/j.1349-7006.2006.00186.x. PMID:16630134
- Martin MD, Hilsenbeck SG, Mohsin SK, Hopp TA, Clark GM, Osborne CK, Allred DC, O'Connell P. Breast tumors that overexpress nuclear metastasis-associated 1 (MTA1) protein have high recurrence risks but enhanced responses to systemic therapies. Breast Cancer Res Treat. 2006;95:7–12. doi:10.1007/s10549-005-9016-8. PMID:16244788
- Cheng CW, Liu YF, Yu JC, Wang HW, Ding SL, Hsiung CN, Hsu HM, Shieh JC, Wu PE, Shen CY. Prognostic significance of cyclin D1, β-catenin, and MTA1 in patients with invasive ductal carcinoma of the breast. Ann Surg Oncol. 2012;19:4129–39. doi:10.1245/s10434-012-2541-x. PMID:22864797
- Mazumdar A, Wang RA, Mishra SK, Adam L, Bagheri-Yarmand R, Mandal M, Vadlamudi RK, Kumar R. Transcriptional repression of oestrogen receptor by metastasis-associated protein 1 corepressor. Nat Cell Biol. 2001;3:30–7. doi:10.1038/35050532. PMID:11146623
- Singh RR, Barnes CJ, Talukder AH, Fuqua SA, Kumar R. Negative regulation of estrogen receptor alpha transactivation functions by LIM domain only 4 protein. Cancer Res. 2005;65:10594–601. doi:10.1158/0008-5472.CAN-05-2268. PMID:16288053
- Gururaj AE, Holm C, Landberg G, Kumar R. Breast cancer-amplified sequence 3, a target of metastasis-associated protein 1, contributes to tamoxifen resistance in premenopausal patients with breast cancer. Cell Cycle. 2006;5:1407–10. doi:10.4161/cc.5.13.2924. PMID:16855396
- Briand P, Lykkesfeldt AE. Effect of estrogen and antiestrogen on the human breast cancer cell line MCF-7 adapted to growth at low serum concentration. Cancer Res. 1984;44:1114–19. PMID:6362856
- Thrane S, Pedersen AM, Thomsen MB, Kirkegaard T, Rasmussen BB, Duun-Henriksen AK, Lænkholm AV, Bak M, Lykkesfeldt AE, Yde CW. A kinase inhibitor screen identifies Mcl-1 and Aurora kinase A as novel treatment targets in antiestrogen-resistant breast cancer cells. Oncogene. 2015;34:4199–210. doi:10.1038/onc.2014.351. PMID:25362855
- Marin TL, Gongol B, Martin M, King SJ, Smith L, Johnson DA, et al. Identification of AMP-activated protein kinase targets by a consensus sequence search of the proteome. BMC Syst Biol. 2015;9:13. doi:10.1186/s12918-015-0156-0. PMID:25890336
- Chanrion M, Negre V, Fontaine H, Salvetat N, Bibeau F, Mac Grogan G, Mauriac L, Katsaros D, Molina F, Theillet C, et al. A gene expression signature that can predict the recurrence of tamoxifen-treated primary breast cancer. Clin Cancer Res. 2008;14:1744–52. doi:10.1158/1078-0432.CCR-07-1833. PMID:18347175
- Ma XJ, Wang Z, Ryan PD, Isakoff SJ, Barmettler A, Fuller A, Muir B, Mohapatra G, Salunga R, Tuggle JT, Tran Y, et al. A two-gene expression ratio predicts clinical outcome in breast cancer patients treated with tamoxifen. Cancer Cell. 2004;5:607–16. doi:10.1016/j.ccr.2004.05.015. PMID:15193263
- Zhang Y, Sieuwerts AM, McGreevy M, Casey G, Cufer T, Paradiso A, Harbeck N, Span PN, Hicks DG, Crowe J, et al. The 76-gene signature defines high-risk patients that benefit from adjuvant tamoxifen therapy. Breast Cancer Res Treat. 2009;116:303–09. doi:10.1007/s10549-008-0183-2. PMID:18821012
- Daurio NA, Tuttle SW, Worth AJ, Song EY, Davis JM, Snyder NW, Blair IA, Koumenis C. AMPK Activation and Metabolic Reprogramming by Tamoxifen through Estrogen Receptor-Independent Mechanisms Suggests New Uses for This Therapeutic Modality in Cancer Treatment. Cancer Res. 2016;76:3295–306. doi:10.1158/0008-5472.CAN-15-2197. PMID:27020861
- Kang HJ, Lee MH, Kang HL, Kim SH, Ahn JR, Na H, Na TY, Kim YN, Seong JK, Lee MO. Differential regulation of estrogen receptor α expression in breast cancer cells by metastasis-associated protein 1. Cancer Res. 2014;74:1484–94. doi:10.1158/0008-5472.CAN-13-2020. PMID:24413532
- Mishra SK, Mazumdar A, Vadlamudi RK, Li F, Wang RA, Yu W, Jordan VC, Santen RJ, Kumar R. MICoA, a novel metastasis-associated protein 1 (MTA1) interacting protein coactivator, regulates estrogen receptor-alpha transactivation functions. J Biol Chem. 2003;278:19209–19. doi:10.1074/jbc.M301968200. PMID:12639951
- Talukder AH, Gururaj A, Mishra SK, Vadlamudi RK, Kumar R. Metastasis-associated protein 1 interacts with NRIF3, an estrogen-inducible nuclear receptor coregulator. Mol Cell Biol. 2004;24:6581–91. doi:10.1128/MCB.24.15.6581-6591.2004. PMID:15254226
- Khaleque MA, Bharti A, Gong J, Gray PJ, Sachdev V, Ciocca DR, Stati A, Fanelli M, Calderwood SK. Heat shock factor 1 represses estrogen-dependent transcription through association with MTA1. Oncogene. 2008;27:1886–93. doi:10.1038/sj.onc.1210834. PMID:17922035
- Elias D, Vever H, Lænkholm AV, Gjerstorff MF, Yde CW, Lykkesfeldt AE, Ditzel HJ. Gene expression profiling identifies FYN as an important molecule in tamoxifen resistance and a predictor of early recurrence in patients treated with endocrine therapy. Oncogene. 2015;34:1919–27. doi:10.1038/onc.2014.138. PMID:24882577
- Cook KL, Clarke PA, Parmar J, Hu R, Schwartz-Roberts JL, Abu-Asab M, Wärri A, Baumann WT, Clarke R. Knockdown of estrogen receptor-α induces autophagy and inhibits antiestrogen-mediated unfolded protein response activation, promoting ROS-induced breast cancer cell death. FASEB J. 2014;28:3891–905. doi:10.1096/fj.13-247353. PMID:24858277
- Hsieh DJ, Kuo WW, Lai YP, Shibu MA, Shen CY, Pai P, Yeh YL, Lin JY, Viswanadha VP, Huang CY. 17β-Estradiol and/or Estrogen Receptor β Attenuate the Autophagic and Apoptotic Effects Induced by Prolonged Hypoxia Through HIF-1α-Mediated BNIP3 and IGFBP-3 Signaling Blockage. Cell Physiol Biochem. 2015;36:274–84. doi:10.1159/000374070. PMID:25967966
- Newby JC, Johnston SR, Smith IE, Dowsett M. Expression of epidermal growth factor receptor and c-erbB2 during the development of tamoxifen resistance in human breast cancer. Clin Cancer Res. 1997;3:1643–51. PMID:9815855
- Houston SJ, Plunkett TA, Barnes DM, Smith P, Rubens RD, Miles DW. Overexpression of c-erbB2 is an independent marker of resistance to endocrine therapy in advanced breast cancer. Br J Cancer. 1999;79:1220–26. doi:10.1038/sj.bjc.6690196. PMID:10098763
- Osborne CK, Neven P, Dirix LY, Mackey JR, Robert J, Underhill C, Schiff R, Gutierrez C, Migliaccio I, Anagnostou VK, et al. Gefitinib or placebo in combination with tamoxifen in patients with hormone receptor-positive metastatic breast cancer: a randomized phase II study. Clin Cancer Res. 2011;17:1147–59. doi:10.1158/1078-0432.CCR-10-1869. PMID:21220480
- Munster PN, Thurn KT, Thomas S, Raha P, Lacevic M, Miller A, Melisko M, Ismail-Khan R, Rugo H, Moasser M, et al. A phase II study of the histone deacetylase inhibitor vorinostat combined with tamoxifen for the treatment of patients with hormone therapy-resistant breast cancer. Br J Cancer. 2011;104:1828–35. doi:10.1038/bjc.2011.156. PMID:21559012
- Gammoh N, Lam D, Puente C, Ganley I, Marks PA, Jiang X. Role of autophagy in histone deacetylase inhibitor-induced apoptotic and nonapoptotic cell death. Proc Natl Acad Sci U S A. 2012;109:6561–65. doi:10.1073/pnas.1204429109. PMID:22493260
- Dragowska WH, Weppler SA, Wang JC, Wong LY, Kapanen AI, Rawji JS, Warburton C, Qadir MA, Donohue E, et al. Induction of autophagy is an early response to gefitinib and a potential therapeutic target in breast cancer. PLoS One. 2013;8:e76503. doi:10.1371/journal.pone.0076503. PMID:24146879
- Stocchi V, Cucchiarini L, Magnani M, Chiarantini L, Palma P, Crescentini G. Simultaneous extraction and reverse-phase high-performance liquid chromatographic determination of adenine and pyridine nucleotides in human red blood cells. Anal Biochem. 1985;146:118–24. doi:10.1016/0003-2697(85)90405-1. PMID:3993925
- Zhang Y, Liu T, Meyer CA, Eeckhoute J, Johnson DS, Bernstein BE, Nusbaum C, Myers RM, Brown M, Li W, et al. Model-based analysis of ChIP-Seq (MACS). Genome Biol. 2008;9:R137. doi:10.1186/gb-2008-9-9-r137. PMID:18798982
- Robinson JT, Thorvaldsdóttir H, Winckler W, Guttman M, Lander ES, Getz G, Mesirov JP. Integrative genomics viewer. Nat Biotechnol. 2011;29:24–6. doi:10.1038/nbt.1754. PMID:21221095
- Chen J, Bardes EE, Aronow BJ, Jegga AG. ToppGene Suite for gene list enrichment analysis and candidate gene prioritization. Nucleic Acids Res. 2009;37:W305–11. doi:10.1093/nar/gkp427. PMID:19465376