
ABSTRACT
Parkinson disease (PD) is the second most common neurodegenerative disorder after Alzheimer disease and is caused by genetics, environmental factors and aging, with few treatments currently available. Apoptosis and macroautophagy/autophagy play critical roles in PD pathogenesis; as such, modulating their balance is a potential treatment strategy. BCL2 (B cell leukemia/lymphoma 2) is a key molecule regulating this balance. Piperlongumine (PLG) is an alkaloid extracted from Piper longum L. that has antiinflammatory and anticancer effects. The present study investigated the protective effects of PLG in rotenone-induced PD cell and mouse models. We found that PLG administration (2 and 4 mg/kg) for 4 wk attenuated motor deficits in mice and prevented the loss of dopaminergic neurons in the substantia nigra induced by oral administration of rotenone (10 mg/kg) for 6 wk. PLG improved cell viability and enhanced mitochondrial function in primary neurons and SK-N-SH cells. These protective effects were exerted via inhibition of apoptosis and induction of autophagy through enhancement of BCL2 phosphorylation at Ser70. These results demonstrate that PLG exerts therapeutic effects in a rotenone-induced PD models by restoring the balance between apoptosis and autophagy.
Abbreviations: 6-OHDA, 6-hydroxydopamine; ACTB, actin, beta; BafA1, bafilomycin A1; BAK1, BCL2-antagonist/killer 1; BAX, BCL2-associated X protein; BCL2, B cell leukemia/lymphoma2; BECN1, Beclin 1, autophagy related; CoQ10, coenzyme Q10; COX4I1/COX IV, cytochrome c oxidase subunit 4I1; CsA, cyclosporine A; ED50, 50% effective dose; FITC, fluorescein isothiocyanate; GFP, green fluorescent protein; HPLC, high-performance liquid chromatography; JC-1, tetraethylbenz-imidazolylcarbocyanine iodide; LC3, microtubule-associated protein 1 light chain3; LC-MS/MS, liquid chromatography-tandem mass spectrometry; LDH, lactate dehydrogenase; l-dopa, 3, 4-dihydroxyphenyl-l-alanine; MAPK8/JNK1, mitogen-activated protein kinase 8; MMP, mitochondrial membrane potential; mPTP, mitochondrial permeability transition pore; mRFP, monomeric red fluorescent protein; MPTP, 1-methyl-4-phenyl-1,2,3,6-tetrahydropyridine; MTT, 3-(4,5-dimethylthiazol-2-yl)-2,5-diphenyltetrazolium bromide; NFE2L2/NRF2, nuclear factor, erythroid derived 2, like 2; PD, Parkinson disease; PLG, piperlongumine; pNA, p-nitroanilide; PI, propidium iodide; PtdIns3K, phosphatidylinositol 3-kinase; PtdIns3P, phosphatidylinositol-3-phosphate; PTX, paclitaxel; Rap, rapamycin; SQSTM1/p62, sequestosome 1; TH, tyrosine hydroxylase; TUNEL, terminal deoxynucleotidyl transferase dUTP nick end labeling; WIPI2, WD repeat domain, phosphoinositide interacting 2; ZFYVE1/DFCP1, zinc finger, FYVE domain containing 1.
Introduction
Parkinson disease (PD) is a neurodegenerative disorder characterized by motor and nonmotor symptoms. Typical pathological characteristics of PD include a progressive loss of dopaminergic neurons in the substantia nigra pars compacta, and deposition of intraneuronal inclusions known as Lewy bodies.Citation1 Although the pathogenesis of PD has not been fully elucidated, various key intracellular processes are involved, including aggregation of misfolded protein, endoplasmic reticulum stress, mitochondrial dysfunction, calcium overload, and an imbalance between autophagy and apoptosis.Citation2
Mitochondrial dysfunction has been implicated in the pathophysiology of PD.Citation3 Apoptosis—the most common form of programmed cell death—is closely related to mitochondrial function, because the intrinsic apoptosis pathway is linked to mitochondrial depolarization.Citation4 Autophagy removes damaged mitochondria to prevent apoptosis caused by mitochondrial dysfunction.Citation5–7 However, various studies have reported that the autophagy-lysosome system is impaired in postmortem PD patient tissue and PD models.Citation8,Citation9 Under normal conditions, a balance exists between apoptosis and autophagy that maintains intracellular homeostasis; this balance is perturbed in neurodegenerative disorders such as PD.Citation10,Citation11 Therefore, therapeutic strategies that modulate apoptosis and/or autophagy may be effective for PD treatment.
BCL2 (B cell leukemia/lymphoma 2) family proteins regulate the intrinsic apoptosis pathway by controlling mitochondrial outer membrane permeability.Citation12 The anti-apoptotic protein BCL2 can bind to the pro-apoptotic protein BAX (BCL2-associated X protein) or BAK1 (BCL2-antagonist/killer 1) to form heterodimers that modulate apoptosis.Citation13,Citation14 BCL2 phosphorylation at Ser70 enhances binding to BAX and BAD (BCL2-associated death promoter) and is essential for its anti-apoptotic activity.Citation15,Citation16 Conversely, BCL2 also regulates autophagy via interaction with BECN1/Beclin 1; moreover, BCL2 phosphorylation—including at Ser70—leads to its dissociation from BECN1 and induction of autophagy.Citation17 These findings suggest that BCL2 regulates the balance between apoptosis and autophagy.
Piperlongumine (PLG) is an alkaloid isolated from the long pepper Piper longum L. that has antiinflammatory and anticancer effects.Citation18,Citation19 In previous studies, we found that Piper longum L. alkaloids had neuroprotective effects in models of PD induced by the neurotoxins 1-methyl-4-phenyl-1,2,3,6-tetrahydropyridine (MPTP), rotenone, and 6-hydroxydopamine (6-OHDA) models.Citation20–22 However, it is unknown whether PLG alone has similar effects against rotenone-induced PD.
To address this issue, the present study investigated the therapeutic effects of PLG in cell and mouse models of rotenone-induced PD. We found that PLG improved cell viability and attenuated motor deficits in mice. These effects were associated with restoration of the balance between apoptosis and autophagy via increased phosphorylation of BCL2 at Ser70. Our findings suggest that PLG can be used as a therapeutic agent in the treatment of PD.
Results
PLG rapidly crosses the blood-brain barrier and is distributed throughout the brain
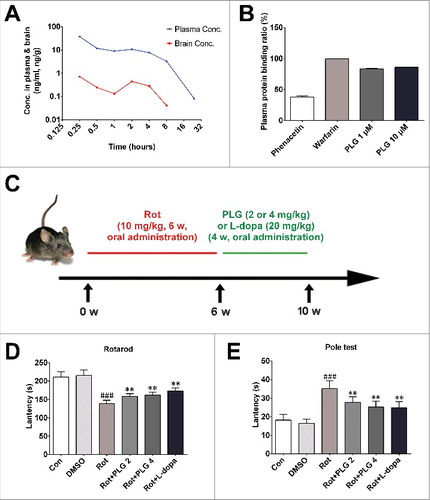
C57BL mice were orally administered PLG (4 mg/kg) and sacrificed after 15 min, 30 min, or 1, 2, 4, 8, or 24 h. Brain tissue and blood samples were collected to investigate whether PLG crosses the blood-brain barrier. Brain and plasma PLG concentrations were measured by using liquid chromatography-tandem mass spectrometry (LC-MS/MS). PLG was rapidly distributed throughout the brain, reaching a maximum level within 15 min. Interestingly, the concentration of PLG in both brain tissue and plasma increased again at 2 and 4 h, possibly due to enterohepatic circulation (A). To further investigate concentrations of unbound PLG in the blood, plasma protein binding ratio was determined by equilibrium dialysis. PLG concentrations were 1 and 10 μM; phaenacetin (1 μM) and warfarin (1 μM)—which have low and high binding rates, respectively—served as controls. The plasma protein binding ratio at 1 and 10 μM PLG were 83.5%± 0.83% and 85.9%± 0.49%, respectively (B). These findings suggest that PLG rapidly crosses the blood-brain barrier and is distributed throughout the brain tissue.
Figure 1. PLG is distributed in mouse brain and reverses motor deficits induced by rotenone. (A) C57BL male mice (3 mo old) were orally administered PLG (4 mg/kg) and sacrificed at 15 min, 30 min, or 1, 2, 4, 8, or 24 h. PLG levels in brain tissue and blood samples were determined by LC-MS/MS. (B) Plasma protein binding ratio was measured by equilibrium dialysis. PLG concentrations were 1 and 10 μM; phaenacetin (1 μM) and warfarin (1 μM) were used as controls.(C) Male C57BL mice were orally treated with rotenone (10 mg/kg) for 6 wk followed by PLG (2 or 4 mg/kg) or l-dopa (20 mg/kg) for 4 wk. (D, E) Rotarod (D) and pole (E) tests were used to assess motor function. Data are expressed as the mean ± SD (one-way analysis of variance). ###P<0.001 vs. control (Con); **P<0.01 vs. rotenone (Rot) (n = 10).
PLG abrogates motor deficits and dopamine reduction in rotenone-induced PD
The protective effects of PLG on rotenone-induced PD were examined in C57BL mice that were orally administered rotenone (10 mg/kg) for 6 wk. After administration with rotenone, mice in the treatment groups received PLG (2 or 4 mg/kg) for 4 wk, and the positive control group received l-dopa (20 mg/kg)—which is converted into dopamine in the brainCitation23—for 4 wk (C). Motor behavior was evaluated with the rotarod and pole tests. In the former, mice in the rotenone group spent less time on the rod than controls, whereas PLG and l-dopa treatment prolonged their duration on the rod (D). Similarly, in the pole test, PLG and L-dopa shortened the time that rotenone-treated mice spent on the pole (E). These results indicate that PLG administration attenuates rotenone-induced motor deficits.
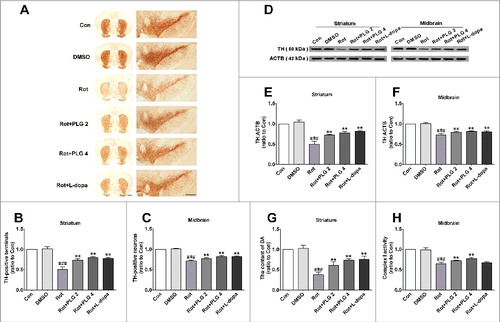
To investigate the effects of PLG on dopaminergic neurons, sections from the striatum and midbrain were examined for expression of TH (tyrosine hydroxylase)—an enzyme involved in dopamine production—by immunohistochemistry. We found that the number of TH-positive neurons in the midbrain and TH-positive fibers in the striatum were decreased by rotenone treatment. This was reversed by administration of 2 or 4 mg/kg PLG (A–C). A western blot analysis confirmed that PLG blocked the rotenone-induced decrease in TH level in both brain areas (D–F). Furthermore, while dopamine level was decreased in the striatum of the rotenone group as determined by high-performance liquid chromatography (HPLC), PLG treatment abrogated this effect (G). We also found that PLG exerted a protective effect on mitochondrial complex I, the activity of which was decreased by rotenone (H). These findings suggest that PLG abolishes rotenone-induced motor deficits by preventing the loss of TH-positive neurons and fibers as well as the decrease in dopamine level.
Figure 2. PLG restores TH expression in a mouse model of rotenone-induced PD. C57BL mice were treated with rotenone (10 mg/kg) for 6 wk followed by PLG (2 or 4 mg/kg) or l-dopa (20 mg/kg) for 4 wk. (A) TH (tyrosine hydroxylase) expression in the midbrain and striatum was assessed by immunohistochemistry. Scale bar: 500 μm. (B, C) Quantitative analysis of TH-positive neurons in the striatum (B) and midbrain (C). (D) TH expression in the midbrain and striatum was determined by western blotting. (E, F) Quantitative analysis of TH expression in the striatum (E) and midbrain (F). (G) Dopamine (DA) content in the striatum was assessed by HPLC. (H) Activity of mitochondrial complex I in the midbrain. Data are expressed as the mean ± SD (one-way analysis of variance). ###P<0.001 vs. control (Con); **P<0.01 vs. rotenone (Rot) (n = 5).
PLG improves cell viability by preventing rotenone-induced mitochondrial dysfunction
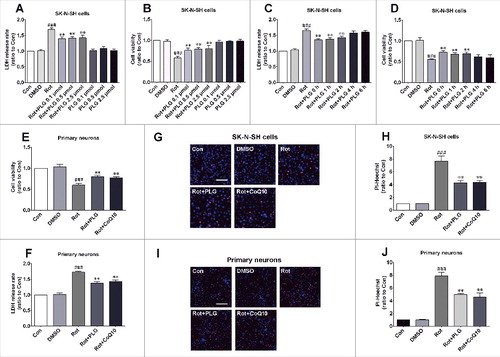
To investigate the mechanism underlying the protective effects of PLG, we evaluated cell viability and cytotoxicity with the 3-(4,5-dimethylthiazol-2-yl)-2,5-diphenyltetrazolium bromide (MTT) assay and LDH (lactate dehydrogenase) assays, respectively. We found that cell viability was reduced and cytotoxicity was enhanced in SK-N-SH cells by treatment with rotenone (100 nM) for 24 h; however, PLG (0.1–2.5 μM) partly abrogated these effects (A,B). We also examined the role of the time of PLG administration (0–6 h after rotenone treatment and cotreated cells for 24 h) in this effect and found that PLG induced the most potent changes when administered 0–2 h after rotenone, and was ineffectual when administered at 4–6 h (C,D). Based on these results, 0.1 μM PLG was administered 2 h after rotenone treatment in subsequent experiments. Under these conditions, cell injury induced by rotenone was reduced in primary neurons (E,F), whereas the rate of cell death was also suppressed relative to the rotenone-only group, as determined by propidium iodide (PI)-Hoechst staining (G–J).
Figure 3. PLG enhances cell viability and reduces cytotoxicity induced by rotenone. (A, B) SK-N-SH cells were cotreated with rotenone and PLG at concentrations of 0.1, 0.5, and 2.5 μM, and cell viability and cytotoxicity were evaluated with the MTT and LDH assays, respectively, to determine optical PLG concentration. Cells were also treated with PLG alone at 0.1, 0.5, and 2.5 μM and the side effects were evaluated. (C, D) SK-N-SH cells were treated with rotenone and PLG was added 0, 1, 2, 4, and 6 h later for 24 h; cell viability and cytotoxicity were evaluated with the MTT and LDH assays to determine optical PLG treatment time. (E, F) Cell viability and cytotoxicity were detected in primary neurons with the MTT (E) and LDH (F) assays. (G, I) Cell death in SK-N-SH cells (G) and primary neurons (I) was detected by PI (red) and Hoechst 33342 (blue) staining. CoQ10 (10 μM for 12 h), a component of the mitochondrial respiratory chain, served as a positive control. (H, J) Cell death rates were quantified in SK-N-SH cells (H) and primary neurons (J). Bar: 100 μm. Data are expressed as the mean ± SD (one-way analysis of variance). ###P<0.001 vs. control (Con); **P<0.01 vs. rotenone (Rot) (n = 3).
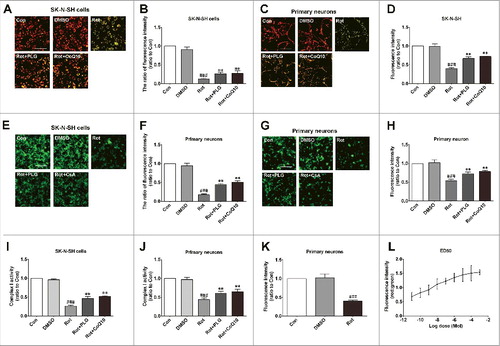
Because mitochondrial dysfunction—including the loss of mitochondrial membrane potential (MMP)—plays an important role in PD, we investigated whether PLG exerts protective effects on mitochondria. MMP was evaluated with the cationic dye 5,5′,6,6′-tetrachloro-1,1′,3,3′-tetraethylbenzimidazolylcarbocyanine iodide (JC-1). PLG reversed the rotenone-induced loss of MMP, which was similar to the effect of the positive control coenzyme Q10 (CoQ10; 10 μM for 12 h), which is an essential component of the mitochondrial respiratory chain (A–D).Citation24 Because mitochondrial permeability transition pore (mPTP) dysfunction is closely linked to loss of MMP, we assessed the opening of the mPTP with calcein-AM and CoCl2. PLG blocked mPTP opening, as did the positive control cyclosporine A (CsA; 100 nM for 24 h), an inhibitor of mPTP (E–H).Citation25 We also found that PLG preserved the activity of mitochondrial complex I in the presence of rotenone (I,J). Finally, we tested the 50% effective dose (ED50) of PLG in primary neurons based on the preservation of mitochondrial integrity, in order to investigate whether ED50 in vitro assays correlate with brain exprosure in mice. Primary neurons were treated with rotenone, and administrated with different concentration of PLG (from 10−11 to10−3 mol) for 24 h; we detected MMP and calculated the EC50 of PLG. The results showed that rotenone treatment obviously decreased MMP (K), and the EC50 of PLG in primary neurons was 10−7.823 mol based on MMP (L). This value was roughly correlated with the concentration used in vitro and brain exposure in vivo. These results indicate that PLG protects against rotenone-induced mitochondrial dysfunction.
Figure 4. PLG reverses the decreases in mitochondrial complex I activity and MMP and blocks mPTP opening induced by rotenone. SK-N-SH cells and rat primary neurons were treated with rotenone; 2 h later, PLG was added at a concentration of 0.1 μM for 24 h. (A, C) MMP was assessed using JC-1 staining in SK-N-SH cells (A) and primary neurons (C). Coenzyme Q10 (CoQ10, 10 μM for 12 h), a component of the mitochondrial respiratory chain, served as a positive control. (B, D) Quantitative analysis of fluorescence intensity in SK-N-SH cells (B) and primary neurons (D). (E, G) mPTP opening was assessed by calcein-AM staining in SK-N-SH cells (E) and primary neurons (G). Cyclosporine A (CsA, 100 nM for 24 h), an mPTP inhibitor, served as a positive control. (F, H) Quantitative analysis of fluorescence intensity in SK-N-SH cells (F) and primary neurons (H). (I, J) Mitochondrial complex I activity was detected in SK-N-SH cells (I) and primary neurons (J). (K, L) ED50 of PLG in primary neurons. Primary neurons were treated with rotenone followed by different concentration of PLG (10−11 to 10−3 mol) for 24 h. The ED50 of PLG was calculated based on MMP. Bar: 100 μm. Data are expressed as the mean ± SD (one-way analysis of variance). ###P<0.001 vs. control (Con); **P<0.01 vs. rotenone (Rot) (n = 3).
PLG induces autophagy by promoting the dissociation of the BCL2-BECN1 complex
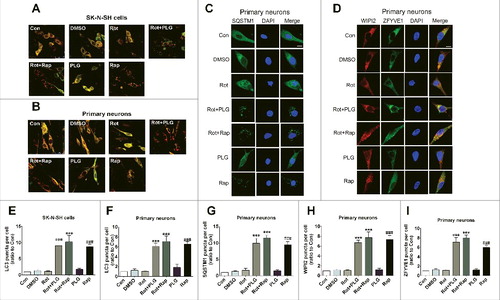
Autophagy is a cellular mechanism for eliminating damaged organelles, including mitochondria. To investigate the effects of PLG on autophagy, we measured the conversion of microtubule-associated protein 1 light chain 3 beta-I/LC3B-I to LC3B-II by western blotting. The conversion of LC3B-I to LC3B-II increased after cotreatment with PLG and rotenone as compared to the rotenone-only group, indicating that autophagy was induced. Treatment with rapamycin (Rap; 40 nM for 6 h), as an autophagy agonist, also increased the conversion of LC3B-I to LC3B-II relative to the control group, whereas PLG alone had no effect (A,B,D,E,Fig. S1). To further investigate the effects of PLG on autophagy, we measured the level of the autophagy receptor SQSTM1 by western blotting. Administration of PLG and Rap along with rotenone decreased SQSTM1 expression, indicating that the level of autophagy increased. In contrast, no difference was observed in the PLG-only group (A,C,D,F). To investigate autophagy more comprehensively, cells were treated with bafilomycin A1 (BafA1), a vacuolar-type H+-translocating ATPase inhibitor (100 nM for 6 h), and LC3 and SQSTM1 levels were examined. The conversion of LC3B-I to LC3B-II and SQSTM1 expression were increased by lysosome inhibition in cells treated with PLG or Rap along with rotenone, indicating that autophagy was induced following PLG treatment ().
Figure 5. PLG stimulates autophagy in cells treated with rotenone. SK-N-SH cells and rat primary neurons were treated with rotenone; after 2 h, PLG was added at a concentration of 0.1 μM for 24 h. Rapamycin (Rap; 40 nM for 6 h), an autophagy agonist, served as a positive control. (A) Western blot analysis of LC3B-II and SQSTM1 levels as measures of autophagy induction in the presence of functional or dysfunctional lysosomes (bafilomycin A1[BafA1, 100nM for 6h])in SK-N-SH cells. (B, C) Quantification of LC3B-II (B) and SQSTM1 (C) in SK-N-SH cells. (D) Western blot analysis of LC3B-II and SQSTM1 levels as measures of autophagy induction in the presence of functional or dysfunctional lysosomes (BafA1, 100 nM for 6 h) in primary neurons (D). (E, F) Quantification of LC3B-II (E) and SQSTM1 (F) in primary neurons. Data are expressed as the mean ± SD (one-way analysis of variance). ##P<0.01 vs. control (Con); **P<0.01 vs. rotenone (Rot) or rotenone co-treated with BafA1 (Rot+BafA1)(n = 3).
![Figure 5. PLG stimulates autophagy in cells treated with rotenone. SK-N-SH cells and rat primary neurons were treated with rotenone; after 2 h, PLG was added at a concentration of 0.1 μM for 24 h. Rapamycin (Rap; 40 nM for 6 h), an autophagy agonist, served as a positive control. (A) Western blot analysis of LC3B-II and SQSTM1 levels as measures of autophagy induction in the presence of functional or dysfunctional lysosomes (bafilomycin A1[BafA1, 100nM for 6h])in SK-N-SH cells. (B, C) Quantification of LC3B-II (B) and SQSTM1 (C) in SK-N-SH cells. (D) Western blot analysis of LC3B-II and SQSTM1 levels as measures of autophagy induction in the presence of functional or dysfunctional lysosomes (BafA1, 100 nM for 6 h) in primary neurons (D). (E, F) Quantification of LC3B-II (E) and SQSTM1 (F) in primary neurons. Data are expressed as the mean ± SD (one-way analysis of variance). ##P<0.01 vs. control (Con); **P<0.01 vs. rotenone (Rot) or rotenone co-treated with BafA1 (Rot+BafA1)(n = 3).](/cms/asset/f6684fe8-6964-4744-bd0b-7cf3cc7ce6db/kaup_a_1390636_f0005_b.gif)
Cells were transfected with a tandem monomeric red fluorescent protein (mRFP)-green fluorescent protein (GFP)-LC3 virus to estimate the level of autophagy. We found that the numbers of puncta corresponding to autophagosomes and LC3-positive autolysosomes were increased after PLG treatment as compared with the rotenone-only and control groups (A,B,E,F). Immunofluorescence analysis revealed many SQSTM1 inclusions in cells in the PLG and rotenone cotreatment groups, confirming that PLG induced autophagy (C,G). The phosphatidylinositol 3-kinase (PtdIns3K) complex—which includes BECN1, ATG14, PIK3C3/VPS34, and PIK3R4/VPS15—is important for autophagic phagophore assembly and recruitment of accessory proteins. PtdIns3K complex activity is reflected by the localization of ZFYVE1/DFCP1 (zinc finger, FYVE domain containing 1), a PtdIns3K product (phosphatidylinositol-3-phosphate [PtdIns3P])-binding protein that is recruited to the complex to form the omegasome.Citation26 WIPI2 (WD repeat domain, phosphoinositide interacting 2) is similarly recruited and in turn recruits the ATG12–ATG5-ATG16L1 complex, which is involved in LC3 lipidation. Here, we analyzed ZFYVE1 and WIPI2 localization to investigate omegasome formation. Numerous ZFYVE1 and WIPI2 puncta were observed in the PLG and rotenone cotreated group, indicating that PLG promotes omegasome formation (D,H,I).
Figure 6. PLG induces autophagy by increasing PtdIns3K complex activity. SK-N-SH cells and rat primary neurons were treated with rotenone. PLG was added 2 h later at 0.1 μM for 24 h. Rapamycin (Rap; 40 nM for 6 h), an autophagy agonist, served as a positive control. (A, B) Autophagy evaluated by counting fluorescent LC3 puncta in SK-N-SH cells (A) and primary neurons (B). (C)Immunofluorescence analysis of SQSTM1 to evaluate autophagy in primary neurons. Nuclei were counterstained with DAPI. (D) Transfection of GFP-ZFYVE1 plasmid and immunofluorescence detection of WIPI2 to evaluate PtdIns3K complex activity in primary neurons. Nuclei were counterstained with DAPI. (E, F) Quantification of LC3 puncta in SK-N-SH cells (E) and primary neurons (F). (G) Quantification of SQSTM1 puncta in primary neurons. (H, I) Quantification of WIPI2 (H) and ZFYVE1 (I) puncte in primary neurons. Bar: 25 μm (A, B) and 10μm (C, D). Data are expressed as the mean ± SD (one-way analysis of variance). ###P<0.001 vs. control (Con), ***P<0.001 vs. rotenone (Rot) (n = 3).
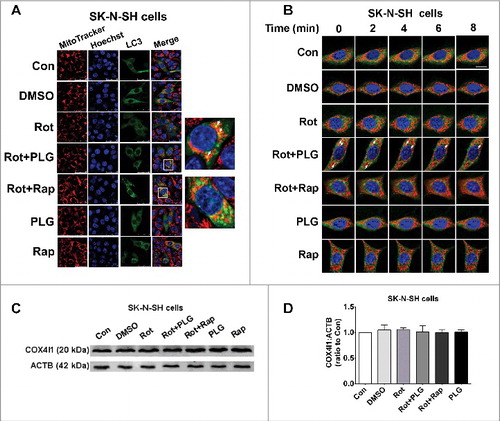
To investigate whether autophagy was related to the clearance of damaged mitochondria, we examined the colocalization of mitochondria and LC3 by immunocytochemistry. In the rotenone and PLG cotreated group, LC3 and mitochondria were partly colocalized, indicating that autophagy induced by PLG may eliminate damaged mitochondria (A).We used a live-cell imaging system to observe the clearance of mitochondria-LC3 puncta. The colocalization of mitochondria and LC3 decreased over time, indicating that damaged mitochondria were cleared through the autophagy pathway (B). We also analyzed the degradation of mitochondrial protein by western blotting; we did not observe decreases in the mitochondrial protein COX4I1/COX IV (cytochrome c oxidase subunit 4I1), which may be because mitochondria normally undergo frequent fusion and fission resulting in substantial turnover of this, and other, proteins (C,D).
Figure 7. PLG promotes the clearance of damaged mitochondria by inducing autophagy. SK-N-SH cells were treated with rotenone; 2 h later, PLG (0.1 μM) was added for 24 h. Rapamycin (Rap; 40 nM for 6 h), an autophagy agonist, served as a positive control. (A) Mitochondria were labeled with MitoTracker Red, and LC3B was detected by immunofluorescence (green). Nuclei were detected by Hoechst staining (blue) to observe the colocalization of mitochondria and LC3. (B) The clearance of mitochondria-LC3 puncta was observed by live cell imaging. White arrows are colocalization of mitochondria and LC3. (C) The expression level of the mitochondrial protein COX4I1 in SK-N-SH cells was detected by western blotting. (D) Quantification of COX4I1 level in SK-N-SH cells. Bar: 25 μm (A) and 10 μm (B); control (Con); rotenone (Rot) (n = 3).
It has been reported that PLG analogs activate the transcription factor NFE2L2/NRF2 (nuclear factor, erythroid derived 2, like 2),Citation27 which transactivates autophagy-related genes;Citation28 we therefore investigated whether NFE2L2 is involved in the PLG-induced autophagy pathway by knocking down NFE2L2 expression using 3 short hairpin RNAs (shNFE2L2-766, shNFE2L2-934, and shNFE2L2-1345) in cells cotreated with rotenone and PLG (Fig. S2A,B). NFE2L2 knockdown had no effect on PLG-induced autophagy, indicating that NFE2L2 was not involved in this process (Fig. S2C).
BECN1, a component of the PtdIns3K complex, is required for autophagy initiation; however, BECN1 also binds to BCL2 to form a BCL2-BECN1 heterodimer, which inhibits autophagy. We investigated whether PLG acts by modulating the activities of BECN1 and BCL2 and found that a smaller amount of BECN1 co-immunoprecipitated with BCL2 after PLG and rotenone cotreatment as compared to control and rotenone groups. Interestingly, PLG failed to induce this dissociation in the presence of ABT-199 (100 nM for 24 h), a specific inhibitor of BCL2 ().Citation29 These findings indicate that PLG promotes the dissociation of the BCL2-BECN1 heterodimer and thereby activates autophagy.
Figure 8. PLG promotes the dissociation of BCL2 and BECN1. SK-N-SH cells and rat primary neurons were treated with rotenone; 2 h later, PLG was added at a concentration of 0.1 μM for 24 h. ABT199 (100 nM for 24 h), a BCL2 inhibitor, abolished the effects of PLG on BCL2 and BECN1 dissociation. (A) Protein samples from SK-N-SH cells and primary cultured neurons used as input in the experiment described in panels (B–E). (B–E) Interaction of BCL2 and BECN1 detected by immunoprecipitation with antibodies against BECN1 (C, E) and BCL2 (B, D) in SK-N-SH cell (B, C) and primary neurons (D, E). Control (Con); rotenone (Rot) (n = 3).
PLG exerts anti-apoptotic effects by stabilizing the BCL2-BAX heterodimer
Phosphorylation of BCL2 at Ser70 leads to the dissociation of the BCL2-BECN1 complex;Citation17 we therefore investigated the effects of PLG on BCL2 phosphorylation. BCL2 Ser70 phosphorylation was increased by PLG treatment, an effect that was reversed by the BCL2 inhibitor ABT-199; paclitaxel (25 nM for 18 h) served as a positive control, which could induce BCL2 phosphorylation at Ser70 (A–C).Citation15 BCL2 phosphorylation at Ser70 site also increases its anti-apoptotic activity by enhancing binding to BAX or BAK1.Citation15,Citation30 Based on these observations, we measured the interaction between BCL2/phospho-BCL2 and BAX by co-immunoprecipitation. Both BCL2 and phospho-BCL2 interacted with BAX in the control group; rotenone treatment abolished this interaction, but the effect was reversed by PLG treatment, indicating that PLG exerts protection by stabilizing the BCL2-BAX heterodimer (D–G, S3).
Figure 9. PLG promotes BCL2 phosphorylation at Ser70 and the interaction between BCL2 and BAX. SK-N-SH cells and rat primary neurons were treated with rotenone; after 2 h, PLG (0.1 μM) was added for 24 h. ABT199 (100 nM for 24 h), an inhibitor of BCL2, abolished the effects of PLG on the dissociation of BCL2 and BECN1. Paclitaxel (PTX, 25 mM for 16 h) was used as a positive control for BCL2 phosphorylation at Ser70. (A) Protein samples from SK-N-SH cells and primary cultured neurons used for immunoprecipitation and western blot analysis of phospho-BCL2 (Ser70). (B, C) Quantification of phospho-BCL2:BCL2 in SK-N-SH cells (B) and primary neurons (C). (D–G) Interaction of BCL2 and BAX detected by immunoprecipitation with antibodies against BCL2 (D, E) and BAX (F, G) in SK-N-SH cells (D, F) and primary neurons (E, G). Data are expressed as mean ± SD (one-way analysis of variance). Control (Con); *P<0.05, ***P<0.001, ****P<0.0001 vs. rotenone (Rot) (n = 3).
Our results showed that PLG treatment promoted autophagy and inhibited apoptosis by increasing BCL2 phosphorylation at Ser70, although the underlying mechanisms remain unclear. A previous study showed that MAPK/JNK (mitogen-activated protein kinase) mediates BCL2 phosphorylation;Citation17 we therefore investigated whether PLG can modulate MAPK/JNK activity following rotenone treatment. MAPK8/JNK1 activity was measured by evaluating the phosphorylation of MAPK8 at Thr183 and Tyr185. MAPK8 was not activated in the control group; however, rotenone treatment caused a slight increase MAPK8 activity, whereas PLG or rapamycin treatment following rotenone markedly enhanced MAPK8 activation in both SK-N-SH cells and primary neurons (A,B,D,E). These changes in MAPK8 activity were correlated with BCL2 phosphorylation level (A,B,C,F), suggesting that PLG induces BCL2 phosphorylation at the Ser70 site via activation of MAPK8 signaling.
Figure 10. PLG increases BCL2 phosphorylation by activating MAPK8. SK-N-SH cells and rat primary neurons were treated with rotenone; 2 h later, PLG (0.1 μM) was added for 24 h. Rapamycin (Rap; 40 nM for 6 h), an autophagy agonist, served as a positive control. (A, D) Western blot analysis of phospho-MAPK8 and phospho-BCL2 levels in SK-N-SH cells (A) and rat primary neurons (D). (B, E) Quantification of phospho-BCL2:BCL2 levels in SK-N-SH cells (B) and rat primary neurons (E). (C, F) Quantification of phospho-MAPK8:MAPK8 levels in SK-N-SH cells (C) and rat primary neurons (F). Data are expressed as mean ± SD (one-way analysis of variance). ## P<0.01, ####P<0.0001 vs. control (Con).****P<0.0001 vs. rotenone (Rot) (n = 3).
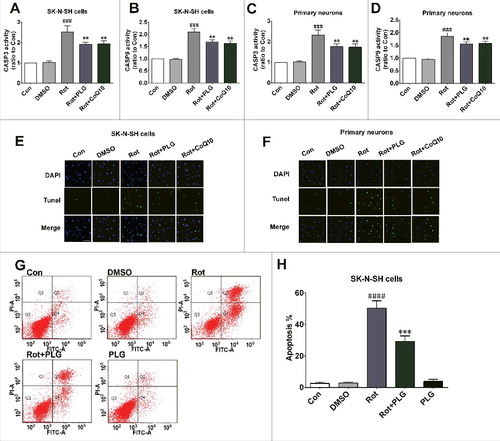
To determine whether this is the mechanistic basis for the apoptosis-inhibiting effect of PLG, we evaluated the activities of CASP3/caspase-3 and CASP9, which are regulators of both intrinsic and extrinsic (CASP3) or intrinsic (CASP9) apoptosis pathways. CASP3 and CASP9 were activated by rotenone treatment, which was abrogated by PLG (A–D). The terminal deoxynucleotidyl transferase dUTP nick end labeling (TUNEL) assay also showed that PLG blocked the rotenone-induced increase in apoptosis (E, F). ANXA5/annexinV-fluorescein isothiocyanate (FITC)-PI staining confirmed that PLG treatment abrogated rotenone-induced apoptosis (G, H). Thus, PLG suppresses apoptosis induced by rotenone by stabilizing the BCL2-BAX heterodimer.
Figure 11. PLG inhibits caspase-dependent apoptosis induced by rotenone. SK-N-SH cells and rat primary neurons were treated with rotenone; 2 h later, PLG (0.1 μM) was added for 24 h. (A–D) CASP3 (A, C) and CASP9 (B, D) activity were detected to assess apoptosis in SK-N-SH cells (A, B) and primary neurons (C, D). (E, F) Apoptotic cells detected with the TUNEL assay; nuclei were counterstained with DAPI. (G) ANXA5 (A)-FITC-PI-stained SK-N-SH cells were detected by flow cytometry to assess apoptosis. (H) Quantification of the apoptosis ratio in SK-N-SH cells. Bar: 50 μm. Data are expressed as mean ± SD (one-way analysis of variance). ###P<0.001, ####P<0.0001 vs. control (Con); **P<0.01, ***P<0.001 vs. rotenone (Rot) (n = 3).
PLG induces autophagy and suppresses apoptosis by enhancing BCL2 phosphorylation at Ser70 in a mouse model of rotenone-induced PD
We found that PLG induced autophagy and suppressed apoptosis in rotenone-treated cells by increasing phosphorylation of BCL2 at Ser70. To confirm this finding in vivo, we evaluated the level of BCL2 Ser70 phosphorylation in mouse midbrain. BCL2 Ser70 phosphorylation was increased in the 2 and 4 mg/kg PLG groups relative to rotenone-only or control mice, which was correlated with MAPK8 activation (A,C,D). PLG also strongly induced autophagy, as evidenced by the conversion of LC3B-I to LC3B-II (B); this induction was likely related to the dissociation of BCL2 and BECN1 (D,E). Moreover, the interaction of BCL2 and BAX was increased in the presence of PLG (F,G), whereas the activation of CASP3 and CASP9 by rotenone was suppressed (H,I), consistent with the in vitro findings. These results demonstrate that PLG promotes BCL2 phosphorylation at Ser70 by activating MAPK8 signaling, which not only induces autophagy by promoting the dissociation of BCL2 and BECN1, but also suppresses apoptosis by stabilizing the BCL2 and BAX heterodimer ().
Figure 12. PLG induces autophagy and inhibits apoptosis by phosphorylating BCL2 at Ser70via MAPK8 activation. C57BL mice were treated with rotenone (10 mg/kg) for 6 wk followed by PLG (2 or 4 mg/kg) or l-dopa (20 mg/kg) for 4 wk. (A) Protein samples from the midbrain were used for immunoprecipitation and western blot analyses of phospho-BCL2 (Ser70) level, phospho-MAPK8 and LC3. (B, C) Quantification of LC3B-I to LC3B-II conversion (B), phospho-BCL2:BCL2 level (C) and phospho-MAPK8:MAPK8 level (D) in the midbrain. (E, F) Interaction of BCL2 and BECN1 detected by immunoprecipitation with antibodies against BECN1 (E) and BCL2 (F). (G, H) Interaction of BCL2 and BAX detected by immunoprecipitation with antibodies against BCL2 (G) and BAX (H). (I, J) CASP3 (I) and CASP9 (J) activities. Data are expressed as the mean ± SD (one-way analysis of variance). ###P<0.001 vs. control (Con); **P<0.01, ***P<0.001 vs. rotenone (Rot) (n = 3).
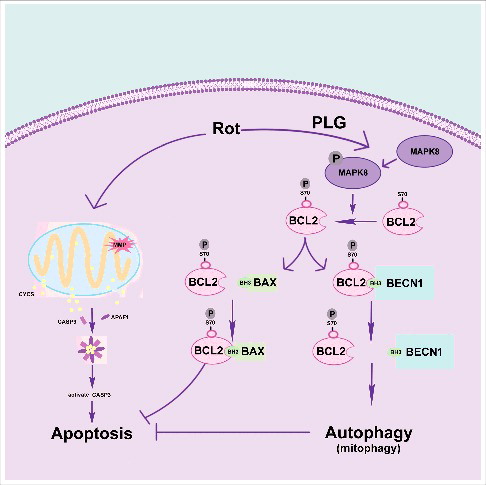
Figure 13. PLG restores the balance between apoptosis and autophagy by promoting BCL2 phosphorylation at Ser70. Rotenone induces mitochondrial damage by promoting the opening of mPTP, leading to CYCS/cytochrome C release, caspase activation, and apoptosis. PLG treatment promotes BCL2 phosphorylation at Ser70, which induces autophagy by blocking the interaction between BECN1 and BCL2 and also inhibit apoptosis by enhancing the interaction between BCL2 and BAX.
Discussion
Our previous study confirmed that treatment with Piper longum L. alkaloids, including PLG, has protective effects in rotenone-induced PD models that involve blocking mPTP opening and apoptosis, although the underlying mechanism was previously unknown. We showed here that PLG exerts protective effects by inducing BCL2 phosphorylation at Ser70 via MAPK8 activation, which resulted in the dissociation of BCL2 and BECN1 and the stabilization of the BCL2 and BAX heterodimer, consequently enhancing autophagy and inhibiting apoptosis.
PD is the second most common neurodegenerative disease. An imbalance between autophagy and apoptosis is thought to contribute to PD pathogenesis; restoring this balance may therefore be a potential treatment strategy.Citation10 The PtdIns3K complex is essential for omegasome formation and autophagy induction. In the present work, we found that PLG increased the activity of the PtdIns3K complex by increasing BCL2 phosphorylation at Ser70 via MAPK8 activation, which induced its dissociation from BECN1, a component of the PtdIns3K complex. Moreover, BCL2 Ser70 phosphorylation also increased the affinity between BCL2 and BAX, which may further inhibit apoptosis. Thus, PLG restores the balance between apoptosis and autophagy by modulating BCL2 phosphorylation at Ser70.
PLG is considered as an antitumor agent that selectively targets cancer cells.Citation19,Citation31 However, few studies have investigated the effects of PLG in neurodegenerative disease. The present study showed that PLG has neuroprotective effects in PD, albeit at a different concentration than that used for cancer treatment. PLG promotes tumor cell apoptosis at concentrations of 5 and 10 μM; this is much higher than the concentration that was shown to inhibit apoptosis in our model (0.1 μM). It has also been reported that 10 μM PLG promotes autophagy via inhibition of MTOR (mechanistic target of rapamycin [serine/threonine kinase])-AKT signaling or activation of the MAPK/p38 signaling pathway.Citation32,Citation33 In our study, treatment with 0.1 μM PLG induced autophagy by causing the dissociation of BCL2 and BECN1. This is consistent with the observation that phosphorylation of BCL2 at Ser70 not only induces autophagy by promoting dissociation of BCL2 and BECN1, but also inhibits apoptosis by enhancing BCL2 activity.Citation16,Citation17 Although PLG analogs were found to activate NFE2L2 signaling and modulate autophagy genes, in this study, NFE2L2 knockdown had no effect on PLG-induced autophagy, suggesting that NFE2L2 signaling is not involved in this process. Thus, PLG is not only a potential anticancer agent but also one that can provide neuroprotection; moreover, therapeutic strategies that modulate BCL2 phosphorylation may be effective for the treatment of neurodegenerative diseases such as PD in which the balance between apoptosis and autophagy is perturbed.
l-Dopa—a dopamine replacement drug—is the most common and effective approach for the treatment of PD, although it has some long-term side effects including the deterioration of motor function.Citation34 These serious side effects limit the clinical use of l-dopa, which makes the development of novel therapeutic strategies for PD treatment all the more urgent. Many Chinese medicines exert neuroprotective effects and are effective in modulating apoptosis and autophagy. Resveratrol also alleviates motor impairment in MPTP-rotenone-6-OHDA-induced PD models by inducing autophagy or suppressing inflammation.Citation35−37 Piperine is used in Chinese medicine for its anti-inflammatory and -apoptotic properties;Citation38–40 we previously showed that it has anti-apoptotic and autophagy-inducing effects when combined with PLG. Here, we show that PLG by itself had similar effects.
In conclusion, we found PLG alleviated motor impairment and loss of midbrain dopaminergic neurons induced by rotenone treatment in a mouse model of PD. PLG also improved cell viability and suppressed cytotoxicity caused by rotenone. These protective effects involved inhibition of apoptosis and induction of autophagy by increased phosphorylation of BCL2 at Ser70 via MAPK8/JNK1 activation. Our findings indicate that restoring the balance between apoptosis and autophagy by targeting BCL2 may be an effective treatment for PD.
Materials and methods
Animals
C57BL male mice (3 mo old) were purchased from Vital River Laboratories (Beijing, China) and housed at room temperature (22°C–25°C) under a 12:12 h light/dark cycle. Animal experiments conformed to the National Institutes of Health (NIH; Bethesda, MD, USA) guidelines for animal care and use. Mice were randomly divided into 6 groups. The control and dimethyl sulfoxide (DMSO) groups received normal saline and DMSO, respectively; rotenone groups were orally administered rotenone (10 mg/kg) for 6 wk, after which they received PLG (2 or 4 mg/kg) or 3, 4-dihydroxyphenyl-l-alanine(l-dopa; 50 mg/kg) by the same route for 4 wk.
Reagents
Antibodies against the following proteins were used in the study: ACTB (1:5000; Sigma-Aldrich, A5060), BAX (1:1000; Cell Signaling Technology, 2772), BCL2 (1:1000; Cell Signaling Technology, 3498), phosphorylated (p-)BCL2 (Ser70) (1:1000; Cell Signaling Technology, 2827), BECN1 (1:1000; Cell Signaling Technology, 3495), IgG (1:1000; Sigma-Aldrich, I5006), p-MAPK8/JNK1 (1:1000; Cell Signaling Technology, 4668 [we note that this antibody may react with phosphorylated MAPK1/3 and MAPK/p38]), MAPK8/JNK1 (1:1000; Cell Signaling Technology, 3708 [we note that this antibody may cross-react with MAPK9/JNK2]), LC3B (1:1,000; Novus Biologicals, NB100-2220), NFE2L2/NRF2 (1:1000; Cell Signaling Technology, 12721), SQSTM1 (1:1000; Cell Signaling Technology, 5114), TH (1:1000; Sigma-Aldrich, T2928), and WIPI2 (1:1000; Cell Signaling Technology, 8567). Fluorophore-conjugated secondary antibodies, including m680 (LI-COR Biosciences, 926–68070), m800 (LI-COR Biosciences, 926–32210), R680 (LI-COR Biosciences, 926–68071), and m800 (LI-COR Biosciences, 926–32211), were used at 1:10,000 dilution. Other reagent includes ABT-199 (Selleck, S8048), BafA1 (Selleck, S1413), CoQ10 (Sigma-Aldrich, C9538), CsA (Selleck, S2286), l-dopa (Sigma-Aldrich, SML0091), paclitaxel (Selleck, S1150), phenacetin (Sigma-Aldrich, 77440), PLG(Sigma-Aldrich, SML0221), rotenone (Sigma-Aldrich, R8875), terfenadine (Sigma-Aldrich, T9652), rapamycin (Sigma-Aldrich, V900930) and warfarin (Sigma-Aldrich, UC213).
Rotarod test
The rotarod test was used to analyze motor functioning in mice as previously described.Citation41 Briefly, mice were trained once a day for 3 d with rotation speeds of 10, 12, and 15 rpm from d 1–3. The length of time that the mouse remained on the rod on the 3 occasions was averaged.
Pole test
The pole test was used to evaluate the degree of bradykinesia and was carried out as previously described.Citation42 Briefly, a mouse was placed at the top of a pole with a length of 50 cm and radius of 4 mm, and the time taken for the mouse to reach the ground was recorded over 3 trials and averaged.
Detection of plasma-brain distribution and plasma protein binding ratio
Male C57BL mice (3 mo old; n = 21) were randomly divided into 7 groups (n = 3 each). Mice were administered PLG (4 mg/kg), and were sacrificed after 15 min, 30 min, or 1, 2, 4, 8, or 24 h. Blood and brain tissue samples were collected. After anticoagulation, blood samples were centrifuged at 5000 × g for 10 min to separate the plasma. Brain tissue samples were weighed, and 2 × normal saline was added followed by homogenization at high speed. Plasma and brain homogenates were used for analysis. The internal standard solution (200 μl) and 5 μl methanol were added to 50μl of plasma and brain tissue sample. The internal standard solution contained terfenadine (5 ng/ml) and methanol/acetonitrile (1:1, v/v). Samples were vortexed for 1 min and then centrifuged at 5000 × g for 10 min. The supernatant was collected and 10 μl of the supernatant were injected into the LC-MS/MS system (Shimadzu, Kyoto, Japan) and tandem Sciex API 4000 Qtrap mass spectrometer (Applied Biosystems, Concord, ON, Canada). Samples were separated with a mobile phase consisting of water (solvent A) and acetonitrile (solvent B); both solvents contained 0.1% formic acid. A Phenomenex Gemini C18 column (50 × 2.00 mm, 5 μm) was used at room temperature. Solvent gradients were 0.01–0.60 min with 10% B, 0.60–2.00 min with 10%–98% B, and 2.00–4.00 min with 10% B. The flow rate was 0.4 ml/min, and the injection volume was 10 μl. Plasma protein-binding ratio was determined by equilibrium dialysis, with phenacetin and warfarin (both at 1 μM) used as controls. The concentrations of PLG were 1 and 10 μM.
Immunohistochemistry
Immunohistochemistry was carried out as previously described.Citation43 Mice were anesthetized with 8% chloral hydrate and perfused with physiological saline followed by 4% paraformaldehyde. The brain was removed and dehydrated in 20% and 30% sucrose solution, then sectioned at a thickness of 20 μm. Sections were rinsed in phosphate-buffered saline (PBS; Origene, ZLI-9062) and then incubated in 3% H2O2 for 10 min to block endogenous peroxidase activity. After washing in PBS, sections were incubated in 10% goat serum (Cell Signaling Technology, 5425) followed by 0.1% TritonX-100 (Sigma-Aldrich, T9284) in PBS for 60 min, then incubated overnight at 4°C in anti-TH antibody. A biotinylated goat anti-mouse secondary antibody (Zhongshan Golden Bridge Biotechnology Co., PV9002) and diaminobenzidine (Zhongshan Golden Bridge Biotechnology Co., ZLI-9017) were used to detect immunoreactivity. A total of 20 consecutive sections were selected from each brain for examination. Unbiased stereology was used to estimate the number of dopaminergic neurons of each section at 40 × magnification using a DM5000B microscope (Leica Microsystems, Bannockburn, IL, USA) and Stereo Investigator software (MBF Bioscience, Williston, VT, USA). The total number of TH-positive neurons was generated with the optical fractionator probe. Five mice from each group were used for this measurement. The coefficient of error (Gundersen) for individual counts was consistently 0.05.
Measurement of dopamine levels by HPLC
Striatum tissue was weighed and homogenized in 0.1 mol/l HClO4 and incubated on ice for 1 h, then centrifuged at 12,000 × g at 4°C for 20 min. The supernatant was mixed with the HPLC mobile phase consisting of 63.5 mM citric acid monohydrate, 60.9 mM trisodium citrate dehydrate, 0.1 M EDTA, and 0.5 M sodium 1-decanesulfonate (Sigma-Aldrich, V900327), pH 4.3 and injected into the HPLC column under analytical conditions. Data are expressed as pg dopamine per mg tissue.
Determination of mitochondrial complex I activity
Mitochondrial complex I activity was measured using the Mitochondrial Complex I Activity Assay kit (Merck-Millipore, AAMT001-1KIT) according to the manufacturer's protocol. Cells and tissue were frozen and thawed 3 times as previously describedCitation44 and protein concentration was measured with the Bicinchoninic Acid Protein Assay kit (Pierce Biotechnology, 23225). Cell and tissue lysates were incubated with complex I capture antibody for 3 h at room temperature, and complex I activity was determined by measuring the oxidation of nicotinamide adenine dinucleotide (NAD)H to NAD+, which was observed as a reduction in the dye and a corresponding increase in absorbance at 450 nm after 30 min. Each sample was tested in duplicate and activity is expressed as the change in absorbance per minute per amount of sample loaded in the well.
Measurement of CASP3 activity
CASP3 activity was assessed using the Caspase-3 Colorimetric Assay kit (Applygen Technologies, C1113) according to the manufacturer's instructions. Cell or tissue samples (5 mg) were homogenized and incubated in 120 μl lysis buffer on ice for 10 min, then centrifuged at 12,000 × g for 10 min at 4°C. The soluble fraction was transferred to a 1.5 ml tube, and protein concentration was determined with a Bradford assay kit (GenMed Scientifics, GMS30030.1).
Measurement of CASP9 activity
CASP9 activity was determined using the Caspase-9 Colorimetric Assay kit (GenMed Scientifics, C1119) based on spectrophotometric detection of the chromophore p-nitroanilide (pNA) after its cleavage from the labeled substrate LEHD-pNA. A 60 μl volume of cell lysis buffer was added to the cell pellet, which was vortexed and incubated on ice for 15 min, followed by centrifugation at 12,000 × g for 10 min at 4°C. Protein concentration was determined using a Bradford assay kit (Bio-Rad, 500-0006), and 50 μl protein were added to a 96-well plate along with 45 μl of reaction buffer and 5 μl of 2 mM LEHD-pNA (for a final concentration of 100 μM). After incubation at 37°C for 2 h, absorbance was read at 405 nm on a spectrophotometer. One unit of activity was defined as the amount of enzyme that cleaved 1.0 nmol of the pNA substrate per hour at 37°C under saturated substrate concentrations.
Cell viability and LDH assay
Cell viability was determined with the MTT assay as previously described. Briefly, cells were seeded in a 96-well microplate (1 × 10⁴ cells/well) and cultured for 24 h. The medium was replaced by MTT (Sigma-Aldrich, M2128) at a final concentration of 0.5 mg/ml, followed by incubation for 4 h. Cells were washed twice with PBS and formazan crystals were dissolved in 100 μl DMSO. Absorbance was read at 490 nm with a microplate reader (PerkinElmer, Waltham, MA, USA).
The LDH assay was carried out using a cytotoxicity detection kit (Roche Diagnostics, 4744926001). LDH release was measured in a 100 μl aliquot of supernatant, with 100 μl preservation solution used as a blank to correct the optical density reading at 490 nm. Each sample was tested in triplicate, and the half-maximal effective concentration was averaged from 5 experiments.
mRFP-GFP-tagged LC3
SK-N-SH cells and primary neurons were infected with a fluorescent mRFP-GFP-tagged LC3-expressing virus (Genechem, GPL2001A) according to the manufacturer's instructions. Cells in each group were infected for 72 h. GFP and mRFP expression was visualized with a confocal microscope (Leica Microsystems). Autophagic flux was determined by analyzing the punctate pattern of GFP and mRFP.
Immunofluorescence and confocal microscopy
Primary rat cortical neurons were seeded on poly-l-lysine-coated dishes and cultured for 7 days. GFP-ZFYVE1 plasmid (provided by Yu Li, Tsinghua University), was transfected into neurons by electroporation. Neurons were treated with rotenone and PLG for 24 h, then fixed with 4% paraformaldehyde for 30 min, washed 3 times with PBS, and permeabilized with 0.3% TritonX-100 in PBS for 10 min at room temperature. After blocking with 10% normal goat serum for 1 h, neurons were incubated with rabbit anti-SQSTM1, -LC3, or -WIPI2 antibody overnight at 4°C followed by Alexa Fluor 594 (Invitrogen, A11037)-or Alexa Fluor488 (Invitrogen, A11034)-conjugated secondary antibody for 1 h at room temperature. Neurons were counterstained with DAPI (Sigma-Aldrich, D9542) and imaged with a confocal microscope (TCS SP8; Leica, Solms, Germany).
Mitochondria were labeled using MitoTracker Red dye (Invitrogen, M7512) according to the manufacturer's protocol. Briefly, SK-N-SH cells were seeded in 24-well plates. After 1 d, cells were treated with rotenone and PLG for 24 h, and then washed in PBS; MitoTracker Red was added at a concentration of 20 Nm followed by incubation for 15min at room temperature. Cells were imaged by confocal microscopy.
NFE2L2 knockdown
Primary rat cortical neurons were seeded on poly-l-lysine-coated6-well plates and cultured for 7 d before transfection with ShNFE2L2-766 (5’-CGCUCAGUUACAACUAGAUTT-3’), shNFE2L2-934 (5’-CCCGUUUGUAGAUGACAAUTT-3’), shNFE2L2-1345 (5’-CCAGUUGACAGUGAACUCATT-3’), and shNRF2L2 vectors (5’-UUCUCCGAACGUGUCACGUTT-3’) (Genepharma, 58067–58069) by electroporation. Neurons were treated with rotenone and PLG for 24 h, and then analyzed by western blotting.
TUNEL assay
Apoptosis of SK-N-SH cells and primary neurons were evaluated by the TUNEL assay (Roche Diagnostics, 11772465001) according to the manufacturer's protocol. Briefly, cells were cultured in dishes on cover slips coated with 100 mg/ml poly-l-lysine. After treatment, cells were fixed with 4% paraformaldehyde for 30 min, then washed 3 times with PBS before treatment with 2 μM proteinase K for 5 min for permeabilization. After 3 washes, cells were incubated with the TUNEL reaction mixture at 37°C for 60 min, and washed 3 times with PBS at room temperature; nuclei were then stained with DAPI for 5 min. Samples were visualized using a confocal microscope (Leica Micro systems).
PI-Hoechst staining
Apoptotic cells were identified by labeling with PI (4 µM; Sigma-Aldrich, P4170) and Hoechst 33432 (0.5 μg/ml; Sigma-Aldrich, B2261) for 10 min at 37°C. PI-positive cells were counted under an epifluorescence microscope at excitation and emission wavelengths of 535 and 615 nm, respectively. Images were acquired by high-content analysis to evaluate changes in the PI signal.
ANXA5-FITC-PI detection
Apoptosis of rat primary neurons was detected with the Annexin V-FITC Apoptosis Detection kit (Invitrogen, BMS500FI/300) according to the manufacturer's protocol. Briefly, SK-N-SH cells were seeded in 24-well plates. The following day, cells were treated with rotenone and PLG for 24 h, then washed with PBS and resuspended in 200 µl binding buffer (1 ×). Cell density should be 2–5 × 10⁵/ml. A 5 µl volume of ANXA5-FITC was added to 195 µl of cell suspension, which was incubated for 10 min at room temperature. Cells were washed in 200 µl binding buffer (1 ×) and resuspended in 190 µl binding buffer (1 ×); 10 µl of PI (20 µg/ml) were added, and cells were analyzed on a FACS Aria flow cytometer (Becton-Dickinson, San Jose, CA, USA).
JC-1 staining
The MMP of cells was measured using JC-1 (Sigma-Aldrich, T4069), a dual-emission membrane potential-sensitive probe that exists as a green fluorescent monomer at a low MMP and forms aggregates with red/orange fluorescence at a high MMP. Cells cultured in 24-well plates were washed twice with PBS, and JC-1 (1.3 μg/ml) was added for 30 min at 37°C. The change in fluorescence at 488/530 nm (green) and 549/595 nm (red) was monitored by high-content screening, and the ratio of green to red fluorescence intensity was determined.
Evaluation of mPTP activation with calcein-AM
Cells were grown in a 24-well plate and mPTP activation was determined by monitoring calcein-AM fluorescence using the MitoProbe Transition Pore Assay kit (Invitrogen, M34153) according to the recommended protocol. Briefly, cells were incubated with calcein-AM and CoCl2 with or without ionomycin in Hanks balanced salt solution with Ca2+ (Sigma-Aldrich, H1641) at 37°C for 15 min while under protection from light. After 2 washes with Hanks balanced salt solution with Ca2+, calcein-AM fluorescence was detected by high-content screening at 488/530 nm.
Co-immunoprecipitation
Cell extract (100 μg) was pre-cleared with protein-G agarose (Sigma-Aldrich, P7700), then incubated at 4°C overnight with anti-BECN1, -BCL2, or -BAX antibody with constant rotation. Protein G-sepharose beads (30 μl/tube; Sigma-Aldrich, P3296) were prewashed 3 times in immunoprecipitation buffer composed of 10 mM Tris-HCl, pH 7.5, 150 mM NaCl, 2 mM EDTA, 0.5% Triton X-100 for 15 min and then incubated at 4°C for 6 h with the protein/antibody mixture with constant rotation. The precipitant was collected by centrifugation at 10,000 × g for 1 min and washed 3 times with immunoprecipitation buffer to remove nonspecifically bound proteins. The washed beads were resuspended in sodium dodecyl sulfate–polyacrylamide gel electrophoresis (SDS–PAGE) loading buffer (30 μl/tube) and heated at 95°C for 5 min. Beads were removed by centrifugation at 10,000 × g for 1 min and the supernatant was analyzed by SDS-PAGE and western blotting.
Western blotting
Western blotting was carried out as previously described.Citation45 Cells or tissue were lysed on ice for 30 min in buffer containing 1% Nonidet P-40 (Sigma-Aldrich, 74385), 150 mM NaCl, 0.5% deoxycholic acid (Sigma-Aldrich, D2510), 50 mM Tris-HCl, pH7.4, 0.1% SDS (Sigma-Aldrich, L5750), and protease and phosphatase inhibitors (Roche Diagnostics, 04693132001 and 4906837001). Cell extracts were centrifuged at 12,000 × g for 30 min at 4°C, and the supernatant was resolved by 12%–15% Bis-Tris SDS-PAGE and transferred to polyvinylidene difluoride membranes that were probed overnight at 4°C for TH, BECN1, BCL2, p-BCL2 (Ser70), BAX, LC3, SQSTM1 and ACTB expression. Membranes were incubated with secondary antibody and protein bands were visualized by enhanced chemiluminescence and quantified using ImageJ software (NIH).
Primary neuronal culture
All experiments were authorized by the Institutional Animal Care and Use Committee of Capital Medical University of Science and Technology (approval no. SCXK-2011–004) and were carried out according to the NIH Guide for the Care and Use of Laboratory Animals. Surgeries were performed under chloral hydrate anesthesia. Primary neurons were prepared from brains of Sprague-Dawley rat embryos (d 14.5–15.5). Dissociated neurons were cultured in 6- or 24-well plates on cover slips coated with 0.1 mg/ml poly-l-lysine (Sigma-Aldrich, P1524) in Neurobasal medium (Gibco, 21103–049) supplemented with l-glutamine (0.5 mM) and 50 × B27 supplement (Gibco, 17504–044) for a final concentration of 1 ×. Primary neurons were treated with rotenone after 7 d of culture.
Statistical analysis
Western blots were analyzed as previously described.Citation46 Relative optical density values for bands corresponding to TH, SQSTM1, and NFE2L2 were normalized to the value for ACTB, whereas the phospho-BCL2 level was normalized to that of BCL2. The normalized ratio for the control group was taken as 1. For CASP3 and CASP9 activities, cell viability, and LDH assays, values for the control group were taken as 1. Statistical analysis was carried out using Prism 5 software (GraphPad Inc., La Jolla, CA, USA). Results are presented as mean ± SD of at least 3 independent experiments. Differences between groups were evaluated by analysis of variance, and were considered significant at P< 0.05.
Disclosure of potential conflicts of interest
The authors declare that they have no competing interests.
supp_data_1390636.zip
Download Zip (5 MB)Acknowledgments
This work was supported by grants from The National Key Plan for Scientific Research and Development of China (2016YFC1306002), National Natural Science Foundation of China (81371398).
Additional information
Funding
Related Research Data
Reference
- Kalia LV, Lang AE. Parkinson's disease. Lancet. 2015;386:896−912. doi:10.1016/S0140-6736(14)61393-3.
- Michel PP, Hirsch EC, Hunot S. Understanding Dopaminergic Cell Death Pathways in Parkinson Disease. Neuron. 2016;90:675−91. doi:10.1016/j.neuron.2016.03.038.
- Franco-Iborra S, Vila M, Perier C. The Parkinson Disease Mitochondrial Hypothesis: Where Are We at? Neuroscientist. 2016;22:266−77. doi:10.1177/1073858415574600.
- Perier C, Bove J, Vila M. Mitochondria and programmed cell death in Parkinson's disease: apoptosis and beyond. Antioxid Redox Signal. 2012;16:883−95. doi:10.1089/ars.2011.4074.
- Youle RJ, Narendra DP. Mechanisms of mitophagy. Nat Rev Mol Cell Biol. 2011;12:9−14. doi:10.1038/nrm3028.
- Green DR, Llambi F. Cell Death Signaling. Cold Spring Harb Perspect Biol. 2015;7(12).
- Ebrahimi-Fakhari D, McLean PJ, Unni VK. Alpha-synuclein's degradation in vivo: opening a new (cranial) window on the roles of degradation pathways in Parkinson disease. Autophagy. 2012;8:281−3. doi:10.4161/auto.8.2.18938.
- Kim DK, Lim HS, Kawasaki I, Shim YH, Vaikath NN, El-Agnaf OM, Lee HJ, Lee SJ. Anti-aging treatments slow propagation of synucleinopathy by restoring lysosomal function. Autophagy. 2016;12:1849−63. doi:10.1080/15548627.2016.1207014.
- Chen L, Xie Z, Turkson S, Zhuang X. A53T human alpha-synuclein overexpression in transgenic mice induces pervasive mitochondria macroautophagy defects preceding dopamine neuron degeneration. J Neurosci. 2015;35:890−905. doi:10.1523/JNEUROSCI.0089-14.2015.
- Ghavami S, Shojaei S, Yeganeh B, Ande SR, Jangamreddy JR, Mehrpour M, Christoffersson J, Chaabane W, Moghadam AR, Kashani HH, et al. Autophagy and apoptosis dysfunction in neurodegenerative disorders. Prog Neurobiol. 2014;112:24−49. doi:10.1016/j.pneurobio.2013.10.004.
- Venderova K, Park DS. Programmed cell death in Parkinson's disease. Cold Spring Harb Perspect Med. 2012;2(8).
- Czabotar PE, Lessene G, Strasser A, Adams JM. Control of apoptosis by the BCL-2 protein family: implications for physiology and therapy. Nat Rev Mol Cell Biol. 2014;15:49−63.
- Chittenden T, Harrington EA, O'Connor R, Flemington C, Lutz RJ, Evan GI, Guild BC. Induction of apoptosis by the Bcl-2 homologue Bak. Nature. 1995;374:733−6. doi:10.1038/374733a0.
- Oltvai ZN, Milliman CL, Korsmeyer SJ. Bcl-2 heterodimerizes in vivo with a conserved homolog, Bax, that accelerates programmed cell death. Cell. 1993;74:609−19.
- Dai H, Ding H, Meng XW, Lee SH, Schneider PA, Kaufmann SH. Contribution of Bcl-2 phosphorylation to Bak binding and drug resistance. Cancer Res. 2013;73:6998−7008. doi:10.1158/0008-5472.CAN-13-0940.
- Deng X, Gao F, Flagg T, May WS, Jr. Mono- and multisite phosphorylation enhances Bcl2's antiapoptotic function and inhibition of cell cycle entry functions. Proc Natl Acad Sci U S A. 2004;101:153−8. doi:10.1073/pnas.2533920100.
- Wei Y, Pattingre S, Sinha S, Bassik M, Levine B. JNK1-mediated phosphorylation of Bcl-2 regulates starvation-induced autophagy. Mol Cell. 2008;30:678−88. doi:10.1016/j.molcel.2008.06.001.
- Han JG, Gupta SC, Prasad S, Aggarwal BB. Piperlongumine chemosensitizes tumor cells through interaction with cysteine 179 of IkappaBalpha kinase, leading to suppression of NF-kappaB-regulated gene products. Mol Cancer Ther. 2014;13:2422−35. doi:10.1158/1535-7163.MCT-14-0171.
- Raj L, Ide T, Gurkar AU, Foley M, Schenone M, Li X, Guild BC. Selective killing of cancer cells by a small molecule targeting the stress response to ROS. Nature. 2011;475:231−4. doi:10.1038/nature10167.
- Bi Y, Qu PC, Wang QS, Zheng L, Liu HL, Luo R, Chen XQ, Ba YY, Wu X, Yang H. Neuroprotective effects of alkaloids from Piper longum in a MPTP-induced mouse model of Parkinson's disease. Pharm Biol. 2015;53:1516−24. doi:10.3109/13880209.2014.991835.
- Wang H, Liu J, Gao G, Wu X, Wang X, Yang H. Protection effect of piperine and piperlonguminine from Piper longum L. alkaloids against rotenone-induced neuronal injury. Brain Res. 2016;1639:214−27.
- Zheng L, Wang H, Ba YY, Liu HL, Wang M, Guo WW, Wu X, Yang H. [Protective effect of alkaloids from Piper longum in rat dopaminergic neuron injury of 6-OHDA-induced Parkinson's disease]. Zhongguo Zhong Yao Za Zhi. 2014;39:1660−5.
- Ren Z, Yang N, Ji C, Zheng J, Wang T, Liu Y, Zuo P. Neuroprotective effects of 5-(4-hydroxy-3-dimethoxybenzylidene)-thiazolidinone in MPTP induced Parkinsonism model in mice. Neuropharmacology. 2015;93:209−18. doi:10.1016/j.neuropharm.2015.01.030.
- Ben-Meir A, Burstein E, Borrego-Alvarez A, Chong J, Wong E, Yavorska T, Naranian T, Chi M, Wang Y, Bentov Y, et al. Coenzyme Q10 restores oocyte mitochondrial function and fertility during reproductive aging. Aging Cell. 2015;14:887−95. doi:10.1111/acel.12368.
- Alavian KN, Beutner G, Lazrove E, Sacchetti S, Park HA, Licznerski P, Li H, Nabili P, Hockensmith K, Graham M, et al. An uncoupling channel within the c-subunit ring of the F1FO ATP synthase is the mitochondrial permeability transition pore. Proc Natl Acad Sci U S A. 2014;111:10580–5. doi:10.1073/pnas.1401591111. PMID:24979777
- Axe EL, Walker SA, Manifava M, Chandra P, Roderick HL, Habermann A, Griffiths G, Ktistakis NT. Autophagosome formation from membrane compartments enriched in phosphatidylinositol 3-phosphate and dynamically connected to the endoplasmic reticulum. J Cell Biol. 2008;182:685−701. doi:10.1083/jcb.200803137.
- Peng S, Zhang B, Meng X, Yao J, Fang J. Synthesis of piperlongumine analogues and discovery of nuclear factor erythroid 2-related factor 2 (Nrf2) activators as potential neuroprotective agents. J Med Chem. 2015;58:5242−55. doi:10.1021/acs.jmedchem.5b00410.
- Pajares M, Jimenez-Moreno N, Garcia-Yague AJ, Escoll M, de Ceballos ML, Van Leuven F, Rábano A, Yamamoto M, Rojo AI, Cuadrado A. Transcription factor NFE2L2/NRF2 is a regulator of macroautophagy genes. Autophagy. 2016;12:1902−16. doi:10.1080/15548627.2016.1208889.
- Souers AJ, Leverson JD, Boghaert ER, Ackler SL, Catron ND, Chen J, Dayton BD, Ding H, Enschede SH, Fairbrother WJ, et al. ABT-199, a potent and selective BCL-2 inhibitor, achieves antitumor activity while sparing platelets. Nat Med. 2013;19:202−8. doi:10.1038/nm.3048.
- Deng X, Ruvolo P, Carr B, May WS, Jr. Survival function of ERK1/2 as IL-3-activated, staurosporine-resistant Bcl2 kinases. Proc Natl Acad Sci U S A. 2000;97:1578−83. doi:10.1073/pnas.97.4.1578.
- Zou P, Xia Y, Ji J, Chen W, Zhang J, Chen X, Rajamanickam V, Chen G, Wang Z, Chen L, et al. Piperlongumine as a direct TrxR1 inhibitor with suppressive activity against gastric cancer. Cancer Lett. 2016;375:114−26. doi:10.1016/j.canlet.2016.02.058.
- Makhov P, Golovine K, Teper E, Kutikov A, Mehrazin R, Corcoran A, Tulin A, Uzzo RG, Kolenko VM. Piperlongumine promotes autophagy via inhibition of Akt/mTOR signalling and mediates cancer cell death. Br J Cancer. 2014;110:899−907. doi:10.1038/bjc.2013.810.
- Wang Y, Wang JW, Xiao X, Shan Y, Xue B, Jiang G, He Q, Chen J, Xu HG, Zhao RX, et al. Piperlongumine induces autophagy by targeting p38 signaling. Cell Death Dis. 2013;4:e824. doi:10.1038/cddis.2013.358. PMID:24091667
- De Deurwaerdere P, Di Giovanni G, Millan MJ. Expanding the repertoire of L-DOPA's actions: A comprehensive review of its functional neurochemistry. Prog Neurobiol. 2017;151:57−100.
- Guo YJ, Dong SY, Cui XX, Feng Y, Liu T, Yin M, Kuo SH, Tan EK, Zhao WJ, Wu YC. Resveratrol alleviates MPTP-induced motor impairments and pathological changes by autophagic degradation of alpha-synuclein via SIRT1-deacetylated LC3. Mol Nutr Food Res. 2016;60:2161−75. doi:10.1002/mnfr.201600111.
- Lin TK, Chen SD, Chuang YC, Lin HY, Huang CR, Chuang JH, Wang PW, Huang ST, Tiao MM, Chen JB, et al. Resveratrol partially prevents rotenone-induced neurotoxicity in dopaminergic SH-SY5Y cells through induction of heme oxygenase-1 dependent autophagy. Int J Mol Sci. 2014;15:1625−46. doi:10.3390/ijms15011625.
- Jin F, Wu Q, Lu YF, Gong QH, Shi JS. Neuroprotective effect of resveratrol on 6-OHDA-induced Parkinson's disease in rats. Eur J Pharmacol. 2008;600:78−82. doi:10.1016/j.ejphar.2008.10.005.
- Lu Y, Liu J, Li H, Gu L. Piperine Ameliorates Lipopolysaccharide-Induced Acute Lung Injury via Modulating NF-kappaB Signaling Pathways. Inflammation. 2016;39:303−8. doi:10.1007/s10753-015-0250-x.
- Yang W, Chen YH, Liu H, Qu HD. Neuroprotective effects of piperine on the 1-methyl-4-phenyl-1,2,3,6-tetrahydropyridine-induced Parkinson's disease mouse model. Int J Mol Med. 2015;36:1369−76. doi:10.3892/ijmm.2015.2356.
- Liu J, Chen M, Wang X, Wang Y, Duan C, Gao G, Lu L, Wu X, Wang X, Yang H. Piperine induces autophagy by enhancing protein phosphotase 2A activity in a rotenone-induced Parkinson's disease model. Oncotarget. 2016;7:60823−43. doi:10.18632/oncotarget.11661.
- Dunham NW, Miya TS. A note on a simple apparatus for detecting neurological deficit in rats and mice. J Am Pharm Assoc Am Pharm Assoc. 1957;46:208−9. doi:10.1002/jps.3030460322.
- Ogawa N, Hirose Y, Ohara S, Ono T, Watanabe Y. A simple quantitative bradykinesia test in MPTP-treated mice. Res Commun Chem Pathol Pharmacol. 1985;50:435−41.
- Hasegawa K, Yasuda T, Shiraishi C, Fujiwara K, Przedborski S, Mochizuki H, Yoshikawa K. Promotion of mitochondrial biogenesis by necdin protects neurons against mitochondrial insults. Nat Commun. 2016;7:10943. doi:10.1038/ncomms10943. PMID:26971449
- Spinazzi M, Casarin A, Pertegato V, Salviati L, Angelini C. Assessment of mitochondrial respiratory chain enzymatic activities on tissues and cultured cells. Nat Protoc. 2012;7:1235−46. doi:10.1038/nprot.2012.058.
- Yang W, Wang X, Duan C, Lu L, Yang H. Alpha-synuclein overexpression increases phospho-protein phosphatase 2A levels via formation of calmodulin/Src complex. Neurochem Int. 2013;63:180−94. doi:10.1016/j.neuint.2013.06.010.
- Du TT, Wang L, Duan CL, Lu LL, Zhang JL, Gao G, Qiu XB, Wang XM, Yang H. GBA deficiency promotes SNCA/alpha-synuclein accumulation through autophagic inhibition by inactivated PPP2A. Autophagy. 2015;11:1803−20. doi:10.1080/15548627.2015.1086055.