
ABSTRACT
The macroautophagy/autophagy and inflammasome pathways are linked through their roles in innate immunity and chronic inflammatory disease. Ceramide-1-phosphate (C1P) is a bioactive sphingolipid that regulates pro-inflammatory eicosanoid production. Whether C1P also regulates autophagy and inflammasome assembly/activation is not known. Here we show that CPTP (a protein that traffics C1P from its site of phosphorylation in the trans-Golgi to target membranes) regulates both autophagy and inflammasome activation. In human epithelial cells, knockdown of CPTP (but not GLTP [glycolipid transfer protein]) or expression of C1P binding-site point mutants, stimulated an 8- to 10-fold increase in autophagosomes and altered endogenous LC3-II and SQSTM1/p62 protein expression levels. CPTP depletion-induced autophagy elevated early markers of autophagosome formation (Golgi-derived ATG9A-vesicles, WIPI1), required key phagophore assembly and elongation factors (ATG5, ATG7, ULK1), and suppressed MTOR phosphorylation and that of its downstream target, RPS6KB1/p70S6K. Wild-type CPTP overexpression exerted a protective effect against starvation-induced autophagy. In THP-1 macrophage-like surveillance cells, CPTP knockdown induced not only autophagy but also elevated CASP1/caspase-1 levels, and strongly increased IL1B/interleukin-1β and IL18 release via a NLRP3 (but not NLRC4) inflammasome-based mechanism, while only moderately increasing inflammatory (pyroptotic) cell death. Inflammasome assembly and activation stimulated by CPTP depletion were autophagy dependent. Elevation of intracellular C1P by exogenous C1P treatment (instead of CPTP inhibition) also induced autophagy and IL1B release. Our findings identify human CPTP as an endogenous regulator of early-stage autophagosome assembly and inflammasome-driven, pro-inflammatory cytokine generation and release.
Abbreviations
| 7AAD | = | 7-aminoactinomycin-D |
| ACTB | = | actin beta |
| C1P | = | ceramide-1-phosphate |
| CPTP | = | ceramide-1-phosphate transfer protein |
| CPTPi | = | CPTP inhibition |
| EBSS | = | Earle's balanced salt solution |
| FLICA | = | fluorescent labeled inhibitors of caspase |
| GLTP | = | glycolipid transfer protein |
| IL1B | = | interleukin 1 beta; |
| IL18 | = | interleukin 18, LAMP1: lysosomal associated membrane protein 1 |
| LPS | = | lipopolysaccharide |
| MAN2A1 | = | mannosidase alpha class 2A member 1 |
| MAP1LC3B/LC3B | = | microtubule associated protein 1 light chain 3 beta |
| MTOR | = | mechanistic target of rapamycin |
| NLR | = | Nod-like receptor |
| NLRC4 | = | NLR family CARD containing 4 |
| NLRP3 | = | NLR family pyrin domain containing 3 |
| PA | = | phosphatidic acid |
| PMA | = | phorbol myristate |
| proCASP3 | = | procaspase-3 |
| PtdIns | = | phosphatidylinositol |
| PYCARD | = | PYD and CARD domain containing |
| RPS6KB1 | = | ribosomal protein S6 kinase B1 |
| S1P | = | sphingosine-1-phosphate |
| TGN | = | trans-Golgi network |
| ULK1 | = | unc-51-like autophagy activating kinase 1 |
In eukaryotic cells, sphingolipids serve not only as structural elements helping to form membrane lipid raftsCitation1–5 but also can act as reservoirs for production of bioactive signaling metabolites such as sphingosine, sphingosine-1-phosphate (S1P), ceramide, and ceramide-1-phosphate (C1P).Citation6–11 These simple sphingolipids regulate various physiological events including cell stress response and programmed cell death (autophagy and apoptosis) in ways that can either promote cell survival and growth, or tip the balance to cell death, depending on the specific cellular context.Citation10–21 Stressed eukaryotic cells can forestall death by controlled degradation of select nonessential or dysfunctional cellular components via the process of autophagy.Citation22 Stress inducers such as starvation or infection trigger this prosurvival process. During autophagy, targeted cytoplasmic constituents are sequestered from the rest of the cell within intracellular, double-membrane autophagosomes and eventually degraded after fusion with lysosomes.Citation22–26 Autophagy not only rids the cell of compromised organelles, but can ensure cell survival by maintaining cellular energy levels while salvaging and recycling essential cellular components. By contrast, apoptosis is cellular suicide orchestrated to eliminate unnecessary, defective and/or unhealthy cells via an orderly sequence of events involving generation of membrane blebs to contain the release of harmful or inflammatory substances.Citation27,Citation28 Apoptosis is crucial for tissue development and maintenance.
The opposing roles of certain sphingolipid metabolites in the regulation of autophagy and apoptosis are exemplified by ceramide and S1P.Citation10,Citation11,Citation17–20 Whereas increases in intracellular ceramide driven by chemotherapy can stimulate cell death, S1P increase stimulated by nutrient deprivation induces autophagy that prolongs cell viability. The balance between ceramide and S1P levels, known as the ‘sphingolipid rheostat,’ is linked to cell fate.Citation10,Citation11,Citation17–20 Of emerging importance with respect to prosurvival cell processes is C1P, the naturally-occurring acylated analog of S1P. C1P can stimulate cell proliferation, promote cell migration, and regulate phagocytosis and inflammation.Citation7,Citation29–31 Currently unclear is whether altered intracellular levels and/or distributions of C1P exert regulatory effects on apoptosis, autophagy, or pyroptosis. The latter is an inflammatory form of programmed cell death associated with the surveillance and defense processes of innate immunity.Citation32–35 In pyroptotic cells, inflammasome assembly/activation leads to the production and release of pro-inflammatory cytokines, e.g. IL1B/interleukin-1β and IL18/interleukin-18, as well as other cytoplasmic signals that induce adhesion molecule expression by mesenchymal and endothelial cells. The ensuing infiltration of inflammatory and immune cells triggers fever, vasodilation, and hypotension.
A recently discovered human protein that transfers C1P between membranes and regulates C1P levels/distribution within cells is human CPTP (ceramide-1-phosphate transfer protein).Citation36 CPTP represents a new member in the GLTP (glycolipid transfer protein) family, characterized by a modified GLTP fold that selectively binds C1P rather than glycosphingolipids, ceramide, or other lipids with phosphate head groups, e.g. S1P or phosphatidic acid.Citation36,Citation37 C1P is synthesized in the trans-Golgi network (TGN) by CERK (ceramide kinase), the only established anabolic producer of C1P in mammalian cells.Citation38 When CPTP is transcriptionally downregulated by RNAi, C1P accumulates in the TGN, promoting arachidonic acid release and downstream generation of pro-inflammatory eicosanoids, presumably by enhanced translocation of PLA2G4A/cytosolic phospholipase A2α to the TGN.Citation36 Our investigation reveals that C1P-specific CPTP, but not glycolipid-specific GLTP, endogenously regulates autophagy, inflammasome-mediated IL1B and IL18 processing, and pyroptosis, but not apoptosis.
Results
No apoptosis induction by CPTP up- or downregulation
C1P exerts ‘anti-apoptotic’ effects on cells,Citation7,Citation29–31 and CPTP downregulation alters C1P intracellular levels and distribution.Citation36 So we first assessed whether CPTP up- or downregulation induces apoptosis. A shows flow cytometry analyses of cells overexpressing CPTP or depleted of CPTP by CPTP-shRNA after incubation with ANXA5/annexin-5 tagged APC/allophycocyanin to label cell surface-exposed phosphatidylserine and with 7AAD/7-aminoactinomycin-D to label DNA in permeabilized nuclei (dead cells).Citation27 The labeling patterns of treated and control cells showed no significant differences in early apoptotic cell death (A). Scatterplots are provided in Fig. S1. The levels of CPTP up- or downregulation at the transcript and protein levels are shown in Fig. S2. We also analyzed proCASP3/procaspase-3 and nuclear PARP (poly[ADP-ribose] polymerase) status by western immunoblotting (B). ProCASP3 processing into active CASP3 involves cleavage by upstream caspases and assembly of the p17 and p12 fragments into heterotetramers. Apoptosis is then initiated by CASP3 cleavage of PARP into an active 89-kDa fragment and a 24-kDa DNA-binding fragment that facilitate cell disassembly. CASP3 serves as a hallmark indicator for cell apoptosis because of its critical executioner role in both the extrinsic (death ligand) and intrinsic (mitochondrial) apoptotic pathways.Citation27,Citation28 Western immunoblots (B) confirmed the lack of cleavage of proCASP3 and PARP in cells with up- or downregulated CPTP expression. Also, no significant decrease in cell viability was detected (C). It is noteworthy that depletion or overexpression of GLTP, which binds and transfers glycosphingolipids but not C1P, also failed to induce apoptosis (data not shown), in agreement with earlier GLTP overexpression data.Citation39
Figure 1. CPTP depletion induces autophagy but not apoptosis. (A) Flow cytometry analyses of HeLa cells stained with ANXA5-APC and 7AAD-PE-Cy5 after transfection for 24 h using control vector (EGFPN1), EGFPN1-CPTP, or shCPTP. Representative raw data are shown in Fig. S1. (B) Western immunoblot analysis for PARP (116 kD), cleaved PARP (89 kD), proCASP3 (32 kD) and cleaved CASP3 (17 kD) at 24 h post transfection, confirming that CPTP expression changes do not induce apoptosis. (C) Cell death/viability at 48 h post transfection analyzed using trypan blue dye exclusion assay. (D) Fluorescence microscopy images of HeLa and HEK-293 cells cotransfected with GFP-LC3 plasmid with either scrambled-siCPTP (control) or siCPTP. Adjacent bar graphs show quantification of LC3-II puncta per cell based on analyses of 20 cells per group in 3 independent experiments carried out in triplicate. Values are means ± s.e.m. *P < 0.05, **P < 0.01, ***P < 0.001 Student t test compared to controls. (E) Western immunoblot analyses of HeLa and HEK-293 cells treated as in (D) but showing CPTP depletion along with SQSTM1 and processed LC3 levels. ACTB (loading control) serves as baseline for ratiometric comparisons of band intensities. (F) Fluorescence microscopy images of HEK-293 cells cotransfected with plasmid encoding mCherry-LC3 and either GFP-GLTP, shGLTP and GFP-vector or GFP-GLTPW96A. (G) Immunoblot analysis of HEK-293 cells cotransfected with plasmid encoding GFP-LC3 and either GFP-GLTP, shGLTP and GFP-vector or GFP-GLTPW96A. Bars: 10 µm.
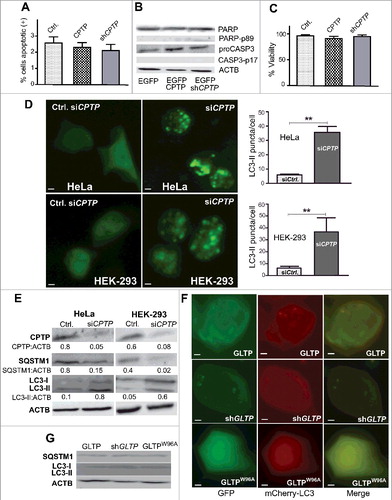
CPTP downregulation induces autophagy
CPTP depletion promotes Golgi fragmentation/dispersion,Citation36 a phenotype also associated with starvation-induced autophagy.Citation40 We thus determined autophagosome status in CPTP inhibition (CPTPi)-treated cells. During autophagy, double-membrane phagophores (precursors to autophagosomes) form in the cytoplasm, increase in number, and engulf cytoplasmic contents; after maturation into autophagosomes, they fuse with lysosomes to generate metabolites that help prolong eukaryotic cell survival during stressful situations.Citation41,Citation42 MAP1LC3B/LC3B (microtubule associated protein 1 light chain 3 beta), which is ubiquitously distributed in nonautophagic cells, undergoes processing and integration into phagophores during autophagy. The autophagosome-associated form of LC3, known as LC3-II, is conjugated to phosphatidylethanolamine causing membrane embedding.Citation40–43 D illustrates the significant elevations (6- to 8-fold) in GFP-LC3-II puncta in CPTP-depleted cells compared to controls for HeLa and HEK-293 cells transfected with GFP-LC3 vector and treated with siCPTP or scrambled control for 24 h. The upregulation of LC3 mRNA by siCPTP treatment in the HeLa and HEK-293 cells was confirmed by qPCR analyses (Fig. S3). Western immunoblotting (E) also showed elevated LC3-II as well as reduced SQSTM1/p62 levels. The latter marker is selectively incorporated into phagophores via direct binding to LC3 and efficiently degraded during autophagy.Citation41,Citation42,Citation44,Citation45 SQSTM1 expression inversely correlates with autophagy upregulation, and thus is a good marker for enhanced autophagic flux.Citation41,Citation42 Flow cytometry analysis (Fig. S4) confirmed autophagy induction. Despite permeabilization of the siCPTP-treated cells by saponin, the GFP-LC3 signal remained trapped due to conversion to GFP-LC3-II embedded in autophagosomal puncta.
We tested if up- or downregulation of human GLTP induces autophagy. Previously, GLTP overexpression in HeLa and HEK-293 cells was found to promote cell rounding,Citation39 a phenotype sometimes associated with autophagy.Citation46 GLTP forms a GLTP-fold containing a lipid binding site that is specific for glycosylated sphingolipids.Citation37,Citation47–49 Fluorescence micrographs (F) showed no autophagosome elevations in HEK-293 cells after cotransfection with a plasmid encoding mCherry-LC3 along with either GFP-wild-type (WT-)GLTP, shGLTP, or GFP-GLTPW96A (ablated glycosphingolipid binding site). A similar outcome was obtained in HeLa cells (Fig. S5). Western immunoblot analyses of LC3-I, LC3-II, and SQSTM1 levels in the HEK-293 cells (G) supported the lack of autophagy induction by GLTP up- or downregulation.
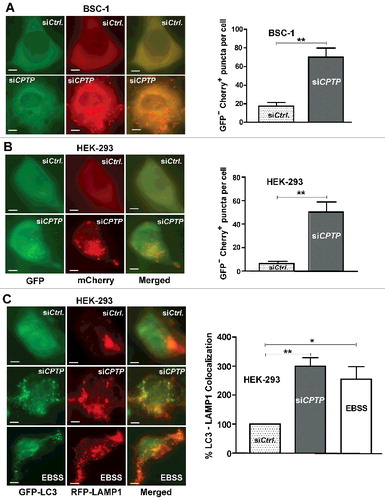
To determine whether the CPTPi-induced increase of autophagosomes reflected blocked downstream processing or elevated production of autophagosomes (increased flux), we transfected BSC-1 and HEK-293 cells with dual-label pBABE-puro-mCherry-EGFP-LC3 plasmid containing shCPTP. Downstream autophagosome processing involves fusion with lysosomes. The resulting acidification quenches the green EGFP signal resulting in yellow-orange and red puncta from mCherry.Citation50 A and B show the resulting 5- to 10-fold elevations in autophagosomes (yellow puncta) and autolysosomes (red puncta) over control cells transfected with vector containing scrambled, nontargeting shCPTP, a result consistent with elevated autophagic flux. This finding was further supported by examining autolysosome and lysosome status. Tracking of LAMP1 (lysosomal associated membrane protein 1) provided more evidence for increased autophagic flux.Citation51,Citation52 C shows the colocalization of GFP-LC3-labeled puncta with RFP-LAMP1 resulting from CPTP knockdown. The dramatic increase in acidic compartments within the cytoplasm of CPTPi-treated cells also was observed by acridine orange staining (Fig. S6). Altogether, our data indicate that WT-CPTP depletion significantly increases autophagic flux.
Figure 2. CPTP depletion induces autophagic flux. (A) BSC-1 and (B) HEK-293 cells were either transfected with dual-label pBABE-puro-mCherry-EGFP-LC3 plasmid containing either scrambled-shCPTP (control) or shCPTP. Quantification of autophagic puncta is depicted in adjacent graphs representing 3 independent experiments. (C) HEK-293 cells cotransfected with plasmid encoding GFP-LC3, RFP-LAMP1 and either scrambled-siCPTP (control) or siCPTP. Bottom row shows positive control for autophagy produced by starving cells for 2 h in EBSS medium before cotransfecting with a plasmid encoding GFP-LC3 and RFP-LAMP1. Bars: 10 µm. The merged imaging suggests colocalization of LC3 and LAMP1 with quantification shown in the adjacent panel. For quantification, 20 cells per group were analyzed in 3 independent experiments carried out in triplicate. Values are means ± s.e.m. *P < 0.05, **P < 0.01, ***P < 0.001 Student t test compared with controls.
Ablation of CPTP activity by mutation of the C1P binding site induces autophagy
To evaluate whether a viable C1P binding site is required for CPTP to regulate autophagy, GFP-CPTPK60A and GFP-CPTPR106L point mutants with ablated C1P binding sitesCitation36 were overexpressed in HEK-293 and HeLa cells. A (merged channel) shows that co-expression of mCherry-LC3 with either GFP-CPTP mutant resulted in elevated autophagosome levels (yellow or yellow-orange puncta). By contrast, GFP-WT-CPTP overexpression produced no increase of puncta. The autophagy induced by CPTP mutant expression was also evident by western immunoblot analyses (B) showing reduced SQSTM1/p62 levels along with increased levels of LC3-II in HEK-293 cells. Together the data indicate a dominant-negative, pro-autophagic effect is exerted by overexpression of CPTP with a defective C1P binding site. This dominant-negative effect was not duplicated by overexpression of GFP-GLTPW96A, which contains a defective glycolipid binding site (F and G).
Figure 3. Ablation of C1P intermembrane transfer by CPTP mutation induces autophagy. (A) Fluorescence microscopy of HEK-293 cells cotransfected with plasmid encoding mCherry-LC3 and GFP-WT-CPTP, GFP-vector control, GFP-CPTPK60A or GFP-CPTPR106L. The adjacent panel provides quantification of LC3 puncta averaged for 20 cells per group. Bars: 10 µm. (B) Western immunoblot analysis of HEK-293 cells treated as in (A) and showing LC3-II:ACTB and SQSTM1:ACTB quantified ratios. (C) Fluorescence microscopy of HEK-293 cells cotransfected with GFP-WIPI and either scrambled siCPTP (control) or siCPTP. In the adjacent bar graph, WIPI1 puncta are quantified using 20 cells per group in 3 independent experiments. Values are means ± s.e.m of 3 independent experiments. *P < 0.05, **P < 0.01, ***P < 0.001 Student t test.
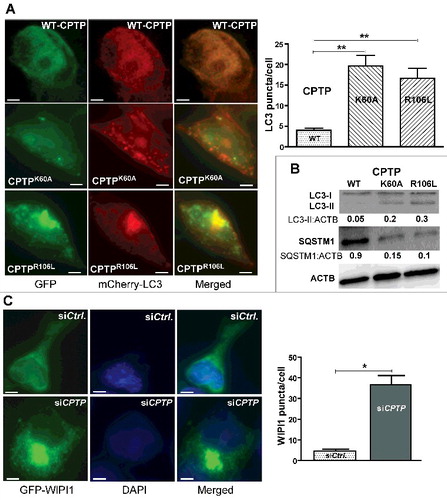
In A, most puncta are yellowish-orange in cells co-expressing mCherry-LC3 and either GFP-CPTPK60A or GFP-CPTPR106L, consistent with colocalization of mutant CPTP with the mCherry-LC3-labelled autophagosomes. Yet, intensely green puncta also occurred in the same cells indicating initial localization of GFP-CPTPK60A or GFP-CPTPR106L to either pre- or nonautophagosomal cytoplasmic puncta that are not yet acidic. To determine if CPTP mutant expression regulates early upstream events involved with autophagosome formation, we assessed for generation of phagophores. These nascent membranes elongate and fold into meniscus shapes that close to form double-membrane autophagosomes via a process requiring activation of initiation complexes (class III phosphatidylinositol [PtdIns] 3-kinase complexes). PtdIns-3-phosphate serves as nucleation sites to help recruit PtdIns-3-phosphate-binding proteins (e.g., WIPI1/Atg18 [WD repeat domain, phosphoinositide interacting 1]) along with other ubiquitin-like proteins needed to form the phagophoreCitation40,Citation53,Citation54; WIPI1 promotes phagophore maturation.Citation54 C shows the striking increase in GFP-WIPI1 puncta in HEK-293 cells expressing CPTPK60A or CPTPK106L versus control cells, consistent with siCPTP treatment affecting phagophore maturation.
We also analyzed whether siCPTP treatment could still induce autophagy when ‘upstream’ autophagy-related proteins involved in early phagophore formation events, such as ATG5, ATG7 and ULK1 (unc-51-like autophagy activating kinase 1) were depleted. ULK1/Atg1 is essential for initiation of phagophore generationCitation55–57, whereas, ATG5 and ATG7 are involved in formation of the ATG12–ATG5-ATG16L1 complex that is essential for phagophore elongation.Citation40 This complex consists of ATG12, a ubiquitin-like protein that conjugates to ATG5, which interacts with ATG16L1 (a WD-repeat-containing molecule). The ATG12–ATG5-ATG16L1 complex is needed for LC3-I conjugation to PE to form LC3-II. When cells were depleted of autophagy-essential ATG5, ATG7 or ULK1, siCPTP failed to induce autophagy as shown by the lack of increased mCherry-LC3-II puncta (Fig. S7). Fig. S8 confirms low LC3-II levels by western immunoblotting.
Golgi fragmentation/dispersion induced by CPTP depletion involves ATG9A vesicles
As mentioned earlier, CPTPi induces TGN membrane fragmentation and disintegration of Golgi cisternal stacks as revealed by various fluorescent antibody markers for cis- and trans-Golgi in BSC-1 cells (Fig. S11 in Citationref. 36). To assess the situation in siCPTP-treated HEK-293 cells, we tracked Golgi integrity using Cherry-MAN2A1 (mannosidase alpha class 2A member 1), a Golgi cis/medial marker, and confirmed the striking Golgi fragmentation/dispersion (A). A similar phenotype was exhibited in cells subjected to nutrient deprivation (positive control), as originally reported by Takahashi et al.Citation58
Figure 4. Golgi fragments induced by CPTP depletion partially localize with LC3. (A) HEK-293 cells grown in complete medium, were cotransfected with a plasmid encoding GFP-LC3 and mCherry-MAN2A1 (medial Golgi marker) and then treated with scrambled-siCPTP (control), siCPTP, or subjected to serum starvation (EBSS, 2 h). The green channel shows LC3-II puncta, the red channel shows the medial-Golgi stacks visualized with mCherry-MAN2A1, and the merged yellow channel shows colocalized LC3-II and Golgi fragments. In the adjacent bar graph, the colocalization percentage for LC3 and MAN2A1 in the siCPTP- or EBSS-treated cells is normalized to siCtrl-treated cells. Bars: 10 µm. (B) HEK-293 cells, treated with either scrambled-shCPTP and GFP-vector (shCtrl.) or shCPTP and GFP-vector, were immunolabeled with primary antibody (ab) to ATG9A followed by Alexa Fluor 595 secondary antibody. In CPTP-depleted cells, the red channel shows cytoplasmically dispersed ATG9A, which otherwise localizes mostly to the perinuclear space in shCtrl-treated cells. Quantification in the adjacent bar graph involved image analyses of 20 cells per group from 3 independent experiments. Values are means ± s.e.m of 3 independent experiments carried out in triplicate. *P < 0.05, **P < 0.01, ***P < 0.001 Student t test compared to controls.
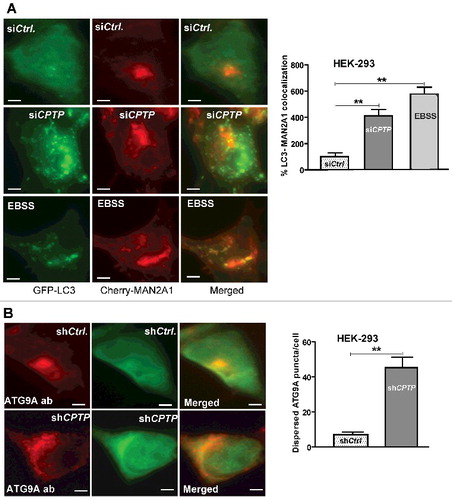
Because CPTP is cytoplasmically dispersed but also associates with the trans-Golgi as well as RAB5- and RAB9-containing endosomes,Citation36 we examined whether CPTP depletion affects localization of ATG9A vesicles that originate from the trans-Golgi. ATG9A vesicles deliver lipids and proteins just after assembly of the phagophore scaffold proteins, but before arrival of other ATG proteins, and contribute to membrane expansion of the phagophore.Citation59–63 ATG9A association with the elongating phagophore is dynamic with removal occurring before closure/completion of the autophagosomal membrane.Citation62,Citation63 In shCPTP-treated cells (B), ATG9A vesicles were dramatically dispersed compared to control cells where intensely staining ATG9A remained in the perinuclear Golgi stacks.
MTOR-dependence of CPTPi-mediated autophagy
We further investigated the impact of CPTP depletion on the early events in autophagosome formation by determining whether MTOR (mechanistic target of rapamycin) plays a mechanistic role in CPTPi-induced autophagy. MTOR is an evolutionarily conserved kinase that coordinately regulates the balance between eukaryotic cell growth and autophagy in response to nutritional status, growth factor and stress signals.Citation64–68 MTOR is phosphorylated at Ser2448 via the phosphoinositide 3-kinase-AKT signaling pathway, and RPS6KB1/p70S6 kinase (ribosomal protein S6 kinase B1) phosphorylation at Thr389 is an activation hallmark by MTOR. Our western immunoblotting analyses (A) indicated that CPTP depletion suppressed phosphorylation of MTOR and RPS6KB1, a downstream target of MTOR. By contrast, WT-CPTP overexpression exerted a protective effect against autophagy by partially mitigating the suppressed MTOR and RPS6KB1 phosphorylation induced by nutrient deprivation. This effect is illustrated in B which shows that overexpression of WT-CPTP (GFP-CPTP) significantly suppressed autophagy induced by 2 h of nutrient deprivation in Earle's balanced salt solution (EBSS) medium. Additional evidence for the mitigating effect of CPTP overexpression on autophagy is provided in A where decreased autophagosome levels (mCherry-LC3 puncta) were observed by fluorescence microscopy, while increased SQSTM1 levels and decreased LC3-II levels were indicated by western immunoblot analyses (B).
Figure 5. Autophagy induced by CPTP depletion is MTOR-dependent. (A) Western immunoblot analyses of CPTP, p-MTOR (phosphorylated Ser2448), MTOR, p-RPS6KB1 (phosphorylated Thr389), and RPS6KB1 levels in HeLa and HEK-293 cells transfected with siCPTP or scrambled-siCPTP (Ctrl) for 24 h. (B) Western immunoblot analyses of p-MTOR, MTOR, p-RPS6KB1, and RPS6KB1 levels in HEK-293 cells overexpressing GFP-CPTP for 24 h (right lane) versus mock controls (left lane) prior to starving the cells in EBSS media for 2 h. In (A) and (B), quantitative insights are provided by ratiometric comparisons of band intensities to ACTB (loading control).
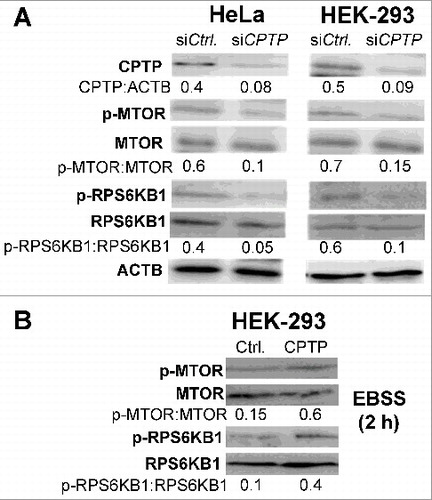
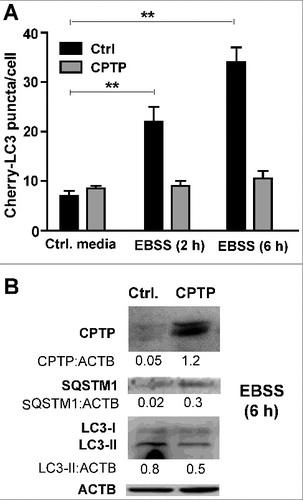
Figure 6. CPTP overexpression mitigates starvation-induced autophagy. (A) Autophagic puncta (mCherry-LC3) levels in HEK-293 cells transfected with plasmid encoding GFP-CPTP or mock GFP-vector control and grown in complete DMEM medium (Control) or starved by incubating for 2 or 6 h in nutrient-depleted EBSS medium. Bar graphs represent 20 cells per group in 3 independent experiments. Values are means ± s.e.m of 3 independent experiments carried out in triplicate. *P < 0.05, **P < 0.01, ***P < 0.001 2-way ANOVA. (B) Western immunoblot analysis of HEK-293 cells expressing either mock GFP-vector control or GFP-WT-CPTP for 24 h prior to subjecting to complete medium (controls) or nutrient-starvation for 6 h in EBSS medium. Quantitative insights are provided by ratiometric comparisons of band intensities to ACTB (loading control).
CPTP depletion induces inflammasome assembly/activation
Previously, we observed that CPTP downregulation in human A549 lung adenocarcinoma basal epithelial cells upregulates pro-inflammatory eicosanoid production.Citation36 Because of emerging links between inflammation and autophagy,Citation69–71 we tested whether changes in CPTP expression regulate inflammasome assembly driven by CASP1/caspase-1.Citation72–74 CASP1 activation was analyzed after depletion or overexpression of CPTP in THP-1 cells because myeloid lineage cells are potent inflammasome expressers.Citation75 Resting, differentiated THP-1 cells (phorbol myristate [PMA]-treated) require priming by agents such as lipopolysaccharide (LPS) to increase transcription of the gene encoding CASP1.Citation76 A second stimulus (nigericin, ATP, or alum) that promotes K+ efflux can then induce inflammasome assembly and CASP1 activation to generate active IL1B.Citation77,Citation78
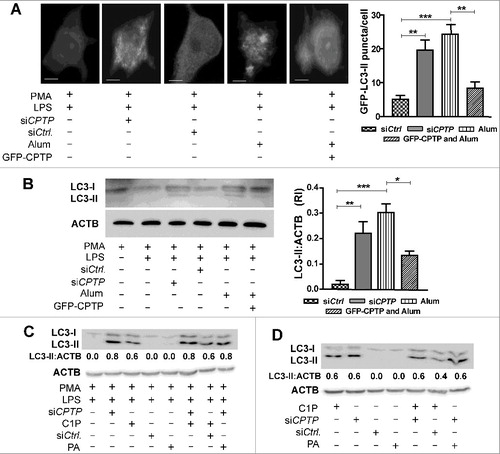
A and B show that CPTP depletion stimulates release of IL1B and IL18 cytokines into the supernatants of differentiated, LPS-primed THP-1 cells to comparable levels as elicited by alum treatment (positive control). The stimulation of IL cytokine release can be traced to elevated CASP1 activity as indicated by the high percentage of fluorescent labeled inhibitors of caspase (FLICA; 660-YVAD-FMK)-positive cells in response to siCPTP (C). FLICA reagent diffuses into cells and irreversibly binds to activated CASP1 enzymes. CASP1-positive cells retain the far-red signal after washing.Citation79,Citation80 To biochemically verify the inflammasome activation, the protein levels of mature IL1B, IL18, and CASP1-p20 in cell supernatants along with proCASP1, proIL1B, and proIL18 levels in cell lysates were measured in THP-1 cells (D). The western immunoblots verified elevated levels of p20 fragments derived from proCASP1 and significant increases in the mature forms of IL1B-p17 (17 kDa) and IL18-p18 (18 kDa) in both LPS-primed siCPTP- and alum-treated cells. Notably, we also found that CPTP overexpression mitigated inflammasome assembly and CASP1 activation in LPS-primed, alum-treated cells (A-D).
Figure 7. CPTP depletion or exogenous C1P treatment increases release of pro-inflammatory cytokines by inducing inflammasome activation. Human THP-1 cells were differentiated, primed, and treated as described in Materials and methods. (A) IL1B and (B) IL18 levels were detected using fluorescent antibody-based ELISA and flow cytometry. (C) Activated CASP1 levels were detected by labeling with FLICA 660-YVAD-FMK followed by flow cytometry. (D) Inflammasome assembly in differentiated, LPS-primed THP-1 cells treated with siCPTP, activated with alum, or overexpressing CPTP, assessed by western immunoblotting for supernatant (Sup) levels of CASP1-p20, IL1B-p17, and cleaved IL18 and cell lysate (Lys) levels of proCASP1, proIL1B, proIL18 and LC3. In the surrounding bar graphs, quantification is provided by ratiometric comparisons of CASP1-p20, IL1B-p17, and cleaved IL18 levels to ACTB (loading control). (E) and (F) IL1B release from THP-1 cells (E) or A549 lung epithelial cells (F) treated with exogenous C1P or PA (1 μM) as described in the Methods and/or transfected with siCPTP or siCtrl. THP-1 cells were differentiated with PMA and primed with LPS prior to treatments. *P < 0.05, **P < 0.01, ***P < 0.001 Student t test.
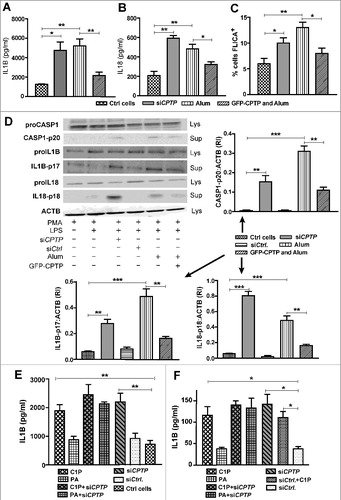
We next determined whether exogenously-added C1P stimulates IL1B production because our earlier findings showed that CPTP depletion increases not only pro-inflammatory eicosanoids but also C1P levels.Citation36 E shows that addition of exogenous C1P, but not phosphatidic acid (PA), to THP-1 cells increased IL1B release to similar levels as induced by CPTP depletion. Moreover, in A549 cells (F), IL1B production/release also was stimulated by addition of exogenous C1P (but not PA) and to comparable levels as by CPTP depletion, albeit at much lower total amounts relative to the macrophage-like THP-1 cells.
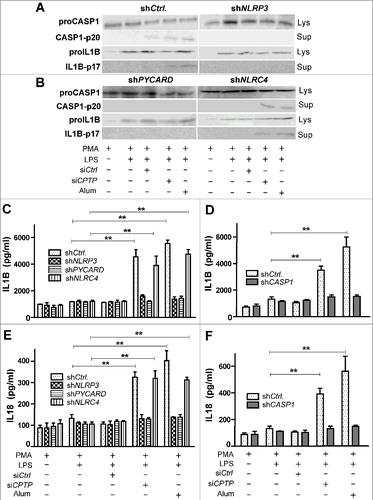
To elucidate the nature of the inflammasome induction by CPTP depletion, we measured the levels of proCASP1, CASP1-p20, proIL1B, IL1B-p17, proIL18, and IL18-p18 in the lysates and supernatants of THP-1 cells depleted of NLRP3 (NLR family pyrin domain containing 3), PYCARD (PYD and CARD domain containing), NLRC4 (NLR family CARD domain containing 4), or CASP1 by shRNA (A and B). Fig. S9 shows the effectiveness of the shRNA-induced knockdown of these inflammasome components. Cell supernatant levels of IL1B (C and D) and IL18 (E and F) were measured by ELISA in similarly treated THP-1 cells. We found that the presence of CASP1, NLRP3, and PYCARD, but not NLRC4, was required for siCPTP-induced stimulation of IL1B and IL18 production and release.
Figure 8. Inflammasome assembly is induced by CPTP depletion. THP-1 cells (differentiated and primed) subjected to (A) shNLRP3, (B) shPYCARD, or shNLRC4 and then analyzed by western blot following treatment with scrambled-siCPTP (control), siCPTP, or alum. ELISA measurements (C-F) showing IL1B levels (C-D) and IL18 levels (E-F) in THP-1 cells treated as in (A) and (B). Values are means ± s.e.m of 3 independent experiments carried out in triplicate. *P < 0.05, **P < 0.01, ***P < 0.001 2-way ANOVA compared to THP-1 control cells (PMA-differentiated and LPS-primed); qPCR analyses of NLRP3, PYCARD, NLRC4 and CASP1 expression (Fig. S9) indicated 6- to 8-fold reduction of mRNA target gene expression by shNLRP3, shPYCARD, shNLRC4 and shCASP1.
IL1B release is known to involve the autophagosomal pathway.Citation81–83 To assess the autophagic status of THP-1 cells depleted of CPTP, fluorescence microscopy (A) and western immunoblot (B) analyses were performed. Marked increases in GFP-LC3-II-positive puncta (A) as well as elevated LC3-II protein levels (B) were observed in THP-1 cells that were either CPTP-depleted or alum-treated. Notably, however, GFP-WT-CPTP overexpression mitigated the autophagy induction observed in the LPS-primed, alum-activated cells. We also determined whether exogenous C1P addition to THP-1 and A549 cells elevated LC3-II protein to levels comparable to those induced by CPTP depletion. C and D (western immunoblots) show that exogenously-added C1P, but not PA, was nearly as effective as siCPTP at increasing autophagosome levels in both cell types.
Figure 9. CPTP depletion or exogenous C1P treatment induces autophagy in THP1 and A549 cells. (A) Fluorescence microscopy showing LC3 puncta in THP-1 cells (differentiated and primed) expressing GFP-LC3. Sample lysates activated with alum (300 mg/ml for 3 h) or cotransfected with siCPTP show significantly increased LC3-II puncta compared to cells transfected with scrambled-siCPTP (control). GFP-WT-CPTP overexpression mitigates the alum-induced autophagy in THP-1 cells. Bars: 10 µm. For quantification (adjacent bar graphs), 15 cells were analyzed per group in 3 independent experiments. Values are means ± s.e.m of 3 independent experiments. (B) Western immunoblot analyses of LC3-II levels in THP-1 cells (differentiated and primed) treated with siCPTP, activated with alum, or overexpressing CPTP. Levels of LC3-II quantified relative to ACTB (loading control) are shown in the adjacent bar graph. *P < 0.05, **P < 0.01, ***P < 0.001 Student t test. (C) and (D) Western immunoblot analyses of LC3-II levels in THP-1 cells (C) or A549 cells (D) treated with exogenous C1P or PA (1 μM) as described in Materials and methods and transfected with siCPTP or siCtrl. THP-1 cells were PMA-differentiated and LPS-primed prior to treatments.
To further assess the interrelationships of CPTP-mediated autophagy, inflammasome activation, and pyroptosis, the effect of CASP1 ablation on autophagy induction was studied in CPTP-depleted cells. A shows the autophagosome levels in murine macrophages lacking CASP1 after siCPTP treatment. GFP-LC3-II puncta levels were similarly elevated in both the CASP1-ablated and wild-type cells following CPTP depletion. The lack proCASP1 in mouse casp1−/− macrophages rendered CPTP-depletion ineffective for producing the active CASP1 (inflammasome activation) that is needed to process proIL1B to active IL1B-p17 (B). THP-1 cells depleted of CASP1 by shCASP1 also showed similarly elevated LC3-II levels as control-treated cells upon cotransfection with shCPTP (C). However, depletion of ATG5, an essential initiator of autophagosome formation, strongly mitigated CPTP-depletion induced CASP1 activation and increased IL1B production (D).
Figure 10. Autophagy induced by CPTP depletion is CASP1 independent, but inflammasome-driven IL1B processing that leads to pyroptotic cell death is autophagy dependent. (A) Fluorescence microscopy showing LC3 puncta in murine macrophages (WT, wild type; CASP1−/−, casp1 knockout cells) primed with LPS and cotransfected with plasmid encoding GFP-LC3, siCPTP or scrambled siControl. Bars: 10 µm). For quantification (bar graph below micrograph), 15 cells were analyzed per group in 3 independent experiments. Values are means + s.e.m of 3 independent experiments. (B) Western immunoblot showing levels of proCASP1, CASP1-p20, proIL1B and IL1B-p17 in murine macrophages (WT or CASP1−/−). Cells were LPS primed and transfected with either siCPTP or non-targeting siCtrl. (C) Western immunoblot analysis of LC3-II in THP-1 cells (differentiated and primed) treated with shCASP1, shCPTP or scrambled shCtrl. ACTB (loading control) provides baseline for ratiometric comparisons of band intensities. (D) Western immunoblot analyses of CASP1-p20, and IL1B-p17 levels in cell supernatants and proCASP1 and proIL1B in cell lysates in THP-1 cells cotransfected with shATG5 and either siCPTP or scrambled siCtrl vectors. (E) Flow cytometry analyses of THP-1 cells stained with 7AAD-PE-Cy5 (670/14 nm bandpass) to detect permeabilized nuclei (DNA labeling) after indicated treatments without transfections or at 24 h post-transfection. All comparisons are relative to controls for each treatment condition, *P < 0.05, **P < 0.01, ***P < 0.001 Student t test.
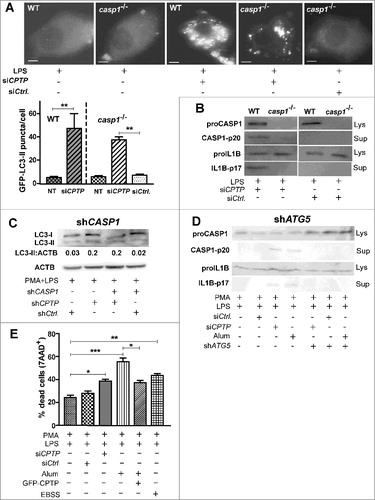
To assess for cell death via pyroptosis, THP-1 cell viability was measured by flow cytometry after 7AAD-staining for dead cells (E). Whereas alum treatment of LPS-primed cells increased cell death by ∼90–95%, CPTP depletion increased cell death by only ∼45%. By contrast, CPTP overexpression decreased cell death of alum-treated cells by ∼48% after correction for LPS priming.
Discussion
The present study shows that human CPTP functions as an endogenous regulator of autophagy and inflammasome assembly/activation, but not of apoptosis. The elevated autophagosome levels induced by CPTP downregulation clearly reflect increased autophagic flux. Overexpressed CPTP point mutants (with C1P ablated binding sites) exert a strong dominant-negative pro-autophagic effect and WT-CPTP overexpression partially mitigates starvation-induced autophagy. HeLa, HEK-293, and BSC-1 epithelial cells as well as THP-1 monocyte-derived macrophages all exhibit CPTPi-induced autophagy. In the latter cells, inflammasome assembly and strong CASP1 activation are accompanied by substantially elevated release of 2 pro-inflammatory cytokines, IL1B and IL18.
CPTP is a human lipid transfer protein that stimulates the intermembrane transfer of C1P but not S1P, ceramide, other sphingolipids or phosphoglycerides and functions as a homeostatic regulator of C1P intracellular synthesis and distribution.Citation36 CPTPi substantially increases intracellular C1P levels while also altering C1P steady-state distributions by increasing trans-Golgi levels and decreasing plasma membrane levels.Citation36 The elevated trans-Golgi C1P levels are consistent with failure of newly synthesized C1P to be transported to other intracellular destinations after synthesis by CERK. Two striking consequences of the CPTPi-induced C1P accumulation at the trans-Golgi are: i) arachidonic acid increase, presumably due to enhanced translocation of cytosolic PLA2G4A/phospholipase A2α to the TGN, and downstream pro-inflammatory eicosanoid production; ii) Golgi fission that manifests as the disruption and dispersion of the Golgi cisternal stacks.Citation36
CPTP depletion also reduced S1P and sphingosine by 25% but only slightly diminished sphingomyelin and monoglycosylated ceramides and left ceramide levels largely unaffected.Citation36 Whether any of the preceding sphingolipid changes are localized to ‘autophagic’ membrane machinery remains unclear but will become addressable once the technical challenges associated with in vitro isolation of phagophores and autophagosomes are overcome. Recently, sphingomyelin overload in Niemann-Pick disease type A patient fibroblasts and SMPD1 (sphingomyelin phosphodiesterase 1)-depleted cancer cells was found to disturb the maturation and closure of autophagic membranes.Citation84
Earlier studies have linked sphingolipid metabolites, such as S1P and ceramide, to the regulation of programmed cell death processes (autophagy and apoptosis).Citation10–20 Ceramide has long been known as a death-promoting lipid via apoptosis or autophagy, whereas S1P exerts pro-mitogenic growth and is a survival stimulator, prompting the conceptual development of the “ceramide-S1P rheostat” as contributing to the life-or-death fate of cells stressed by environmental factors (e.g., chemical, bacterial, or viral agents).Citation10,Citation11 Notably, depletion of Arabidopsis AT2G34690/ACD11, a plant CPTP ortholog that specifically binds/transfers C1P and phyto-C1P,Citation85 increases susceptibility for stress-induced cell death.Citation86 In acd11 mutant plants, levels of C1P and phosphorylated sphingoid bases are moderately elevated but certain phytoceramides are acutely elevated.Citation85 The findings support the idea of plant autophagic cell death promotion by ceramide species with specific acyl chain compositionsCitation16,Citation18 and regulation by the homeostatic ceramide:(C1P+S1P) ratio.
In human cells, CPTP depletion clearly induces autophagy, but progression to cell death appears to be cell-type specific. Epithelial cells (HEK-293 or HeLa) maintain full viability 48 h after CPTPi treatment despite autophagy induction. Consistent with this observation are the relatively unchanged ceramide levels but elevated C1P levels (∼7 fold) and only slightly decreased S1P levels (∼25%) in CPTP-depleted human A549 lung epithelial cells.Citation36 Interestingly, endogenous C1P elevation, induced by CPTPi or by exogenous treatment with C1P (but not PA), increases autophagosome levels and IL1B release in both A549 and THP-1 cells. Not surprisingly, IL1B levels released from macrophage-like THP-1 cells are tremendously higher than those of A549 lung epithelial cells in agreement with recent observations.Citation87 The strong CASP1 activation and high level IL1B and IL18 release by THP-1 cells, eventually results in cell death by pyroptosis.
Altered CPTP expression regulates the upstream events of autophagy
CPTP depletion affects early upstream events linked to PAS regulation and generation as well as early phosphorylation signaling events associated with MTOR and downstream RPS6KB1. MTOR is a key kinase that homeostatically regulates eukaryotic cell growth and autophagy in response to nutritional status, growth factor and stress signals.Citation64–68 MTOR phosphorylation at Ser2448 by upstream AKT, and MTOR phosphorylation of downstream RPS6KB1 at Thr389 block autophagy. MTOR activation prevents ULK-mediated ULK1-ATG13-RB1CC1/FIP200 phosphorylation that is needed to trigger autophagy by initiating formation of autophagosomes. CPTP depletion suppresses the phosphorylation of MTOR and RPS6KB1 to help induce autophagy, whereas, WT-CPTP overexpression exerts a protective effect against starvation-induced autophagy by partially mitigating the suppressed MTOR and RPS6KB1 phosphorylation.
CPTP downregulation also affects autophagy by increasing ATG9 vesicles that contribute to phagophore assembly. Notably, the time frame associated with CPTPi-induced Golgi dispersion/fragmentation and ATG9 vesicle increase generally coincides with autophagic flux elevation. ATG9 vesicle increases also occur during starvation-induced autophagy.Citation58 ATG9 vesicles supply Golgi-derived lipids and proteins to the forming phagophore membranes.Citation59–63 Given the C1P elevation induced by CPTP depletion in the trans-Golgi,Citation36 it appears that C1P could play a role in ATG9 vesicle formation and/or fusion with other nascent membranes (e.g., omegasomes) during phagophore initiation and maturation. Indeed, low levels of C1P increase the rate of Ca++-mediated membrane fusion and C1P generated by Ca++-dependent CERK promotes phagolysosome formation in neutrophils.Citation88 Autophagy is stimulated by Ca++ mobilization from the ER by treatment with vitamin D, ionomycin, or thapsigargin. Chelation of Ca++ by BAPTA-AM inhibits GFP-LC3 puncta formation suggesting that autophagosome formation is Ca++-dependent.Citation89 Alternatively, C1P buildup in omegasomes or related nascent membranes might regulate autophagosome formation by altering the functionality of specific autophagy-related proteins such as UVRAG/UV-resistance associated-gene which contains a putative C1P binding site. Taken together, the preceding scenario provides a model for how elevated C1P levels at the right cellular location (e.g., ATG9 vesicles) could fuel increased autophagic flux and how safeguarding of localized C1P levels by CPTP could help maintain normal Golgi organization.
CPTP expression regulates inflammasome assembly and interleukin generation/release
High-molecular-weight complexes formed by a NLR/Nod-like receptor family subgroup (inflammasomes) activate CASP1 to mediate the maturation of the pro-inflammatory IL1B and IL18 cytokines. Several NLR molecules exist including NLRP3 and NLRC4, along with auxiliary proteins such as PYCARD and proCASP1. NLRs share a central NACHT domain that triggers self-oligomerization and can be activated by pathogen-associated molecules and host-derived alarmins that indicate cell injury or stress.Citation32–34,Citation74 The pro-inflammatory response induced by IL1B and IL18 secretion includes phagocyte recruitment and activation, whereas the pyroptotic cell death of macrophages releases intracellular pathogens thereby increasing their susceptibility to neutrophil-mediated destruction.Citation69–74
Several lines of evidence indicate that CPTP depletion induces CASP1 activation and inflammasome assembly in primed THP-1 macrophage-like cells. The data include: i) increased p20 fragments derived from proCASP1; ii) elevated active CASP1 levels detected by 660-YVAD-FMK fluorogenic inhibitor; iii) increased IL1B and IL18 release; and iv) elevated pyroptotic cell death. The CPTPi-induced release of IL1B and IL18 relies on NLRP3- and not NLRC4-mediated inflammasome assembly. Notably, the levels of IL1B and IL18 release stimulated by CPTP depletion are comparable with those achieved by alum treatment. Yet, the pyroptotic cell death is significantly less than that observed with alum treatment.
Growing evidence indicates involvement of the autophagic intracellular machinery in the release of the mature inflammatory IL1B and IL18 cytokines.Citation81–83 Our data clearly show autophagy induction by CPTP depletion in THP-1 monocyte-derived macrophages, as well as mitigation of CPTPi induced IL1B release when autophagy is downregulated by ATG5 depletion. CPTP overexpression, a condition that partially mitigates starvation-induced autophagy, also partially mitigated LPS- or alum-induced CASP1 activation (53%) and diminished release of IL1B and IL18 by 62% and 35%, respectively. Altogether, the findings suggest that the autophagy induced by CPTP depletion upregulates NLRP3 inflammasome-driven production and release of IL1B and IL18, while tempering cell death (compared to alum). The enhanced and prolonged production of cytokines and eicosanoids by CPTPi-induced autophagy could serve to sustain the arrival of additional macrophages and neutrophils. Future studies will be needed to test the preceding ideas.
Materials and methods
Cell lines and treatments
HeLa and HEK-293 cells from the American Type Culture Collection (ATCC, CCL-2 and CRL-1573) were grown in DMEM medium (HyClone GE Healthcare, SH30022.01) supplemented with 10% fetal bovine serum (FBS; Thermo Scientific, 10082147) and penicillin/streptomycin (Thermo Scientific, 15140122) at 5% CO2 and 37°C. Prior to transfection using Lipofectamine 2000 (Invitrogen, 11668-019), cells were grown for 24 h to ∼50% confluence. THP-1 cells (ATCC, TIB-202) were maintained at 5% CO2 in RPMI-1640 culture medium (HyClone GE Healthcare, SH30027.01) with high glucose and supplemented with 10% FBS and antibiotics (Thermo Scientific, 15140122). THP-1 cells were differentiated to a macrophage-like state by incubating with 20 nM PMA (Sigma-Aldrich, P1585) overnight,Citation75 washing with phosphate-buffered saline (PBS; Thermo Scientific, 10010023) and allowing to adhere to tissue culture plates (Falcon, 3–353003). PMA-differentiated THP-1 cells were then transfected with CPTP constructs using Lipofectamine-LTX (Invitrogen, 15338030) or by nucleoporation using Amaxa Cell Line Nucleofector Kit V (Lonza, VCA-1003) and program V001 and then primed with LPS (100 ng/ml; Sigma-Aldrich, L2630) for 3–4 h. NLRP3 inflammasome assembly/activation was stimulated in controls by treatment with alum (Sigma-Aldrich, A6435; 300 mg/ml for 3 h).Citation77 TurboGFP-GIPZ lentiviral shRNAmir constructs for ATG5, ATG7, ULK1, ATG9a, NLRPP3, NLRC4, PYCARD, CASP1 and non-targeting (scrambled) control shRNAs were supplied by the University of Minnesota Genomics Center (http://genomics.umn.edu/rna-interference.php). CPTP overexpression and depletion were confirmed by western immunoblotting and quantitative RT-PCR (Fig. S2). Addgene plasmids used in the study were pEGFP-LC3 (24920, deposited by Toren Finkel), pBABE-puro mCherry-EGFP-LC3B (22418, deposited by Jayanta Debnath), mCherry-hLC3B-pcDNA3.1 (40827, deposited by David Rubinsztein), RFP-LAMP1 (1817, deposited by Walther Mothes), pMXs-IP GFP-WIPI1 (38272, deposited by Noboru Mizushima) and mCherry-MAN2A1-N-10 (55074, deposited by Michael Davidson). siRNAs used for CPTP and GLTP were from Santa Cruz Biotechnology, sc78839 and sc95836. Saponin (A9231) was from Sigma Aldrich.
RNA isolation, RT–PCR and qPCR
To evaluate mRNA transcript levels, quantitative PCR was performed.Citation36,Citation39 Briefly, total RNA was isolated using Trizol kits (Invitrogen, 15596026). RNA (1 μg) was reverse transcribed using Superscript III reverse transcriptase (Invitrogen, 18080093). Table S1 shows the forward and reverse primers. Transcript levels were quantified using qPCR SYBR® green assay (Applied Biosystems, 4367659) and primer sequences specific to CPTP.
Western immunoblot analysis and reagents
Semiconfluent cells were collected by manual scraping, lysed in RIPA buffer (Thermo Scientific, 89900), pelleted at 4°C by centrifugation at 16,000 x g, for 15 min, and boiled in Laemmli sample buffer (Bio-Rad, 1610737). Proteins were separated on 12% discontinuous SDS-PAGE gels (Bio-Rad, 4561043EDU), transferred to PVDF membranes (Bio-Rad, 1620177), and immunolabeled using commercial antibodies. Antibodies used were: LC3 (MBL International, PM036), SQSTM1 (Novus Biologicals, NBP1-48320), CASP-p20 (Adipogen, AG-20B-0042-C100), ATG9A (Abcam, ab108338), IL1B (GeneTex, GTX74034), IL18 (Thermo Scientific, PA5-19131), ACTB (BD Biosciences, 612656) MTOR (Cell Signaling Technology,2983), RPS6KB1-Thr389 (Cell Signaling Technology, 9234), RPS6KB1-Ser371 Cell Signaling Technology, 9208), p-MTOR-Ser2448 (Cell Signaling Technology, 5536), CASP3 (Cell Signaling Technology, 9662), cleaved CASP3-Asp175 (Cell Signaling Technology, 9661), PARP (Cell Signaling Technology, 9542), cleaved PARP-Asp214 (Cell Signaling Technology, 9541), CPTP (Santa Cruz Biotechnology, sc247014). Immunoreactive bands were detected by chemiluminescence (ImageQuant LAS4000 system, GE Healthcare, MA, USA).
Apoptosis flow cytometric analysis
Cells were evaluated at 48 h post-transfection using a FACSCalibur flow cytometer (BD Biosciences, CA, USA) with the ANXA5/Annexin V-allophycocyanin/APC Apoptosis Detection kit (BD Biosciences, 561012) according to the manufacturer's recommendations. Briefly, cells were trypsinized, washed with 2.5% FBS in PBS, and incubated with ANXA5-allophycocyanin plus 7-AAD/7-amino actinomycin D-PE/ phycoerythrin-Cy5/cyanine 5 in binding buffer at room temperature for 5 min in the dark. Stained cells were analyzed for phosphatidylserine exposure via ANXA5-APC signal in the FL1 detector (660/20 bandpass filter) and for dead cell DNA binding via 7-AAD PE-Cy5 signal in the FL2 detector (670/14 bandpass filter). Early apoptotic cells stained positive for ANXA5 and negative for 7AADCitation27 and were located in the lower right quadrant.
Autophagosome detection by epifluorescence microscopy
Cells were grown on polylysine (Sigma-Aldrich, P4707)-coated glass coverslips. Briefly, after transfection with plasmids encoding GFP-LC3, mCherry-LC3, or tandem GFP-mCherry-LC3 and labeling with various antibodies followed by secondary antibodies coupled to Alexa Fluor 594 (Thermo Scientific, A-11037) as described in the figure legends, cells were washed with PBS and fixed for 20 min at room temperature with 4% paraformaldehyde (Sigma-Aldrich, P6148). Cells sometimes were counter-stained with DAPI (Sigma-Aldrich, 10236276001) and mounted in 10% PBS, 90% glycerol (Sigma-Aldrich, G5516). After washing, coverslips were mounted on glass slides, and the fixed cells were imaged with a 63 × 1.4 NA apochromatic CS oil-immersion objective on a Leica DM RXA2 microscope using a Hamamatsu ORCA-ER CCD camera. Fluorescence images were acquired through a Leica Plan Apo 63_/1.3 NA glycerol-immersion objective and a Hamamatsu 9100 back-thinned ORCA-AG Digital CCD camera.Citation90 Autophagy was assessed in a minimum of 20 cells per preparation in 3 independent experiments. Cells with 5 or more intense GFP-LC3 puncta were considered autophagic; whereas diffuse cytoplasmic GFP-LC3 staining without puncta was considered nonautophagic. Percent autophagy was determined in a double-blind manner.
Pyroptosis (CASP1) analysis
IL1B and IL18 levels were measured in THP-1 cell supernatents using bead-based sandwich ELISA as per the manufacturer recommendations (LEGENDplex kit, BioLegend, 740102). Briefly, cell supernatant was mixed with specific antibody-coated beads that promote formation of an analyte-antibody complex. After washing, biotinylated detection antibodies were added to bind to the specific analyte adsorbed to the capture beads, thus forming capture bead-analyte-detection antibody sandwiches. Addition of streptavidin-phycoerythrin, which binds to the biotinylated detection antibodies, provides fluorescent signal intensities in proportion to the bound analyte amount. Fluorescent signals were measured by dual-laser flow cytometry and analyzed using LEGENDPLEX data analysis software. Activated CASP1 levels were also assessed by western immuno-blotting of cell supernatant against CASP1-p20-specific antibody as well as with FLICA 660-YVAD-FMK detection reagent (ImmunoChemistry Technology, 9122) which consists of active CASP1 affinity peptide (YVAD), a far-red fluorescent 660 dye label, and a fluoromethyl ketone (FMK) reactive moiety. FLICA analogs are cell permeant enabling whole cell analysis via common fluorescence detection methods.Citation79,Citation91 The far-red FLICA 660-YVAD-FMK inhibitor probe efficiently forms an irreversible, covalent bond with the active CASP1. Cells were stained for 30 min at 37°C with FLICA 660-YVAD-FMK with occasional shaking. FLICA emission of washed cells was then quantified in the FL4 channel of a FACSCalibur flow cytometer. Unstained cells were used to set the gate for flow cytometry analysis.
Exogenous C1P treatment of cells
D-e-palmitoyl (C16) C1P or POPA/PA with palmitoyl sn-1 and oleoyl sn-2 acyl chains were introduced into THP-1 or A549 cells (ATCC, TIB-202 or CCL-185) using the dodecane/ethanol system.Citation92–94 Cells (1 × 10⁵) were treated for 3 h with 1 μM C1P (Avanti Polar Lipids, 860533) or POPA (Avanti Polar Lipids, 840857P) solubilized in 2% dodecane, 98% EtOH (cell media final concentration was 0.002% dodecane, 0.098% EtOH). Previous studies have shown that C1P metabolism to other sphingolipid metabolites (e.g. ceramide) in A549 cells is very slow.Citation92–94
Statistical analysis
Data are expressed as the mean ± SE of at least 3 separate experiments performed in triplicate. The Student t test and 2-way ANOVA (analysis of variance) were performed using GraphPad Prism 5 (GraphPad Software, Inc. La Jolla, CA, USA) to compare the differences between groups. P values < 0.05 were considered statistically significant. Statistically significant differences in the figures are indicated by asterisks (*P < 0.05, **P < 0.01, ***P < 0.001).
Disclosure of Potential Conflicts of Interest
The authors report no conflict of interest and have no relevant financial or nonfinancial relationships to disclose.
Supplemental_data_1393129.doc
Download MS Word (3.5 MB)Acknowledgements
We are grateful to Dr. Denise M. Monack (Stanford University) for providing the immortalized murine C57BL/6 macrophage wild-type and casp1−/− cells lines and to Dr. Sharon Tooze (London Research Institute) for advice regarding the ATG9 antibody. We thank Kul Karanjeet, Ryan Pewowaruk, and Dr. Xianqiong Zou for assistance during early stages of this study, Todd Schuster for assistance with the flow cytometry, and Dr. Rebecca Morris for occasional access to her microscope. We are grateful for support provided by NHLBI RO1-HL125353; NIGMS-RO1-GM45928 & RO1-GM72754; NCI-RO1-CA160333; NCI P30-CA016059, EKS-NICHHD U01-HD087198, NH1C06-RR17393, NCRR S10-RR031535, VA BLR&D BX001792, VA BLR&D 13F-RCS-002, the Paul M. Corman, M.D. Chair in Cancer Research, Hormel Institute Paint-the-Town Pink Breast Cancer Funds, and the Hormel Foundation. The contents of this manuscript do not represent the views of the Department of Veterans Affairs or the United States government.
Additional information
Funding
Notes
† Preliminary reports involving portions of this work were presented at the 2014 ASBMB annual meeting and at the 2015 Keystone Symposium on Autophagy
Related Research Data
References
- Simons K, Ikonen E. Functional rafts in cell membranes. Nature. 1997;387:569–572 doi:10.1038/42408. PMID:9177342
- Brown RE. Sphingolipid organization in biomembranes: what physical studies of model membranes reveal. J Cell Sci. 1998;111:1–9. PMID:9394007
- Brown DA, London E. Functions of lipid rafts in biological membranes. Annu Rev Cell Dev Biol. 1998;14:111–136. doi:10.1146/annurev.cellbio.14.1.111. PMID:9891780
- Goñi FM, Alonso A, Bagatolli LA, Brown RE, Marsh D, Prieto M, Thewalt JL. Phase diagrams of lipid mixtures relevant to the study of membrane rafts. Biochim Biophys Acta. 2008;1781:665–684. doi:10.1016/j.bbalip.2008.09.002. PMID:18952002
- Simons K, Sampaio JL. Membrane organization and lipid rafts. Cold Spring Harb Perspect Biol. 2011;3:e004697. doi:10.1101/cshperspect.a004697.
- Spiegel S, Milstien S. Sphingosine-1-phosphate: an enigmatic signaling lipid. Nature Rev Mol Cell Biol. 2003;4:397–407. doi:10.1038/nrm1103.
- Chalfant CE, Spiegel S. Sphingosine 1-phosphate and ceramide 1-phosphate: expanding roles in cell signaling. J Cell Sci. 2005;118:4605–4612. doi:10.1242/jcs.02637. PMID:16219683
- Hannun YA, Obeid LM. Principles of bioactive lipid signalling: lessons from sphingolipids. Nat Rev Mol Cell Biol. 2008;9:139–150. doi:10.1038/nrm2329. PMID:18216770
- Rosen H, Stevens RC, Hanson M, Roberts E, Oldstone MBA. Sphingosine-1-phosphate and its receptors: structure, signaling, and influence. Annu Rev Biochem. 2013;82:637–662. doi:10.1146/annurev-biochem-062411-130916. PMID:23527695
- Newton J, Lima S, Maceyka M, Spiegel S. Revisiting the sphingolipid rheostat: Evolving concepts in cancer therapy. Exptl Cell Res. 2015;333:195–200. doi:10.1016/j.yexcr.2015.02.025. PMID:25770011
- Espaillat MP, Shamseddine AA, Adada MM, Hannun YA, Obeid LM. Ceramide and sphingosine-1-phosphate in cancer, two faces of the sphinx. Transl Cancer Res. 2015;4:484–499.
- Lavieu G, Scarlatti F, Sala G, Carpentier S, Levade T, Ghidoni R, Botti J, Codogno P. Regulation of autophagy by sphingosine kinase 1 and its role in cell survival during nutrient starvation. J Biol Chem. 2006;281:8518–8527. doi:10.1074/jbc.M506182200. PMID:16415355
- Van Brocklyn JR, Williams JB. The control of the balance between ceramide and sphingosine-1-phosphate by sphingosine kinase: oxidative stress and the seesaw of cell survival and death. Comp Biochem Physiol. 2012;B163:26–36. doi:10.1016/j.cbpb.2012.05.006.
- Taniguchi M, Kitatani K, Kondo T, Hashimoto-Nishimura M, Asano S, Hayashi A, Mitsutake S, Igarashi Y, Umehara H, Takeya H, et al. Regulation of autophagy and its associated cell death by “Sphingolipid Rheostat”: Reciprocal role of ceramide and sphingosine-1-phosphate in the mammalian target of rapamycin pathway. J Biol Chem. 2012;287:39898–39910. doi:10.1074/jbc.M112.416552. PMID:23035115
- Sentelle RD, Senkal CE, Jiang W, Ponnusamy S, Gencer S, Selvam SP, Ramshesh VK, Peterson YK, Lemasters JJ, Szulc ZM, et al. Ceramide targets autophagosomes to mitochondria and induces lethal mitophagy. Nature Chem Biol. 2012;8:831–838. doi:10.1038/nchembio.1059.
- Morad SAF, Cabot MC. Ceramide-orchestrated signalling in cancer cells. Nature Rev Cancer. 2013;13:51–65. doi:10.1038/nrc3398.
- Young MM, Kester M, Wang H-G. Sphingolipids: regulators of crosstalk between apoptosis and autophagy. J Lipid Res. 2013;54:5–19. doi:10.1194/jlr.R031278. PMID:23152582
- Jiang W, Ogretmen B. Autophagy paradox and ceramide. Biochim Biophys Acta. 2014;1841:783–792. doi:10.1016/j.bbalip.2013.09.005. PMID:24055889
- Harvald EB, Olsen ASB, Færgeman NJ. Autophagy in the light of sphingolipid metabolism. Autophagy. 2015;20:658–670.
- Manchon JFM, Uzor N-E, Dabaghian Y, Furr-Stimming EE, Finkbeiner S, Tsvetkov AS. Cytoplasmic sphingosine-1-phosphate pathway modulates neuronal autophagy. Sci Reports. 2015;5:e15213. doi:10.1038/srep15213.
- Tommasino C, Marconi M, Ciarlo L, Matarrese P, Malorni W. Autophagic flux and autophagosome morphogenesis require the participation of sphingolipids. Apoptosis. 2015;20:645–657. doi:10.1007/s10495-015-1102-8. PMID:25697338
- Ravikumar B, Sarkar S, Davies JE, Futter M, Garcia-Arencibia M, Green-Thompson ZW, Jimenez-Sanchez M, Korolchuk VI, Lichtenberg M, Luo S, et al. Regulation of mammalian autophagy in physiology and pathophysiology. Physiol Rev. 2010;90:1383–1435. doi:10.1152/physrev.00030.2009. PMID:20959619
- Choi AJS, Ryter SW, Levine B. Autophagy in human health and disease. N Engl J Med. 2013;368:651–662. doi:10.1056/NEJMra1205406. PMID:23406030
- Green DR, Levine B. To be or not to be? How selective autophagy and cell death govern cell fate. Cell. 2014;157:65–75. doi:10.1016/j.cell.2014.02.049. PMID:24679527
- Jiang P, Mizushima N. Autophagy and human diseases. Cell Res. 2014;24:69–79. doi:10.1038/cr.2013.161. PMID:24323045
- Bento CF, Renna M, Ghislat G, Puri C, Ashkenazi A, Vicinanza M, Menzies FM, Rubinsztein DC. Mammalian autophagy: How does it work? Annu Rev Biochem. 2016;85:685–713. doi:10.1146/annurev-biochem-060815-014556. PMID:26865532
- Hengartner MO. The biochemistry of apoptosis. Nature. 2000;407:770–776. doi:10.1038/35037710. PMID:11048727
- Henson PM, Bratton DL. Anti-inflammatory effects of apoptotic cells. J Clin Invest. 2013;123:2773–2774. doi:10.1172/JCI69344. PMID:23863635
- Gómez-Muñoz A. Ceramide 1-phosphate/ceramide, a switch between life and death. Biochim Biophys Acta. 2006;1758:2049–2056. doi:10.1016/j.bbamem.2006.05.011. PMID:16808893
- Marcu AC, Chalfant CE. Ceramide-1-phosphate, a new bioactive sphingolipid in regulating cell signaling. Future Lipidol. 2007;2:75–84. doi:10.2217/17460875.2.1.75.
- Gomez-Muñoz A, Gangoiti P, Arana L, Ouro A, Rivera I-G, Ordoñez M, Trueba M. New insights on the role of ceramide 1-phosphate in inflammation. Biochim Biophys Acta. 2013;1831:1060–1066. doi:10.1016/j.bbalip.2013.02.001. PMID:23410840
- Bergsbaken T, Fink SL, Brad T, Cookson BT. Pyroptosis: host cell death and inflammation. Nature Microbiol. 2009;7:99–109. doi:10.1038/nrmicro2070.
- Latz E, Xiao TS, Stutz A. Activation and regulation of the inflammasomes. Nature Rev Immunol. 2013;13:397–411. doi:10.1038/nri3452.
- Jorgensen I, Miao EA. Pyroptotic cell death defends against intracellular pathogens. Immunol Rev. 2015;265:130–142. doi:10.1111/imr.12287. PMID:25879289
- Guo H, Callaway JB, Ting JP-Y. Inflammasomes: mechanism of action, role in disease, and therapeutics. Nature Med. 2015;21, 677–687. doi:10.1038/nm.3893. PMID:26121197
- Simanshu DK, Kamlekar R-K, Wijesinghe DS, Zou X, Zhai X, Mishra SK, Molotkovsky JG, Malinina L, Hinchcliffe EH, Chalfant CE, et al. Non-vesicular trafficking by a ceramide-1-phosphate transfer protein regulates eicosanoids. Nature. 2013;500:463–467. doi:10.1038/nature12332. PMID:23863933
- Malinina L, Simanshu DK, Zhai X, Samygina VR, Kamlekar R-K, Kenoth R, Ochoa-Lizarralde B, Malakhova ML, Molotkovsky JG, Patel DJ, et al. Sphingolipid transfer proteins defined by the GLTP-fold. Quart Rev Biophys. 2015;48:281–322. doi:10.1017/S003358351400016X.
- Bornancin F. Ceramide kinase: The first decade. Cell Signal. 2011;23:999–1008. doi:10.1016/j.cellsig.2010.11.012. PMID:21111813
- Gao Y, Chung T, Zou X, Pike HM, Brown RE. Human glycolipid transfer protein (GLTP) expression modulates cell shape. PLoS ONE. 2011;6:e19990. doi:10.1371/journal.pone.0019990. PMID:21625605
- Lamb CA, Yoshimori T, Tooze SA. The autophagosome: origins unknown, biogenesis complex. Nat Rev Mol Cell Biol. 2013;14:759–774. doi:10.1038/nrm3696. PMID:24201109
- Mizushima N, Yoshimori T, Levine B. Methods in mammalian autophagy research. Cell. 2010;140:313–326. doi:10.1016/j.cell.2010.01.028. PMID:20144757
- Klionsky DJ, Abdalla FC, Abeliovich H, Abraham RT, Acevedo-Arozena A, Adeli K, Agholme L, Agnello M, Agostinis P, Aguirre-Ghiso JA, et al. Guidelines for the use and interpretation of assays for monitoring autophagy. Autophagy. 2012;8:445–544. doi:10.4161/auto.19496. PMID:22966490
- Kabeya Y, Mizushima N, Ueno T, Yamamoto A, Kirisako T, Noda T, Kominami E, Ohsumi Y, Yoshimori T. LC3, a mammalian homologue of yeast Apg8p, is localized in autophagosome membranes after processing. EMBO J. 2000;19:5720–5728. doi:10.1093/emboj/19.21.5720. PMID:11060023
- Bjørkøy G, Lamark T, Brech A, Outzen H, Perander M, Øvervatn A, Stenmark H, Johansen T. p62/SQSTM1 forms protein aggregates degraded by autophagy and has a protective effect on Huntington-induced cell death. J Cell Biol. 2005;171:603–614. doi:10.1083/jcb.200507002. PMID:16286508
- Watanabe Y, Tanaka M. p62/SQSTM1 in autophagic clearance of a non-ubiquitylated substrate. J Cell Sci. 2011;124:2692–2701. doi:10.1242/jcs.081232. PMID:21771882
- Burdette DL, Yarbrough ML, Orvedahl A, Gilpin CJ, Orth K. Vibrio parahaemolyticus orchestrates a multifaceted host cell infection by induction of autophagy, cell rounding, and then cell lysis. Proc Natl Acad Sci USA. 2008;105:12497–12502. doi:10.1073/pnas.0802773105. PMID:18713860
- Malinina L, Malakhova ML, Teplov A, Brown RE, Patel DJ. Structural basis for glycosphingolipid transfer specificity. Nature. 2004;430:1048–1053. doi:10.1038/nature02856. PMID:15329726
- Malinina L, Malakhova ML, Kanak AT, Lu M, Abagyan R, Brown RE, Patel DJ. The liganding mode of glycolipid transfer protein is controlled by glycosphingolipid structure. PLoS Biol. 2006;4:e362. doi:10.1371/journal.pbio.0040362. PMID:17105344
- Samygina VR, Popov AN, Cabo-Bilbao A, Ochoa-Lizarralde B, Goni-de-Cerio F, Zhai X, Molotkovsky JG, Patel DJ, Brown RE, Malinina L. Enhance selectivity for sulfatide by engineered human glycolipid transfer protein. Structure. 2011;19:1644–1654. doi:10.1016/j.str.2011.09.011. PMID:22078563
- Kimura S, Noda T, Yoshimori T. Dissection of the autophagosome maturation process by a novel reporter protein, tandem fluorescent-tagged LC3. Autophagy. 2007;3:452–460. doi:10.4161/auto.4451. PMID:17534139
- Yu L, McPhee CK, Zheng L, Mardones GA, Rong Y, Peng J, Mi N, Zhao Y, Liu Z, Wan F, et al. Termination of autophagy and reformation of lysosomes regulated by mTOR. Nature. 2010;465:942–946. doi:10.1038/nature09076. PMID:20526321
- Zhou J, Tan S-H, Nicolas V, Bauvy C, Yang N-D, Zhang J, Xue Y, Codogno P, Shen H-M. Activation of lysosomal function in the course of autophagy via mTORC1 suppression and autophagosome-lysosome fusion. Cell Res. 2013;23:508–523. doi:10.1038/cr.2013.11. PMID:23337583
- Proikas-Cezanne T, Pfisterer SG. Assessing mammalian autophagy by WIPI-1/Atg18 puncta formation. Methods Enzymol. 2009;452:247–259. doi:10.1016/S0076-6879(08)03616-1. PMID:19200887
- Proikas-Cezanne T, Takacs Z, Dönnes P, Kohlbacher O. WIPI proteins: essential PtdIns3P effectors at the nascent autophagosomes. J Cell Sci. 2015;128:207–217. doi:10.1242/jcs.146258. PMID:25568150
- Kim J, Kundu M, Viollet B, Guan K-L. AMPK and mTOR regulate autophagy through direct phosphorylation of ULK1. Nature Cell Biol. 2011;13:132–141. doi:10.1038/ncb2152. PMID:21258367
- Russell RC, Tian Y, Yuan H, Park HW, Chang Y-Y, Kim J, Kim H, Neufeld TP, Dillin A, Guan K-L. ULK1 induces autophagy by phosphorylating Beclin-1 and activating VPS34 lipid kinase. Nature Cell Biol. 2013;15:741–750. doi:10.1038/ncb2757. PMID:23685627
- Lazarus MB, Novotny CJ, Shokat KM. Structure of the human autophagy initiating kinase ULK1 in complex with potent inhibitors. ACS Chem Biol. 2015;10:257−261. doi:10.1021/cb500835z. PMID:25551253
- Takahashi Y, Meyerkord CL, Hori T, Runkle K, Fox TE, Kester M, Loughran TP, Wang H-G. Bif-1 regulates Atg9 trafficking by mediating the fission of Golgi membranes during autophagy. Autophagy. 2011;7:61–73. doi:10.4161/auto.7.1.14015. PMID:21068542
- Young ARJ, Chan EYW, Hu XW, Kochl R, Crawshaw SG, High S, Hailey DW, Lippincott-Schwartz J, Tooze SA. Starvation and ULK1-dependent cycling of mammalian Atg9 between the TGN and endosomes. J Cell Sci. 2006;119:3888–3900. doi:10.1242/jcs.03172. PMID:16940348
- Mari M, Griffith J, Rieter E, Krishnappa L, Klionsky DJ, Reggiori F. An Atg9-containing compartment that functions in the early steps of autophagosome biogenesis. J Cell Biol. 2010;190:1005–1022. doi:10.1083/jcb.200912089. PMID:20855505
- Yamamoto H, Kakuta S, Watanabe TM, Kitamura A, Sekito T, Kondo-Kakuta C, Ichikawa R, Kinjo M, Ohsumi Y. Atg9 vesicles are an important membrane source during early steps of autophagosome formation. J Cell Biol. 2012;198:219–233. doi:10.1083/jcb.201202061. PMID:22826123
- Orsi A, Razi M, Dooley HC, Robinson D, Weston AE, Collinson LM, Tooze SA. Dynamic and transient interactions of Atg9 with autophagosomes, but not membrane integration, is required for autophagy. Mol Biol Cell. 2012;23:1860–1873. doi:10.1091/mbc.E11-09-0746. PMID:22456507
- Zavodszky E, Vicinanza M, Rubinsztein DC. Biology and trafficking of ATG9 and ATG16L1, two proteins that regulate autophagosome formation. FEBS Lett. 2013. 587:1988–1996. doi:10.1016/j.febslet.2013.04.025. PMID:23669359
- Ravikumar B, Vacher C, Berger Z, Davies JE, Luo S, Oroz LG, Scaravilli F, Easton DF, Duden R, O'Kane CJ, et al. Inhibition of mTOR induces autophagy and reduces toxicity of polyglutamine expansions in fly and mouse models of Huntington disease. Nature Genetics. 2004;36:585–595. doi:10.1038/ng1362. PMID:15146184
- Jung CH, Ro S-H, Cao J, Otto NM, Kim D-H. mTOR regulation of autophagy. FEBS Lett. 2010;584:1287–1295 doi:10.1016/j.febslet.2010.01.017. PMID:20083114
- Shimobayashi M, Hall MN. Making new contacts: the mTOR network in metabolism and signalling crosstalk. Nature Rev Mol Cell Biol. 2014;15:155–162. doi:10.1038/nrm3757.
- Efeyan, A, Comb WC, Sabatini DM. Nutrient-sensing mechanisms and pathways. Nature. 2015;517:302–310. doi:10.1038/nature14190. PMID:25592535
- Kim YC, Guan K-L. mTOR: a pharmacologic target for autophagy regulation. J Clin Invest. 2015;125:25–32. doi:10.1172/JCI73939. PMID:25654547
- Kuballa P, Nolte WM, Castoreno AB, Xavier RJ. Autophagy and the immune system. Annu Rev Immunol. 2012; 30:611–646. doi:10.1146/annurev-immunol-020711-074948. PMID:22449030
- von Moltke J, Trinidad NJ, Moayeri M, Kintzer AF, Wang SB, van Rooijen N, Brown CR, Krantz BA, Leppla SH, Gronert K, et al. Rapid induction of inflammatory lipid mediators by the inflammasome in vivo. Nature. 2012;490:107–111. doi:10.1038/nature11351. PMID:22902502
- Deretic V, Saitoh T, Akira S. Autophagy in infection, inflammation and immunity. Nature Rev Immunol. 2013;13:722–737. doi:10.1038/nri3532.
- Lamkanfi M, Dixit VM. Mechanisms and functions of inflammasomes. Cell. 2014;157:1013–1022. doi:10.1016/j.cell.2014.04.007. PMID:24855941
- Sollberger G, Strittmatter GE, Garstkiewicz M, Sand J, Beer H-D. Caspase-1: The inflammasome and beyond. Innate Immunity. 2014;20:115–125. doi:10.1177/1753425913484374. PMID:23676582
- Man SM, Kanneganti T-D. Regulation of inflammasome activation. Immunol Rev. 2015;265:6–21. doi:10.1111/imr.12296. PMID:25879280
- Chanput W, Mes JJ, Wichers HJ. THP-1 cell line: An in vitro cell model for immune modulation approach. Intl Immunopharmacol. 2014;23:37–45. doi:10.1016/j.intimp.2014.08.002.
- Lin XY, Choi MSK, Porter AG. Expression analysis of the human caspase-1 subfamily reveals specific regulation of the CASP5 gene by lipopolysaccharide and interferon-γ. J Biol Chem. 2000;275:39920–39926. doi:10.1074/jbc.M007255200. PMID:10986288
- Hornung V, Bauernfeind F, Halle A, Samstad EO, Kono H, Rock KL, Fitzgerald KA, Latz E. Silica crystals and aluminum salts activate the NALP3 inflammasome through phagosomal destabilization. Nat Immunol. 2008;9:847–856. doi:10.1038/ni.1631. PMID:18604214
- Bauernfeind FG, Horvath G, Stutz A, Alnemri ES, MacDonald K, Speert D, Fernandes-Alnemri T, Wu J, Monks BG, Fitzgerald KA, et al. Cutting edge: NF-kappaB activating pattern recognition and cytokine receptors license NLRP3 inflammasome activation by regulating NLRP3 expression. J Immunol. 2009;183:787–791. doi:10.4049/jimmunol.0901363. PMID:19570822
- Bedner E, Smolewski P, Amstas P, Darzynkiewicz Z. Activation of caspases measured in situ by binding of fluorochrome-labeled inhibitors of caspases (FLICA): correlation with DNA fragmentation. Exp Cell Res. 2000; 259:308–313. doi:10.1006/excr.2000.4955. PMID:10942603
- Muňoz-Planillo R, Kuffa P, Martínez-Colón G, Smith BL, Rajendiran TM, Núňez G. K+ efflux is the common trigger of NLRP3 Inflammasome activation by bacterial toxins and particulate matter. Immunity. 2013;38:1142–1153. doi:10.1016/j.immuni.2013.05.016. PMID:23809161
- Harris J, Hartman M, Roche C, Zeng SG, O'Shea A, Sharp FA, Lambe EM, Creagh EM, Golenbock DT, Tschopp J, et al.. Autophagy controls IL-1β secretion by targeting pro-IL-1β for degradation. J Biol Chem. 2011;286:9587–9597. doi:10.1074/jbc.M110.202911. PMID:21228274
- N Dupont, S Jiang, M Pilli, W Ornatowski, D Bhattacharya, V Deretic. (2011) Autophagy based unconventional secretory pathway for extracellular delivery of IL-1β. EMBO J. 2011;30: 4701–11. doi:10.1038/emboj.2011.398.
- Zhang M, Kenny SJ, Ge L, Xu K, Schekman R. Translocation of interleukin-1β into a vesicle intermediate in autophagy-mediated secretion. eLIFE. 2015;4:e11205. doi:10.7554/eLife.11205. PMID:26523392
- Corcelle-Termeau E, Vindeløv SD, Hämälistö S, Mograbi B, Keldsbo A, Bräsen JH, Favaro E, Adam D, Szyniarowski P, Hofman P, et al. Excess sphingolyelin disturbs ATG9A trafficking and autophagosome closure. AUTOPHAGY. 2016; 12:833–849. doi:10.1080/15548627.2016.1159378. PMID:27070082
- Simanshu DK, Zhai X, Munch D, Hofius D, Markham JE, Bielawski J, Bielawska A, Malinina L, Molotkovsky JG, Mundy JW, et al. Arabidopsis Accelerated Cell Death 11, ACD11, is a ceramide-1-phosphate transfer protein and intermediary regulator of phytoceramide levels. Cell Reports. 2014;6:388–399. doi:10.1016/j.celrep.2013.12.023. PMID:24412362
- Brodersen P, Petersen M, Pike HM, Olszak B, Skov S, Odum N, Jørgensen LB, Brown RE, Mundy J. Knockout of Arabidopsis accelerated-cell-death11 encoding a sphingosine transfer protein causes activation of programmed cell death and defense. Genes Dev. 2002;16:490–502. doi:10.1101/gad.218202. PMID:11850411
- Peeters PM, Wouters EF, Reynaert NL. Immune homeostasis in epithelial cells: evidence and role of inflammasome signaling reviewed. J Immunol Res. 2015; Article ID 828264. doi:10.1155/2015/828264. PMID:26355424
- Hinkovska-Galcheva VT, Boxer LA, Mansfield PJ, Harsh D, Blackwood A, Shayman JA. The formation of ceramide-1-phosphate during neutrophil phagocytosis and its role in liposome fusion. J Biol Chem. 1998;273:33203–33209. doi:10.1074/jbc.273.50.33203. PMID:9837889
- Hoyer-Hansen M, Bastholm L, Szyniarowski P, Campanella M, Szabadkai G, Farkas T, Bianchi K, Fehrenbacher N, Elling F, Rizzuto R, et al. Control of macroautophagy by calcium, calmodulin-dependent kinase kinase-beta, and Bcl-2. Mol Cell. 2007;25:193–205. doi:10.1016/j.molcel.2006.12.009. PMID:17244528
- Hornick JE, Mader CC, Tribble EK, Bagne CC, Vaughan KT, Shaw SL, Hinchcliffe EH. Amphiastral mitotic spindle assembly in vertebrate cells lacking centrosomes. Curr Biol. 2011;21:598–605. doi:10.1016/j.cub.2011.02.049. PMID:21439826
- Amstad PA, Yu G, Johnson GL, Lee BW, Dhawan S, Phelps DJ. Detection of caspase activation in situ by fluorochrome-labeled caspase inhibitors. Biotechniques. 2001;31:608–610. PMID:11570504
- Wijesinghe DS, Subramanian P, Lamour NF, Gentile LB, Granado MH, Bielawska A, Szulc Z, Gomez-Munoz A, Chalfant CE. Chain length specificity for activation of cPLA2α by C1P: use of the dodecane delivery system to determine lipid-specific effects. J Lipid Res. 2009;50:1986–1995. doi:10.1194/jlr.M800367-JLR200. PMID:19075030
- Pettus BJ, Bielawska A, Subramanian P, Wijesinghe DS, Maceyka M, Leslie CC, Evans JH, Freiberg J, Roddy P, Hannun YA, et al. Ceramide 1-phosphate is a direct activator of cytosolic phospholipase A2. J Biol Chem. 2004;279:11320–11326. doi:10.1074/jbc.M309262200. PMID:14676210
- Pettus BJ, Bielawska A, Spiegel S, Roddy P, Hannun YA, Chalfant CE. Ceramide kinase mediates cytokine and calcium ionophore-induced arachidonic acid release. J Biol Chem. 2003;2783:38206–38213. doi:10.1074/jbc.M304816200.